DOI:
10.1039/C8RA07363E
(Paper)
RSC Adv., 2018,
8, 36272-36279
Vivid colours in hyperuniform complex-index photonic structures by resonant interference of photonic band gaps and optical band gaps†
Received
4th September 2018
, Accepted 3rd October 2018
First published on 25th October 2018
Abstract
Hyperuniform photonic structures (HPSs) have been doped with complex index materials to increase their reflectivity and colour expression range. HPSs synthesized using dielectric SiO2 nanoparticles have been mixed with a small amount of dopant nanoparticles (cd ≤ 1%) having a complex refractive index. Various dyes including Sudan I, Sudan Blue II, Alizarin yellow GG, Bromocresol purple and polydopamine (PDA) are used as dopants. Large reflectivity enhancements of HPSs (∼100%) are observed by resonant interference of photonic band gaps (PBGs) and optical band gaps (OBGs). Reflectivity enhancements are observed only when PBGs of HPSs match with OBGs of dopants. The colour expression range of HPS increases by 600% by doping with melanine-like PDA nanoparticles, which have the imaginary part of the refractive index in whole visible range.
Introduction
Biological systems have developed exquisite colouration techniques through long period of evolution. Biochromes are produced mainly by two mechanisms: selective absorption by molecular pigments (pigmentary colour) and reflection by photonic nanostructures (structural colour).1 Biopigments such as melanin, chlorophylls, carotenoid and porphyrin are ascribed to the production of pigmentary colours.2–5 On the other hand, structural colours are generated by collective interference of light with periodic dielectric structures consisting of keratin, collagen, chitin or air.6–8 Although some biochromes are produced exclusively by pigmentary or structural colouration, many of the biological systems generate colours by the combination of both pigmentary and structural colouration to increase colour expression range and contrast.9,10 For example, the adaptive colours of cephalopods are achieved by a complicated interplay of absorption by chromatophores and reflection by photonic structure.11 The brilliant colours of a peacock tail also originate from photonic structures made up of keratin and black melanin nanorods.12 Artificial photonic band gap (PBG) structures have been extensively investigated not only for the purpose of mimicking biological PBG structures but also for utilizing their unique optical properties in displays, sensors and radiation sources.13–17 Unlike the biological ones, however, most of the artificial PBG structures are made solely of transparent dielectric materials without interplay with light-absorbing complex-index materials. There are only a few examples of artificial photonic structures utilizing complex-index materials (![[n with combining low line]](https://www.rsc.org/images/entities/i_char_006e_0332.gif) = n ± iκ), where the real part (n) indicates the phase velocity and the imaginary part (κ) indicates the attenuation amount.18,19
= n ± iκ), where the real part (n) indicates the phase velocity and the imaginary part (κ) indicates the attenuation amount.18,19
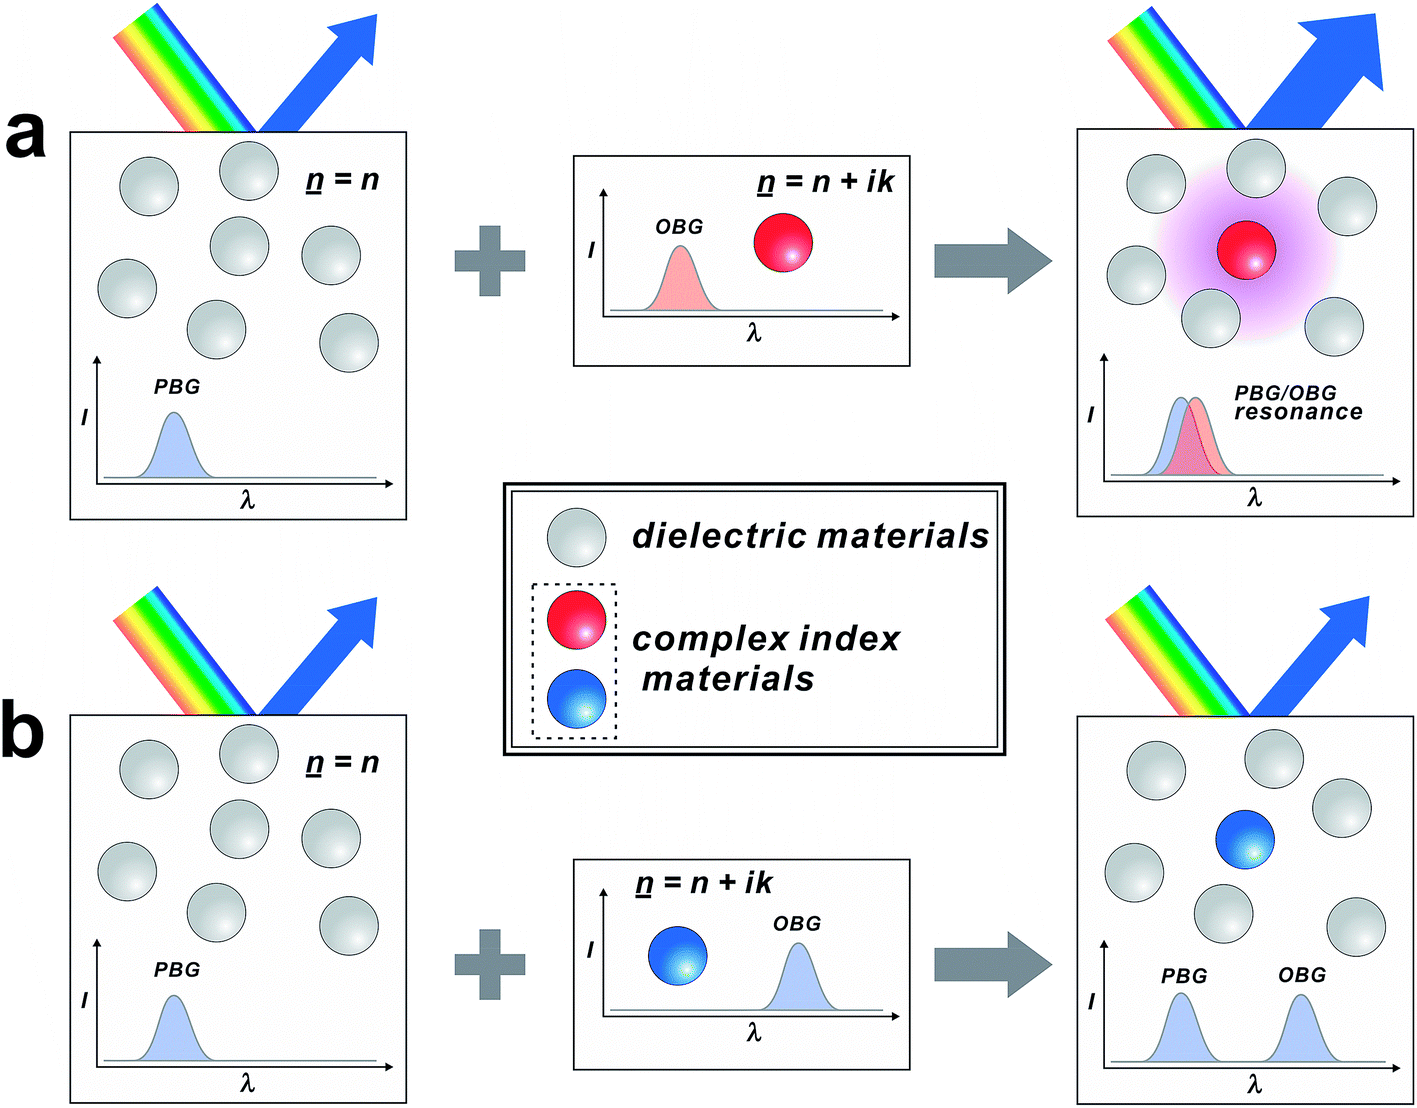
Herein, we report an approach for creating hyperuniform photonic structures (HPSs) exhibiting vivid colours by introducing complex index materials as dopants (Scheme 1). Our approach utilizes resonant interference between the reflection by PBGs of HPSs and absorption by the optical band gaps (OBGs) of dopants. HPS is a colloidal nanoparticle solution exhibiting PBGs, where there is no regular order in the long range but only short-range order.20 Due to lack of crystallinity, HPSs exhibit unique angle-independent photonic colours unlike other conventional crystalline counterparts.21–23 Since they can be easily tuned by various chemical and electrical stimuli, the angle-independent photonic colours of HPSs have been widely utilized in displays and sensors. For example, Kang et al. reported full-colour tunable photonic pixels and micro-electric field sensors based on HPSs.24 Despite these promising properties, their practical applications are often hindered by their relatively low reflectivity and faint colours compared to those of their crystalline counterparts, which partially originate from the lack of crystallinity and low refractive index contrast. While these low optical properties can be enhanced by increasing the refractive index contrast, the choice of material pair is quite limited.25,26 Instead of synthesizing photonic structures with new materials, in this study, we employed a small amount of complex index dopants in HPSs, which are made of conventional dielectric materials such as SiO2. With the addition of a small amount of dopants (<1%), the reflectivity and the colour expression range of HPSs increased by 100% and 600%, respectively, compared with that of undoped HPSs. In this case, a strong correlation between PBGs and OBGs was observed.
 |
| | Scheme 1 Reflectivity enhancement of HPS by PBG/OBG resonance. | |
Experimental section
Materials and instruments
Tetraethyl orthosilicate (TEOS, 98%), dopamine·hydrochloride, tris (hydroxymethyl) aminomethane (Tris) and potassium persulfate (99+%) were purchased from Sigma-Aldrich. Sudan I, Sudan Blue II and Alizarin Yellow GG were purchased from Tokyo Chemical Industry Co., Ltd. and ethyl alcohol anhydrous (99.9%) was purchased from Daejung Chemicals. Bromocresol purple and sodium n-dodecyl sulfate (99%) were purchased from Alfa Aesar and N,N′-methylenebisacrylamide was purchased from Fluka Chemicals. Styrene (≥99%) was purchased from Sigma-Aldrich and purified through a neutral alumina column to remove inhibitors. All other chemicals were used without further purification. Deionized (DI) water (>18.4 MΩ cm) was produced by Milli-Q (Millipore, USA). The synthesized nanoparticles were purified by sequential centrifugations using Supra R22 (Hanil, Korea) and CF-10 (Daihan-Scientific, Korea). Diameters of the synthesized nanoparticles were determined by taking the average of over 100 particle images obtained with a scanning electron microscope (Hitachi S-4800). Absorbance spectra of dyes were obtained on a UV-Vis spectrometer (Agilent 8453); reflectance spectra and CIE (Commission International de l'Eclairage) XYZ colour spaces of HPSs were obtained using an HR2000+ spectrometer (Ocean Optics, USA) equipped with UV-Vis-NIR light source. Photograph images were taken with Nikon D-90.
Synthesis of SiO2, polydopamine (PDA) and polystyrene (PS) nanoparticles
SiO2 nanoparticles were synthesized by the conventional Stöber method using TEOS.27 First, ethanolic ammonia solution was prepared by mixing ammonia solution (60 mL) and anhydrous ethanol (90 mL). TEOS (5 mL) was dissolved in anhydrous ethanol (150 mL) and then, ethanolic ammonia solution was added drop-wise to the TEOS solution with stirring for 1 day. Diameter of SiO2 nanoparticles was controlled by changing the concentration of either TEOS or/and ammonia. PDA nanoparticles were synthesized by oxidative polymerization of dopamine·hydrochloride in a basic condition.28 Dopamine·hydrochloride (0.5 g) and sodium hydroxide (0.052 g) were dissolved in DI water (260 mL) and reacted at 50 °C for 5 h with stirring. Diameter of PDA nanoparticles was controlled by changing the concentration of sodium hydroxide. PS nanoparticles were synthesized by emulsion polymerization.29 Styrene (3 mL), N,N′-methylenebisacrylamide (0.022 g) and sodium n-dodecyl sulfate (0.059 g) were mixed together with DI water (100 mL). Each potassium persulfate solution (11 mM, 20 mL) and aqueous styrene solution was purged with nitrogen gas. After nitrogen gas purging, potassium persulfate solution was poured into the aqueous styrene solution with vigorous stirring and then, the reaction proceeded for 1 day at 75 °C. All nanoparticles were purified by consecutive centrifugations at least 3 times. SiO2 and PDA nanoparticles were centrifuged at 5000 RCF for 30 minutes, and PS nanoparticles were centrifuged at 14![[thin space (1/6-em)]](https://www.rsc.org/images/entities/char_2009.gif) 000 RCF for 1 h.
000 RCF for 1 h.
Fabrication and characterizations of dye-infiltrated PS nanoparticles
Sudan I and Sudan Blue II were infiltrated in PS nanoparticles by swelling/deswelling procedures.30 Hydrophobic Sudan I and Sudan Blue II can be infiltrated into the swollen PS nanoparticles with THF and entrapped as a solvent, which is gradually exchanged with water. For that, PS nanoparticles dispersed in water (0.5 wt%, 60 mL) were mixed with the dye solution (1 mM in THF, 10 mL) with stirring. After 30 min, ample amount of water was added to the solution. The resulting Sudan I and Sudan Blue II infiltrated PS nanoparticles (PSSD-I and PSSDB-II) and were isolated by multiple sequential centrifugations at 14000 RCF for 1 h and redispersion in DI-water. PSSD-I and PSSDB-II were stable in water, and there was no elution of dye. The amount of infiltrated dyes in PS nanoparticles was calculated based on the change of UV-Vis absorbance intensity between the dye-dissolved THF solution and supernatant of dye-infiltrated colloidal solution.
Fabrication of hyperuniform photonic solutions (HPSs) doped with complex index materials
HPSs were prepared by using SiO2 nanoparticles. SiO2 nanoparticles dispersed in water were concentrated to 45 wt% by consecutive centrifugations. Doping of HPS with the complex index materials was conducted by adding the synthesized PSSD-I, PSSDB-II or PDA nanoparticles to HPS. To minimize PBG shift by the additon of the dopants, highly concentrated PSSD-I, PSSDB-II and PDA nanoparticle solutions were added. The particle number density of each solution was calculated based on the weight percent of colloidal solution, diameter of nanoparticles and their density (dSiO2 = 1.58 g cm−3, dPS = 1.05 g cm−3 and dPDA = 1.52 g cm−3). A calculated amount of each dopant (PSSD-I, PSSDB-II and PDA nanoparticles) was added to HPS to obtain the desired dopant concentration (cd). In this case, the dopant concentration was defined as the number ratio of dopant particles to SiO2 nanoparticles: 
Results and discussion
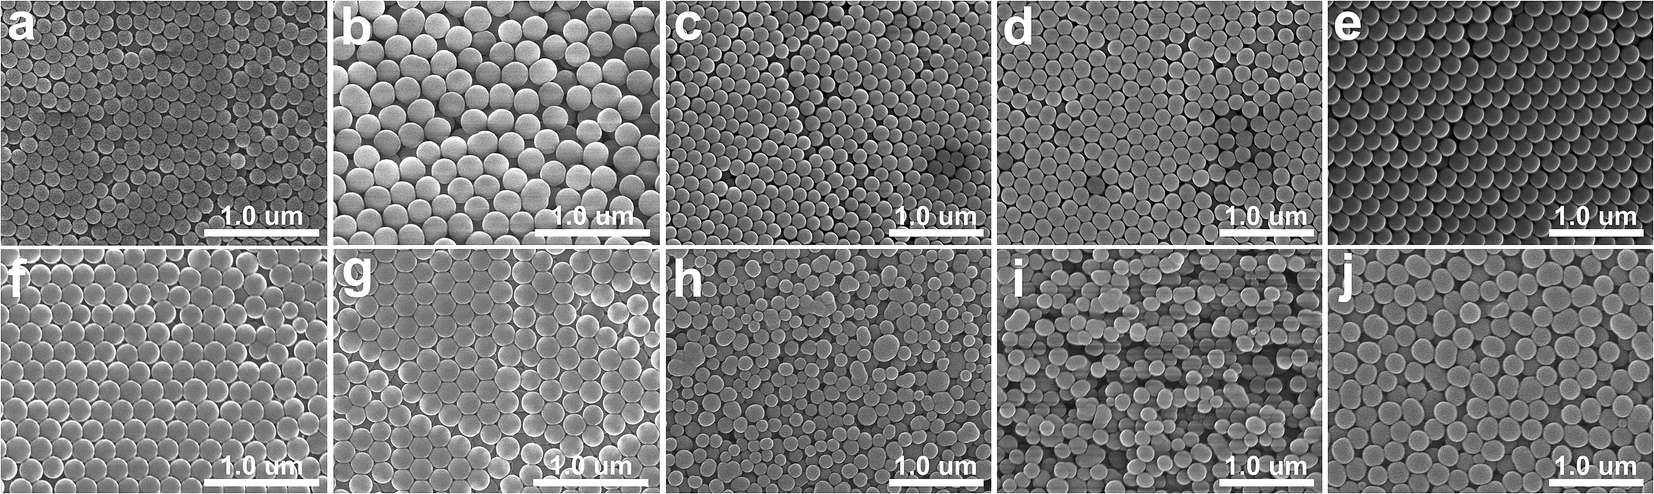
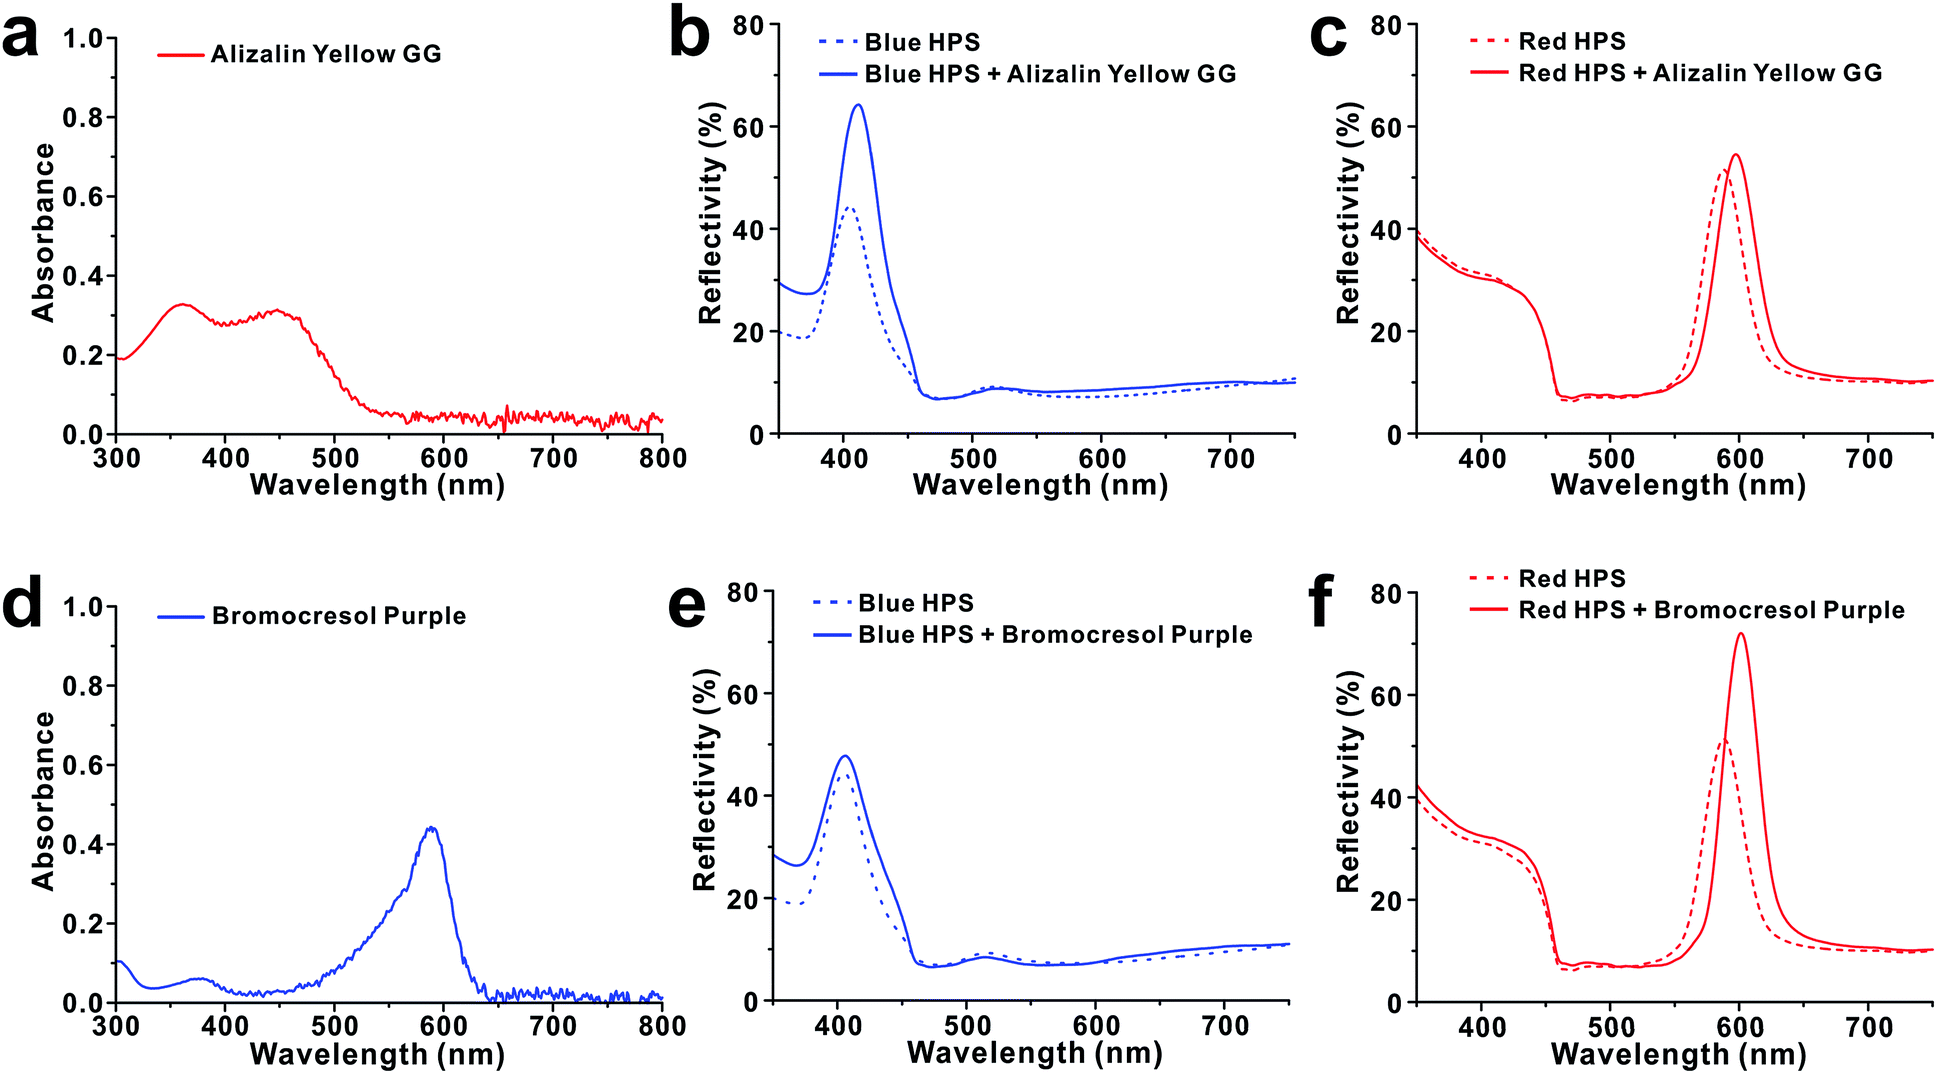
HPSs consisting of SiO2 nanoparticles were prepared by following our previously reported method with slight modifications.31 Briefly, SiO2 nanoparticles were first synthesized by the conventional Stöber process using TEOS (Fig. 1a–e).32 The prepared colloidal nanoparticle solutions were then concentrated by sequential centrifugations. When the concentration of SiO2 nanoparticles in water was increased to 30 wt%, the solution started to exhibit weak photonic colours. For our experiments, the concentration was controlled to 45 wt%. The resulting HPSs exhibited different photonic colours depending on the diameter of SiO2, i.e., from blue to red with increasing size from d = 141 ± 6 nm to 212 ± 6 nm. In this case, the photonic colours of HPSs were completely angle-independent as we previously reported, which suggests that there is only short-range order without crystal formation (Fig. S2†).31 To investigate the effects of doping with complex index materials, a small amount of polystyrene (PS) nanoparticles containing organic dyes was added to SiO2 HPSs. Dye-infiltrated PS nanoparticles were prepared by adding dyes (1 mM in THF) to swollen PS nanoparticles (d = 190 ± 10 nm) with THF.30 Sudan I and Sudan Blue II were chosen for our experiments. Once the dye was absorbed in PS nanoparticles, the solvent was exchanged with water. Sudan I- and Sudan Blue II-infiltrated PS nanoparticles (PSSD-I and PSSDB-II) were stable in water, and there was no elution of dye (Fig. 1f and g). The amount of infiltrated dye in PS nanoparticles was calculated based on the change in UV-Vis absorbance intensity (c = 35 mM in PS particles, Fig. S3†). In this report, the term dopant is defined as nanoparticles having the imaginary part of the refractive index that are added to HPSs made of pure dielectric particles. As shown in Fig. 2, the reflectivity of pure HPS was originally low (30–40%) before the addition of complex index dopants. However, the addition of a small amount of dopants, i.e., PSSD-I or PSSDB-II (cd = 0.1%) significantly changed the optical properties of HPSs. The reflectivity of HPSs increased 55% after the addition of complex index dopants, i.e., PSSD-I or PSSDB-II. Interestingly, there was a strong correlation between PBG of HPS and OBG of dopant. The reflectivity enhancement was observed only when the absorption bands of dyes matched with the reflection bands of HPSs. As shown in Fig. 2b, the reflectivity of blue HPS (λpeak = 400 nm) significantly increased after addition of PSSD-I, which showed absorption bands at λpeak = ∼400 nm. On the other hand, the reflectivity of red HPS (λpeak = 585 nm) was not affected by PSSD-I (Fig. 2c). The effects of dopant were completely opposite for PSSDB-II, which exhibited absorption bands at λpeak = ∼600 nm (Fig. 2d–f). The reflectivity of blue HPS was almost insensitive to the addition of PSSDB-II, and red HPS showed apparent reflectivity enhancement by the addition of PSSDB-II. No reflectivity enhancement was observed when pure PS nanoparticles were added to HPSs, which suggested that the reflectivity enhancement of HPS is mainly induced by the imaginary part of the refractive index of dopants (Fig. S4†). While polydispersity of particles affects reflectivity, it is not the case in our experiments. In general, reflectivity increases when polydispersity decreases. However, the added dopants were more polydispersed than original SiO2 HPSs (Fig. S1†). Furthermore, the concentration of dopant was very low due to which polydispersity and the refractive index contrast change in the real part by dopants must be almost negligible. For example, the real part of refractive index of PS changed from 1.630 to 1.640 (at λ = 400 nm) and from 1.595 to 1.598 (at λ = 600 nm), respectively, when 1 wt% of dopant was added to PS (Fig. S5†). Hence, these results strongly suggest that PBGs of HPSs resonate with OBGs of dopants. Such resonant behavior is not limited to a certain dye pair. The reflectivity enhancement was also observed for several different dyes and even when dyes were directly dissolved in the photonic solution without infiltration in PS nanoparticles (Fig. 3). For example, the reflectivity of blue HPS (λpeak = 407 nm) increased with the addition of Alizarin yellow GG (20 μM), which showed absorption bands at λpeak = ∼400 nm, whereas no enhancement was observed for red HPS (λpeak = 585 nm) (Fig. 3a–c). Similarly, for Bromocresol purple exhibiting absorption bands at λpeak = ∼600 nm, the reflectivity of red HPS increased with the addition of 5 μM of Bromocresol purple (Fig. 3d–f). Blue HPS was almost insensitive to the addition of Bromocresol purple because its PBG and OBG did not match. Resonance of PBGs with OBGs has been previously observed by Zhou and coworkers;18,19 they reported that light was diffracted only near the absorption center of the dye incorporated in the photonic crystals. Similarly, strong interference effects in highly absorbing media were utilized for anti-reflection coatings.33,34 Because the real and imaginary parts of the refractive index are related to the Kramers–Kronig relations,35 casuality suggests that the introduction of complex index materials in the dielectric photonic structures is expected to affect the photonic band structures. Since there is no contrast in the imaginary part of index for the wavelength away from the absorption region, the reflection enhancement by complex index dopants occurs near the absorption peak. For HPSs doped with complex index materials, the refractive index contrast in both real part and imaginary part index contrast contributes to increased reflectivity.
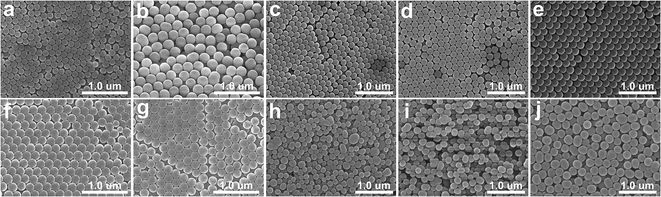 |
| | Fig. 1 (a–e) SEM micrographs of SiO2 nanoparticles used for HPSs. The average diameters of nanoparticles are (a) dSiOz = 141 ± 6 nm, (b) 212 ± 6 nm, (c) 159 ± 9 nm, (d) 174 ± 10 nm and (e) 199 ± 9 nm. SEM micrographs of PS nanoparticles used as dopants, (f) PSSD-I (d = 190 ± 10 nm) and (g) PSSDB-II (d = 190 ± 10 nm). (h–j) SEM micrographs of PDA nanoparticles used as dopants. Their average diameters are (h) dPDA = 155 ± 30 nm, (i) 172 ± 16 nm and (j) 220 ± 14 nm. Histograms and polydispersities for particles are shown in Fig. S1.† | |
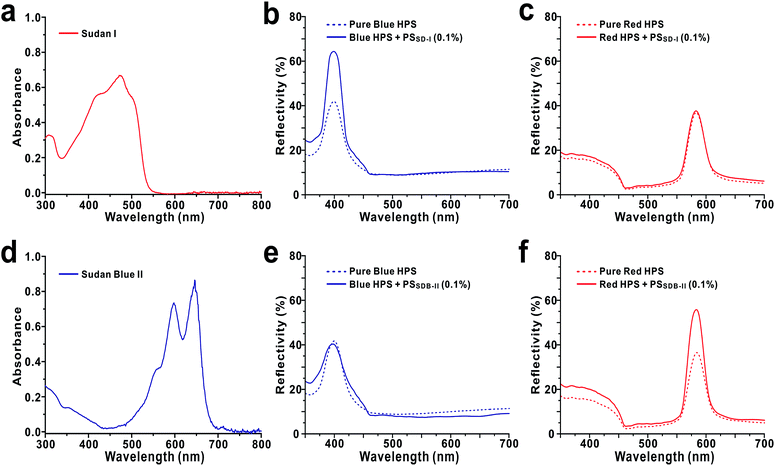 |
| | Fig. 2 Absorbance spectra of (a) Sudan I (c = 0.05 mM) and (d) Sudan Blue II (c = 0.05 mM). Reflectivity changes of the blue HPSs (λpeak = 400 nm) with the addition of (b) PSSD-I and (e) PSSDB-II. Reflectivity changes of the red HPSs (λpeak = 585 nm) with the addition of (c) PSSD-I and (f) PSSDB-II. | |
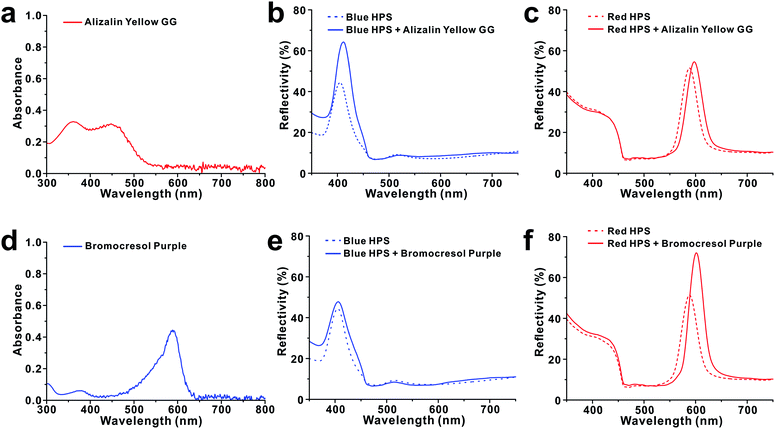 |
| | Fig. 3 Direct addition of complex index materials in SiO2 HPSs. Each dye, Alizarin yellow (c = 2 × 10⁻⁵ M) and Bromocresol purple (c = 5 × 10⁻⁶ M), was dissolved in HPSs without infiltration in PS nanoparticles. Absorption spectra of (a) Alizarin yellow and (d) Bromocresol purple. Reflectivity changes of (b) the blue and (c) the red HPSs with addition of Alizarin yellow. Reflectivity changes of (e) the blue and (f) the red HPSs with addition of Bromocresol purple. Similar to the case of adding dye-infiltrated PS nanoparticles, the reflectivity enhancement was observed only when PBG of blue (λpeak = 407 nm) and red HPS (λpeak = 590 nm) matched with OBG of Alizarin yellow (λpeak = 360, 450 nm) and Bromocresol purple (λpeak = 585 nm), respectively. | |
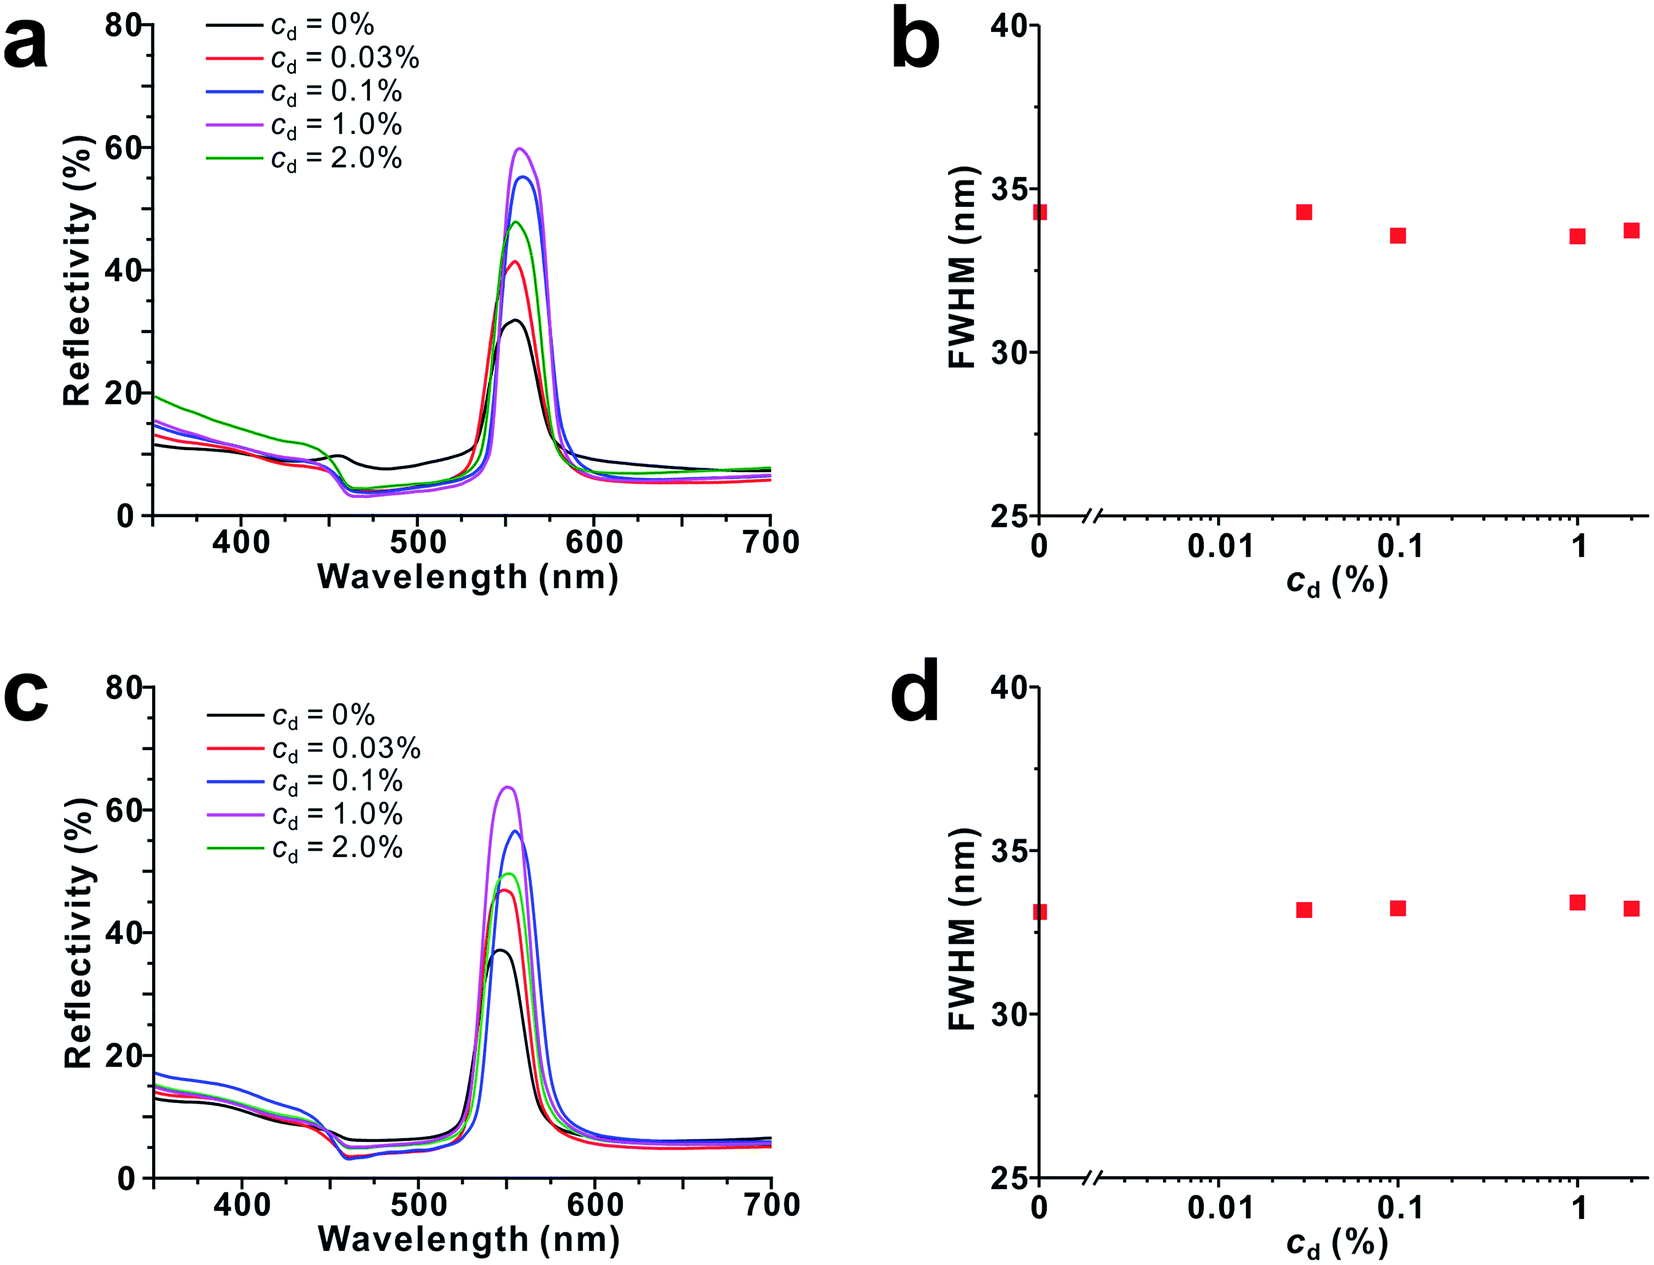
In the aspect of resonant interference, black materials are more advantageous than colored dyes since they have strong absorption in the whole visible wavelength regions. When black materials are used as dopants, PBGs can match with OBGs of dopants at all visible wavelength regions. For this purpose, we used melanine-like polydopamine (PDA) nanoparticles as black dopant materials, which show a monotonic broad absorption band in UV and visible regions (Fig. S6†). The complex refractive index of PDA film was determined by spectroscopic ellipsometry (Fig. S5†). The size of PDA nanoparticles matched with that of each corresponding HPS: for blue HPS, dSiO2 = 159 ± 9 nm/dPDA = 155 ± 30 nm; for green HPS, dSiO2 = 174 ± 10 nm/dPDA = 172 ± 16 nm; for red HPS, dSiO2 = 199 ± 9 nm/dPDA = 220 ± 14 nm (Fig. 1c–e and h–j). On addition of a small amount of PDA nanoparticles to HPSs, the reflectivity increased at all wavelength regions. To observe the effects of dopant concentration (cd), PDA nanoparticle concentration was varied from 0% to 2.0%. As shown in Fig. 4, the reflectivity of blue, green and red HPSs increased logarithmically with an increase in the PDA nanoparticle concentration. The reflectivity enhancement factor was ∼100% at cd = 1.0%. However, the reflectivity decreased when the dopant concentration was very high (cd > 1.0%). The decrease in reflectivity at high dopant concentration was ascribed to the increase in absorption by PDA. These results suggest that PBG/OBG resonant enhancement is quite effective even at low dopant concentrations. This reflectivity enhancement is very similar to the phenomenon observed in some biological systems. For example, melanosomes in pigmented skin generate high brightness over other cellular components compared with that in unpigmented skin.36
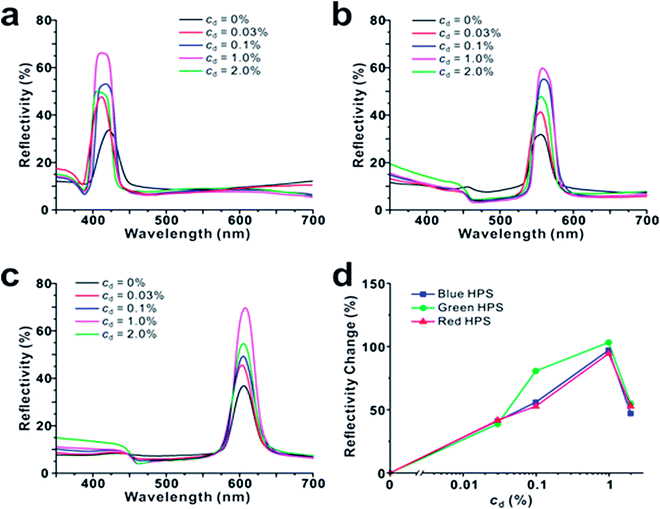 |
| | Fig. 4 (a–d) Reflectivity changes of (a) blue (dSiO2 = 159 ± 9 nm), (b) green (dSiO2 = 174 ± 10 nm) and (c) red HPSs (dSiO2 = 199 ± 9 nm) with the increase of the PDA nanoparticle concentration (0 ≤ cd ≤ 2.0). The reflectivity increased logarithmically as a function of the dopant concentration with showing a maximum at cd = 1.0%. | |
The reflectivity of HPSs can be affected by their structural changes induced by polydispersity change of HPS or by crystallization. Generally, it is expected that more ordered photonic structures show higher reflectivity.37 To test whether the addition of PDA nanoparticles affects crystallinity of HPSs, the changes in FWHM (full width at half maximum) were measured for green HPS at different PDA concentrations. As shown in Fig. 5, FWHM values were almost constant at all PDA concentrations. Even when size-mismatched PDA nanoparticles (dPDA = 106 ± 8 nm) were added to HPS (dSiO2 = 174 ± 10 nm) (Fig. 5c and d), FWHM values did not change. This result indicates that the addition of PDA nanoparticles at the dopant level does not affect the structure of HPS; thus, reflectivity enhancement was considered to be mainly due to resonant interference effects of PBGs and OBGs.
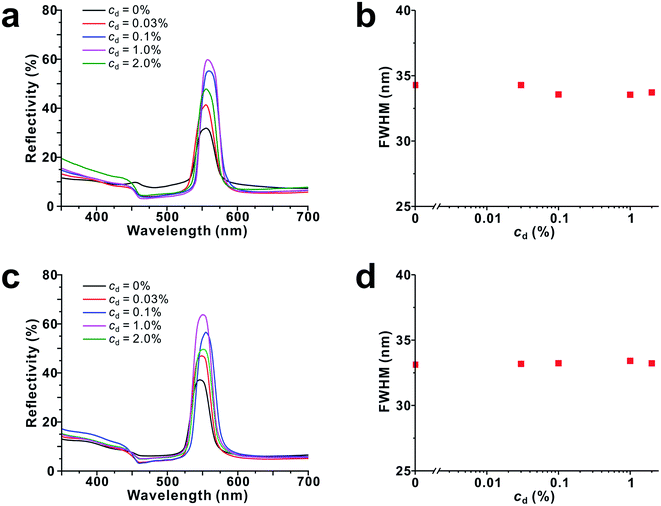 |
| | Fig. 5 (a and c) Reflectivity changes and (b and d) FWHM changes in green HPSs (dSiO2 = 174 ± 10 nm) with the addition of (a and b) size-matching (dPDA = 172 ± 16 nm) and (c and d) size-mismatching PDA nanoparticles (dPDA = 106 ± 8 nm). | |
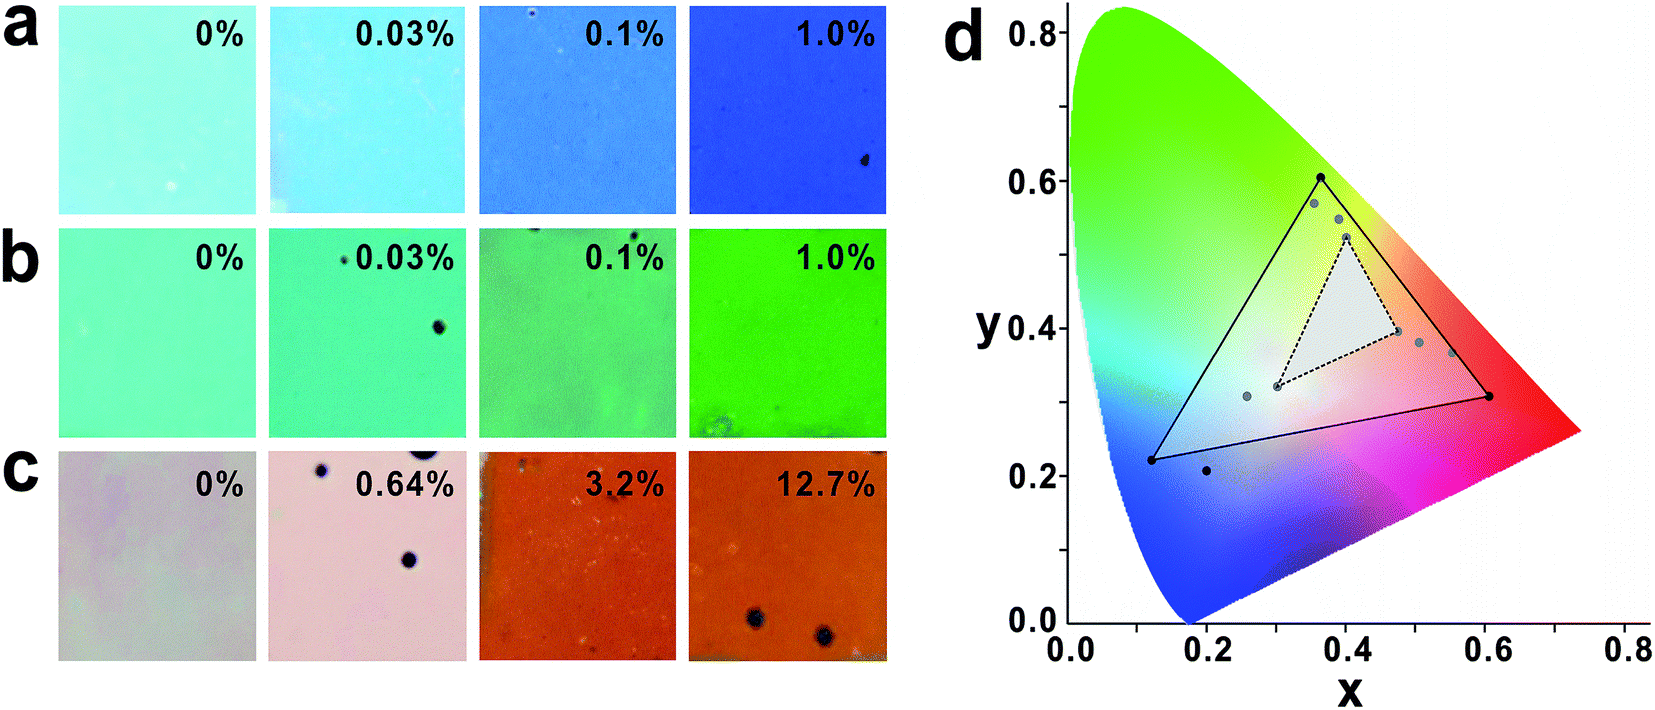
Doping HPS with black PDA nanoparticles is beneficial not only for enhancing reflectivity but also for improving the colour saturation and the colour expression range (Fig. 6). Since PDA nanoparticles attenuate background scattering other than the PBG/OBG resonant region and the PBG/OBG resonant peak is augmented, the colour contrast of HPS can be strengthened by doping with PDA nanoparticles.38,39 HPSs made of pure SiO2 nanoparticles originally showed faint photonic colours (Fig. 6). However, the photonic colours were gradually saturated and became vivid with increasing concentration of PDA nanoparticles. Compared with blue and green HPSs, red HPS required higher PDA concentration to exhibit vivid photonic colours, which is believed to be because of the relatively low absorption coefficient at the red band region (Fig. S6†). Because of the improved colour saturation, the colour expression range of HPS increased by almost 600% after doping with PDA nanoparticles.
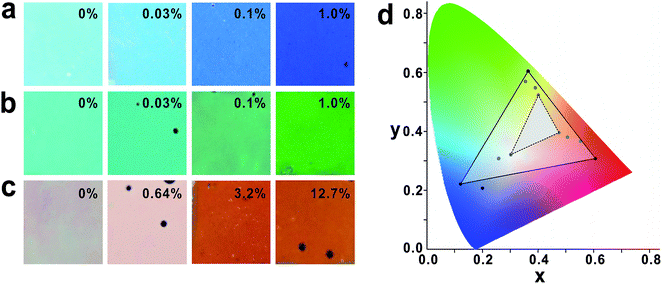 |
| | Fig. 6 Photographs of (a) blue, (b) green and (c) red HPSs showing colour saturation enhancement by the addition of complex index dopants, PDA nanoparticles. Colour saturation. (d) Colour coordinates of each HPS are depicted on a CIE graph. Colour expression range of PDA dopped HPSs is enhanced by almost 600% compared to that of the undopped HPSs. | |
Conclusions
In summary, we have demonstrated the reflectivity enhancement of HPSs made of SiO2 nanoparticles by doping with complex index materials. HPSs containing a small amount of light-absorbing dopants (cd ≤ 1%) exhibited large reflectivity enhancement (∼100%) when PBGs of HPSs matched with OBGs of dopants. Furthermore, the colour expression range of HPS also increased significantly (∼600%) by doping with complex index materials. Considering the restricted kind of dielectric materials having high refractive index, doping with a small amount of complex refractive index materials allows us to fabricate practical photonic structures very easily without the trouble of synthesizing new materials. Moreover, resonant interference of PBGs with OBGs in the complex refractive index media may give a clue for understanding why nature frequently utilizes complex index materials rather than pure dielectrics to fabricate biological optical components.
Conflicts of interest
There are no conflicts to declare.
Acknowledgements
This work was supported by Basic Science Research Program through the National Research Foundation of Korea (NRF) funded by the Ministry of Education (2017R1A2B2007618, 2012R1A6A1029029, 2018K1A3A1A32053991, 2017K2A9A1A06037779).
Notes and references
- S. Yoshioka and S. Kinoshita, Proc. Biol. Sci., 2006, 273, 129–134 CrossRef PubMed.
- R. L. Rutowski, J. M. Macedonia, N. Morehouse and L. Taylor-Taft, Proc. Biol. Sci., 2005, 272, 2329–2335 CrossRef CAS PubMed.
- M. D. Shawkey and G. E. Hill, Biol. Lett., 2005, 1, 121–124 CrossRef CAS PubMed.
- N. I. Morehouse, P. Vukusic and R. Rutowski, Proc. Biol. Sci., 2007, 274, 359–366 CrossRef CAS PubMed.
- D. G. Stavenga, H. L. Leertouwer, T. Hariyama, H. A. De Raedt and B. D. Wilts, PLoS One, 2012, 7, e49743 CrossRef CAS PubMed.
- R. O. Prum and R. H. Torres, J. Exp. Biol., 2004, 207, 2157–2172 CrossRef PubMed.
- P. Vukusic and J. R. Sambles, Nature, 2003, 424, 852–855 CrossRef CAS PubMed.
- J. W. Galusha, L. R. Richey, J. S. Gardner, J. N. Cha and M. H. Bartl, Phys. Rev. E, 2008, 77, 050904 CrossRef PubMed.
- R. O. Prum and R. Torres, J. Exp. Biol., 2003, 206, 2409–2429 CrossRef PubMed.
- M. D. Shawkey and G. E. Hill, J. Exp. Biol., 2006, 209, 1245–1250 CrossRef CAS PubMed.
- E. Kreit, L. M. Mäthger, R. T. Hanlon, P. B. Dennis, R. R. Naik, E. Forsythe and J. Heikenfeld, J. R. Soc., Interface, 2013, 10, 20120601 CrossRef PubMed.
- J. Zi, X. Yu, Y. Li, X. Hu, C. Xu, X. Wang, X. Liu and R. Fu, Proc. Natl. Acad. Sci. U. S. A., 2003, 100, 12576–12578 CrossRef CAS PubMed.
- K. Lee and S. A. Asher, J. Am. Ceram. Soc., 2000, 122, 9534–9537 CAS.
- S. Fan, P. R. Villeneuve, J. Joannopoulos and E. Schubert, Phys. Rev. Lett., 1997, 78, 3294–3297 CrossRef.
- A. C. Arsenault, D. P. Puzzo, I. Manners and G. A. Ozin, Nat. Photonics, 2007, 1, 468–472 CrossRef CAS.
- J. Philip, C. Rao, T. Jayakumar and B. Raj, NDT&E Int., 2000, 33, 289–295 CrossRef.
- A. Zaibudeen and J. Philip, Sens. Actuators, B, 2018, 255, 720–728 CrossRef CAS.
- J. Li, B. Liang, Y. Liu, P. Zhang, J. Zhou, S. O. Klimonsky, A. S. Slesarev, Y. D. Tretyakov, L. O'Faolain and T. F. Krauss, Adv. Mater., 2010, 22, 2676–2679 CrossRef CAS PubMed.
- Y. Liu, H. Dai, E. S. Leong, J. H. Teng and X. Sun, Opt. Mater. Express, 2012, 2, 55–61 CrossRef CAS.
- P. N. Pusey, E. Zaccarelli, C. Valeriani, E. Sanz, W. C. Poon and M. E. Cates, Philos. Trans. R. Soc., A, 2009, 367, 4993–5011 CrossRef CAS PubMed.
- J. D. Forster, H. Noh, S. F. Liew, V. Saranathan, C. F. Schreck, L. Yang, J. G. Park, R. O. Prum, S. G. Mochrie and C. S. O'Hern, Adv. Mater., 2010, 22, 2939–2944 CrossRef CAS PubMed.
- P. D. García, R. Sapienza and C. López, Adv. Mater., 2010, 22, 12–19 CrossRef PubMed.
- C. I. Aguirre, E. Reguera and A. Stein, ACS Appl. Mater. Interfaces, 2010, 2, 3257–3262 CrossRef CAS PubMed.
- J. Hyon, C. Seo, I. Yoo, S. Song and Y. Kang, Sens. Actuators, B, 2016, 223, 878–883 CrossRef CAS.
- I. Lee, D. Kim, J. Kal, H. Baek, D. Kwak, D. Go, E. Kim, C. Kang, J. Chung and Y. Jang, Adv. Mater., 2010, 22, 4973–4977 CrossRef CAS PubMed.
- J. Hou, C. Yang, X. Li, Z. Cao and S. Chen, Photonics Res., 2018, 6, 282–289 CrossRef.
- W. Stöber, A. Fink and E. Bohn, J. Colloid Interface Sci., 1968, 26, 62–69 CrossRef.
- S. Cho and S.-H. Kim, J. Colloid Interface Sci., 2015, 458, 87–93 CrossRef CAS PubMed.
- M. Egen and R. Zentel, Chem. Mater., 2002, 14, 2176–2183 CrossRef CAS.
- T. Behnke, C. Würth, K. Hoffmann, M. Hübner, U. Panne and U. Resch-Genger, J. Fluoresc., 2011, 21, 937–944 CrossRef CAS PubMed.
- J. Hyon, C. Seo, J. Nam, T. Kwon, J. Kim, J. Chung and Y. Kang, Sci. Adv. Mater., 2015, 7, 881–885 CrossRef CAS.
- V. Masalov, N. Sukhinina, E. Kudrenko and G. Emelchenko, Nanotechnology, 2011, 22, 275718 CrossRef CAS PubMed.
- M. A. Kats, R. Blanchard, P. Genevet and F. Capasso, Nat. Mater., 2013, 12, 20–24 CrossRef CAS PubMed.
- H. Liu, J. Peng, W. Liu, Y. Wang, J. Wu, G. Zhang, X. Wang and Y. Yan, NPG Asia Mater., 2018, 10, 309–317 CrossRef CAS.
- J. D. Jackson, Classical Electrodynamics, Magnetostatics, Faraday's Law, Quasi-Static Fields, John Wiley & Sons, 1999 Search PubMed.
- M. Rajadhyaksha, M. Grossman, D. Esterowitz, R. H. Webb and R. R. Anderson, J. Invest. Dermatol., 1995, 104, 946–952 CrossRef CAS PubMed.
- Q. Fu, A. Chen, L. Shi and J. Ge, Chem. Commun., 2015, 51, 7382–7385 RSC.
- Y. Takeoka, S. Yoshioka, M. Teshima, A. Takano, M. Harun-Ur-Rashid and T. Seki, Sci. Rep., 2013, 3, 2371 CrossRef PubMed.
- M. Iwata, M. Teshima, T. Seki, S. Yoshioka and Y. Takeoka, Adv. Mater., 2017, 29, 1605050 CrossRef PubMed.
Footnote |
| † Electronic supplementary information (ESI) available. See DOI: 10.1039/c8ra07363e |
|
| This journal is © The Royal Society of Chemistry 2018 |
Click here to see how this site uses Cookies. View our privacy policy here. 
 Open Access Article
 This Open Access Article is licensed under a Creative Commons Attribution-Non Commercial 3.0 Unported Licence
 *ac
*ac