 Open Access Article
Theoretical and experimental investigation of anticancer activities of an acyclic and symmetrical compartmental Schiff base ligand and its Co(II), Cu(II) and Zn(II) complexes†
Lotfali Saghatforoush *a,
Keyvan Moeini
 a,
Seyed Abolfazl Hosseini-Yazdib,
Zahra Mardani
 c,
Alireza Hajabbas-Farshchi
 d,
Heather T. Jamesone,
Shane G. Telfer
 e and
J. Derek Woollinsf
aDepartment of Chemistry, Payame Noor University, 19395-4697 Tehran, I. R. Iran. E-mail: saghatforoush@gmail.com; l_saghatf@pnu.ac.ir; Fax: +98 4436332556; Tel: +98 4436332344
bDepartment of Inorganic Chemistry, Faculty of Chemistry, University of Tabriz, Tabriz 51666-14766, I. R. Iran
cInorganic Chemistry Department, Faculty of Chemistry, Urmia University, 57561-51818, Urmia, I. R. Iran
dDepartment of Immunology, Faculty of Microbiology, Urmia University, 57561-51818, Urmia, I. R. Iran
eMacDiarmid Institute for Advanced Materials and Nanotechnology, Massey University, Palmerston North, New Zealand
fEaStCHEM School of Chemistry, University of St Andrews, St Andrews, Fife, UK KY16 9ST
First published on 17th October 2018
Abstract
A compartmental Schiff base ligand, 2,2′-((((((2-hydroxypropane-1,3-diyl)bis(oxy))bis(2,1-phenylene))bis(methylene))bis(azanylylidene))bis(methanylylidene))bis(4-bromophenol) (H3LBr) and its complexes with cobalt(II), copper(II) and zinc(II) including, [Co(HLBr)] (1), [Cu2(LBr)(μ-1,3-OAc)]·MeOH (2) and [Zn(HLBr)] (3) were prepared using template synthesis and characterised by elemental analysis, FT-IR and 1H NMR spectroscopies and single-crystal X-ray diffraction. In the structure of complexes 1 and 3 the metal atom has a MN2O2 environment with tetrahedral geometry while complex 2 has a binuclear structure with a MNO4 environment and square planar geometry around the copper atom. The ability of all compounds to interact with the nine biomacromolecules (BRAF kinase, CatB, DNA gyrase, HDAC7, rHA, RNR, TrxR, TS and Top II) are investigated by docking calculations. For examination of the docking results, the in vitro activities of eight compounds against the human leukemia cell line K562 was investigated by evaluation of IC50 values and mode of cell death (apoptosis).
1. Introduction
Schiff base compounds attract considerable interest due to their wide range of applications including as catalysts,1–3 photovoltaic materials,4 chemosensors,5,6 anti-corrosion agents7 and OLED materials.8 Schiff base ligands and their complexes show interesting pharmacological effects such as antimicrobial,9 antitumor,10,11 antibacterial,12 antifungal,12 antioxidative,13 and urease inhibitory14,15 activities. The cleavage of plasmid DNA by Schiff base complexes has been well-reported.16,17Compartmental Schiff bases, obtained by the condensation of salicylaldehyde or salicylaldehyde derivatives with diamines, have two cavities of different dimensions.18–22 Thus, these types of ligands can bind with one or two metal centers, enabling the successful synthesis of homo- and/or heteronuclear metal complexes with interesting stereochemistry.20,23–25 Complexes derived from compartmental ligands have been widely studied over the last decades especially due to their applications as models of different metalloproteins.26–29
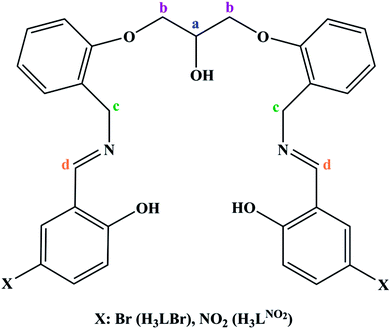
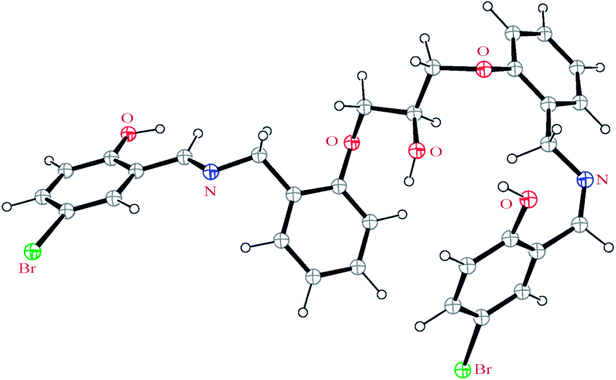
In order to extend the chemistry of the compartmental Schiff base compounds, in this work, the synthesis of a new ligand, 2,2′-((((((2-hydroxypropane-1,3-diyl)bis(oxy))bis(2,1-phenylene))bis(methylene))bis(azanylylidene))bis(methanylylidene))bis(4-bromophenol) (H3LBr, Scheme 1) and its complexes with cobalt(II), copper(II) and zinc(II), [Co(HLBr)] (1), [Cu2(LBr)(μ-1,3-OAc)]·MeOH (2), [Zn(HLBr)] (3) are described, along with the characterization and theoretical studies.
In addition to the expected biological properties of the Schiff base compounds,30–35 binding the cobalt, copper and zinc atoms to this unit make these complexes a good prospect for biologically active compounds36–50 (31–35 for zinc, 36–40 for cobalt, 41–45 for copper). For the study of the biological activities of new ligand (H3LBr) and its complexes 1–3, docking calculations were run to investigate the possibility of interaction between these compounds with nine protein targets, including: BRAF kinase, cathepsin B (CatB), DNA gyrase, histone deacetylase (HDAC7), recombinant human albumin (rHA), ribonucleotide reductases (RNR), thioredoxin reductase (TrxR), thymidylate synthase (TS), topoisomerase II (Top II).51,52 These proteins were used in this project either due to their reported roles in the cancer growth or as transport agents that affect drug pharmacokinetic properties (e.g., rHA). Also, DNA gyrase was included to study the possibility of anticancer properties of the compounds also acting as antimalarial agents.53 Experimental investigations on the anticancer potential of all titled compounds, mode of cell death and apoptosis on the K562 cell lines were performed. The K562 cell line is a pluripotent precursor cell that is positive for the Philadelphia (Ph) chromosome and was originally derived from a patient with human chronic myelogenous leukemia (CML) at the terminal stage of last crisis; this cell line is non-adherent and rounded, highly undifferentiated with an active proliferative capacity and the inhibition of apoptosis.54
2. Experimental
2.1 Materials and instrumentation
All starting chemicals and solvents were reagent or analytical grade and used as received. The infrared spectra of KBr pellets in the range 4000–400 cm−1 were recorded with a FT-IR Shimadzu-IRprestige-21 spectrometer. The 1H NMR spectra were recorded on Bruker Avance 400 instrument; chemical shifts δ are given in parts per million, relative to TMS as an internal standard. The carbon, hydrogen and nitrogen contents were determined in a Perkin-Elmer 2400 elemental analyzer. The melting points were determined with an Electrothermal 9100 electrically heated apparatus.![[double bond, length as m-dash]](https://www.rsc.org/images/entities/char_e001.gif) N), 1478 s and 1601 m (ν C
N), 1478 s and 1601 m (ν C![[double bond, length as m-dash]](https://www.rsc.org/images/entities/char_e001.gif) Car), 1451 m (δas CH2), 1370 m (δs CH2), 1250 s (νas C–O–C)Ether, 1119 m (νs C–O–C)Ether, 1038 s (ν C–N). 1H NMR (400 MHz, CDCl3, ppm, Hz): δ = 9.8 (s, 2H, OHPhenol), 8.3 s, 2H, CdH, 6.6–7.6 m, 14H, CHar, 4.9 s, 1H, OHAlcohol, 4.8 s, 4H, CcH, 4.5 m, 1H, CaH, 4.2 d, 4H, CbH.
Car), 1451 m (δas CH2), 1370 m (δs CH2), 1250 s (νas C–O–C)Ether, 1119 m (νs C–O–C)Ether, 1038 s (ν C–N). 1H NMR (400 MHz, CDCl3, ppm, Hz): δ = 9.8 (s, 2H, OHPhenol), 8.3 s, 2H, CdH, 6.6–7.6 m, 14H, CHar, 4.9 s, 1H, OHAlcohol, 4.8 s, 4H, CcH, 4.5 m, 1H, CaH, 4.2 d, 4H, CbH.![[double bond, length as m-dash]](https://www.rsc.org/images/entities/char_e001.gif) N), 1478 s and 1520 m (ν C
N), 1478 s and 1520 m (ν C![[double bond, length as m-dash]](https://www.rsc.org/images/entities/char_e001.gif) Car), 1419 m (δas CH2), 1370 m (δs CH2), 1249 m (νas C–O–C)Ether, 1120 m (νs C–O–C)Ether, 1037 m (ν C–N).
Car), 1419 m (δas CH2), 1370 m (δs CH2), 1249 m (νas C–O–C)Ether, 1120 m (νs C–O–C)Ether, 1037 m (ν C–N).![[double bond, length as m-dash]](https://www.rsc.org/images/entities/char_e001.gif) N), 1493 m and 1562 m (ν C
N), 1493 m and 1562 m (ν C![[double bond, length as m-dash]](https://www.rsc.org/images/entities/char_e001.gif) Car), 1454 s (δas CH2), 1389 m (δs CH2), 1319 m (νs COO), 1242 m (νas C–O–C)Ether, 1119 m (νs C–O–C)Ether, 1026 m (ν C–N), 646 m (δ OCO).
Car), 1454 s (δas CH2), 1389 m (δs CH2), 1319 m (νs COO), 1242 m (νas C–O–C)Ether, 1119 m (νs C–O–C)Ether, 1026 m (ν C–N), 646 m (δ OCO).![[double bond, length as m-dash]](https://www.rsc.org/images/entities/char_e001.gif) N), 1496 m and 1520 m (ν C
N), 1496 m and 1520 m (ν C![[double bond, length as m-dash]](https://www.rsc.org/images/entities/char_e001.gif) Car), 1458 s (δas CH2), 1389 m (δs CH2), 1250 m (νas C–O–C)Ether, 1119 w (νs C–O–C)Ether, 1034 m (ν C–N). 1H NMR (400 MHz, DMSO-d6, ppm, Hz): δ = 8.3 s, 2H, CdH, 6.3–7.4 m, 14H, CHar, 4.8 s, 1H, OHAlcohol, 4.5 m, 1H, CaH, 4.2 d, 4H, CbH, 4.1 s, 4H, CcH.
Car), 1458 s (δas CH2), 1389 m (δs CH2), 1250 m (νas C–O–C)Ether, 1119 w (νs C–O–C)Ether, 1034 m (ν C–N). 1H NMR (400 MHz, DMSO-d6, ppm, Hz): δ = 8.3 s, 2H, CdH, 6.3–7.4 m, 14H, CHar, 4.8 s, 1H, OHAlcohol, 4.5 m, 1H, CaH, 4.2 d, 4H, CbH, 4.1 s, 4H, CcH.2.2 Crystal structure determination
Crystals were mounted on a glass fibre using perfluoropolyether oil and the sample cooled to the required temperature in a stream of cold nitrogen. The diffraction data of complexes 1–3 were collected on a Rigaku Spider diffractometer equipped with a MicroMax MM007 rotating anode generator, Cuα radiation (λ = 1.54178 Å), high-flux Osmic multilayer mirror optics, and a curved image-plate detector. The data were integrated, scaled and averaged with FS Process. In the case of complexes 4–6, data were collected on a Bruker Kappa diffractometer with graphite monochromated Mo-Kα (λ = 0.71073 Å). After data collection, in each case an empirical absorption correction was applied. The structures were then solved by direct methods and refined on all F2. In all cases non-hydrogen atoms were refined with anisotropic thermal parameters; hydrogen atoms were included in calculated positions and refined with isotropic thermal parameters which were ca. 1.2× (aromatic CH) or 1.5× (Me, CH2, OH) the equivalent isotropic thermal parameters of their parent carbon atoms. The data were corrected for Lorentz and polarization effects. The programs used in this work are Bruker Saint Plus, including X-RED and X-Shape for data reduction and absorption correction, and the SHELX and OLEX program suites.56 Diagrams of the molecular structure and unit cell were created using Ortep-III57,58 and Diamond59 software. Details of crystal data, data collection, structure solutions and refinements are given in Table 1. Selected bond lengths and angles of complexes are listed in Table 2 and hydrogen bond geometries in Table 3.| Complex 1 | Complex 2 | Complex 3 | |
|---|---|---|---|
| Empirical formula | C31H26Br2CoN2O5 | C31H25Br2Cu2N2O5 | C31H26Br2N2O5Zn |
| Formula weight, g mol−1 | 725.29 | 792.43 | 731.73 |
| Crystal size, mm3 | 0.27 × 0.10 × 0.06 | 0.69 × 0.37 × 0.08 | 0.22 × 0.10 × 0.07 |
| Temperature, K | 173 | 436 | 163 |
| Crystal system | Triclinic | Monoclinic | Triclinic |
| Space group | P![[1 with combining macron]](https://www.rsc.org/images/entities/char_0031_0304.gif) |
P21/n | P![[1 with combining macron]](https://www.rsc.org/images/entities/char_0031_0304.gif) |
| Unit cell dimensions (Å, °) | |||
| A | 7.1465(5) | 14.8266(10) | 7.1537(6) |
| B | 8.5993(6) | 12.0316(9) | 8.5883(6) |
| C | 24.5966(17) | 18.820(3) | 24.6179(17) |
| A | 93.136(7) | 90.000 | 92.958(7) |
| B | 96.008(7) | 96.213(7) | 96.172(7) |
| Γ | 106.846(7) | 90.000 | 106.824(7) |
| Volume, Å3 | 1433.01(18) | 3337.6(6) | 1433.90(19) |
| Z | 2 | 4 | 2 |
| Calculated density, g cm−3 | 1.681 | 1.577 | 1.695 |
| Absorption coefficient, mm−1 | 8.33 | 4.70 | 4.82 |
| F(000), e | 726 | 1572 | 732 |
| θ range for data collection (°) | 6.5–72.1 | 6.9–72.0 | 6.5–72.0 |
| h, k, l ranges | −8 ≤ h ≤ 8, −10 ≤ k ≤ 9, −29 ≤ l ≤ 30 | −18 ≤ h ≤ 14, −14 ≤ k ≤ 14, −18 ≤ l ≤ 22 | −8 ≤ h ≤ 5, −10 ≤ k ≤ 10, −30 ≤ l ≤ 30 |
| Reflections collected/independent/Rint | 19872/5360/0.081 | 27771/6330/0.081 | 18870/5287/0.076 |
| Data/ref. parameters | 5360/371 | 6330/436 | 5287/371 |
| Goodness-of-fit on F2 | 1.15 | 1.11 | 1.09 |
| Final R indexes [I > = 2σ (I)] | R1 = 0.081, wR2 = 0.204 | R1 = 0.075, wR2 = 0.197 | R1 = 0.085, wR2 = 0.213 |
| Final R indexes [all data] | R1 = 0.104, wR2 = 0.241 | R1 = 0.093, wR2 = 0.231 | R1 = 0.125, wR2 = 0.265 |
| Largest diff. peak/hole, e Å−3 | 0.63/−1.09 | 1.33/−1.70 | 0.73/−1.00 |
| 1 | 2 | 3 | ||||
|---|---|---|---|---|---|---|
| Distances | Co1–N1 | 1.984(6) | Cu1–N2 | 1.957(6) | Zn1–N1 | 1.994(6) |
| Co1–N2 | 1.986(7) | Cu1–O1 | 2.510(6) | Zn1–N2 | 2.006(7) | |
| Co1–O4 | 1.916(4) | Cu1–O3 | 1.937(5) | Zn1–O4 | 1.937(4) | |
| Co1–O5 | 1.917(5) | Cu1–O5 | 1.912(5) | Zn1–O5 | 1.920(5) | |
| Cu1–O202 | 2.000(5) | |||||
| Cu2–O3 | 1.923(5) | |||||
| Cu1–Cu2 | 3.155(1) | |||||
| Cu2– O201 | 2.052(5) | |||||
| Angles | O5–Co1–N1 | 113.1(2) | O5–Cu1–N2 | 91.6(2) | N1–Zn1–N2 | 124.0(2) |
| O5–Co1–N2 | 96.0(2) | O5–Cu1–O1 | 116.3(2) | N1–Zn1–O4 | 94.0(2) | |
| O5–Co1–O4 | 112.9(2) | O5–Cu1–O202 | 151.9(2) | N1–Zn1–O5 | 114.0(2) | |
| C4–C3–C28 | 123.8(7) | O5–Cu1–O3 | 91.1(2) | N2–Zn1–O5 | 97.4(2) | |
| C10–C11–C26 | 123.3(6) | Cu1–O3–Cu2 | 109.6(2) | O4–Zn1–O5 | 111.4(2) | |
| O201–C200–O202 | 125.9(7) | |||||
| D–H⋯A | d(D–H) | d(H⋯A) | <(DHA) | d(D⋯A) | Symmetry code on A atom | |
|---|---|---|---|---|---|---|
| 1 | C(26)–H(26)⋯O(3) | 0.950 | 2.493 | 147.4 | 3.332(9) | −1 + x, y, z |
| O(3)–H(3)⋯O(4) | 0.840 | 1.914 | 150.9 | 2.679(7) | 1 + x, 1 + y, z | |
| 2 | C(17)–H(17)⋯O(4) | 0.930 | 2.417 | 138.4 | 3.17(1) | 2 − x, 1 − y, −z |
| O(300)–H(300)⋯O(202) | 0.820 | 2.168 | 167.7 | 2.97(1) | −1 + x, y, z | |
| 3 | C(26)–H(26)⋯O(3) | 0.950 | 2.451 | 149.7 | 3.31(1) | 1 + x, y, z |
2.3 Computational details
All structures were optimized with the Gaussian 09 software60 and calculated for an isolated molecule using Density Functional Theory (DFT)61 at the B3LYP/LanL2DZ level of theory as well as for NBO analysis. Cif files of the complexes were used as input file for theoretical calculations.2.4 Docking details
The pdb files 4r5y, 3ai8, 5cdn, 3c0z, 2bx8, 1peo, 3qfa, 1njb, 4gfh for the nine receptors, BRAF kinase, cathepsin B (CatB), DNA gyrase, histone deacetylase (HDAC7), recombinant human albumin (rHA), ribonucleotide reductases (RNR), thioredoxin reductase (TrxR), thymidylate synthase (TS), topoisomerase II (Top II), respectively, used in this research were obtained from the Protein Data Bank (pdb).62 The obtained full version of Genetic Optimisation for Ligand Docking (GOLD) 5.5 (ref. 63) was used for the docking. The Hermes visualizer in the GOLD Suite was used to further prepare the structures and the receptors for docking. The optimized H3LBr ligand and also cif file of the complexes 1–3 were used for docking studies. The region of interest used for Gold docking was defined as all the protein residues within the 6 Å of the reference ligand “A” that accompanied the downloaded protein. All free water molecules in the structure of the proteins were deleted before docking. Default values of all other parameters were used and the complexes were submitted to 10 genetic algorithm runs using the GOLDScore fitness function.2.5 Biological evaluation
3. Results and discussion
Two Schiff base ligand were made in one-pot syntheses by condensation of 5-bromo-2-hydroxybenzaldehyde with diamine precursors in a 2![[thin space (1/6-em)]](https://www.rsc.org/images/entities/char_2009.gif) :
:![[thin space (1/6-em)]](https://www.rsc.org/images/entities/char_2009.gif) 1 molar ratio. Three complexes 1–3 have been synthesized by template condensation of mentioned aldehyde and diamine at the presence of the M(OAc)2 (M: Co (1), Cu (2), Zn (3)). The complexes are air-stable and soluble in DMSO.
1 molar ratio. Three complexes 1–3 have been synthesized by template condensation of mentioned aldehyde and diamine at the presence of the M(OAc)2 (M: Co (1), Cu (2), Zn (3)). The complexes are air-stable and soluble in DMSO.
3.1 Spectroscopic characterization
In the IR spectrum of the H3LBr, a broad absorption band at above 3400 cm−1 due to the vibration of the alcoholic unit which is shifted to the higher frequencies (9–20 cm−1) after complexation in 1–3. The weak peaks at above and below the 3000 cm−1 are compatible with the aromatic and aliphatic moieties in the structure of the all compounds, respectively. The ν (C![[double bond, length as m-dash]](https://www.rsc.org/images/entities/char_e001.gif) N) peak in the complexes shifted to the lower frequencies (4–30 cm−1), confirming the coordination of this unit to the metal centers. In the spectra of the all structures, the frequencies near 1250 and 1100 cm−1 which can be assigned to the asymmetric and symmetric stretching vibrations of the ether group revealed that the etheric oxygen site in these structures.
N) peak in the complexes shifted to the lower frequencies (4–30 cm−1), confirming the coordination of this unit to the metal centers. In the spectra of the all structures, the frequencies near 1250 and 1100 cm−1 which can be assigned to the asymmetric and symmetric stretching vibrations of the ether group revealed that the etheric oxygen site in these structures.
In the FT-IR spectrum of 2, three bands near 1640, 1320 and 650 cm−1 were assigned to the νas (COO), νs (COO) and δ (OCO) respectively, confirming the presence of the acetato ligand. The differences between asymmetric (νas) and symmetric (νs) stretching of the acetate group (Δ) can reveal its coordination type. In monodentate complexes, Δ values are much greater than the acetate salt (164 cm−1) while in bidentate complexes these values are significantly less than the acetate salt.64,65 The Δ value for 2 is 312 cm−1 suggests pseudo-monodentate coordination, which is consistent with the literature structure.66
To interpret the NMR spectra, some carbon atoms of the ligands are marked in Scheme 1. In the NMR spectrum of ligand, the signal of the phenolic hydrogen atoms is observed at the lowest magnetic field and was not observed in the spectra of the 3, confirming the deprotonation of them during the complexation process. In the downfield region, there are other signals that can be assigned to the aromatic and imine protons. The aliphatic protons are observed at the range of 4–5 ppm.
3.2 Description of the crystal structures
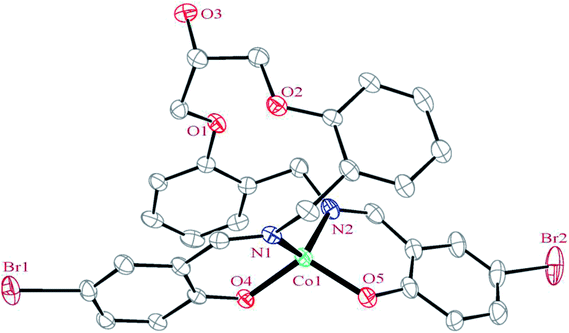 | ||
| Fig. 1 ORTEP diagram of the molecular structure of 1. The ellipsoids are drawn at the 20% probability level. The hydrogen atoms were deleted for clarity. | ||
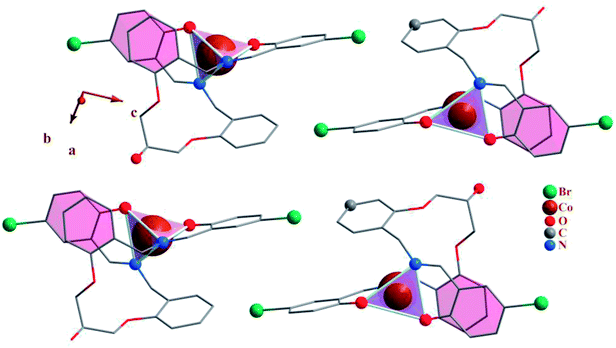 | ||
| Fig. 2 Packing of 1, showing the π–π stacking interactions. Each CoN2O2 unit is shown as tetrahedron. | ||
 | ||
| Scheme 2 Coordinated bond lengths average for all cobalt (a) and zinc (b) complexes containing the presented moiety. | ||
In the structure of the complex, the ligand is tetradentate and forms two six-membered and one 14-membered chelate ring. The formation of a 14-membered chelate ring around the cobalt atom is very rare and there is only one example among the CSD complexes (in this search, the 14-membered chelate ring formed by macrocyclic ligands were omitted).68 One six-membered chelate ring is planar (with rms value of 0.033 Å for the N2 atom) while another is the non-planar (with rms value of 0.139 Å for the Co1 atom). The difference between planarity of the chelate rings can be attributed to the coordinated bond angles of these rings.
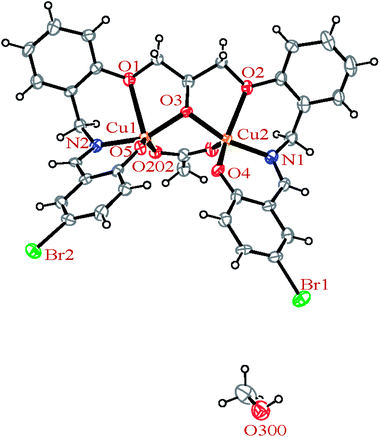 | ||
| Fig. 4 ORTEP diagram of the molecular structure of 2. The ellipsoids are drawn at the 20% probability level. | ||
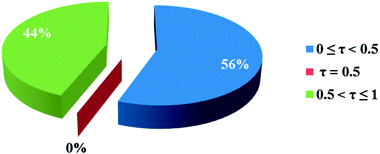
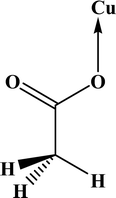
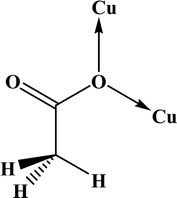
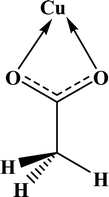
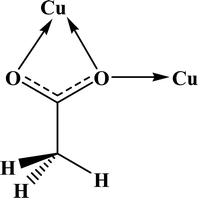
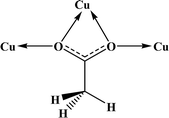
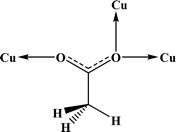
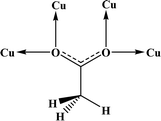
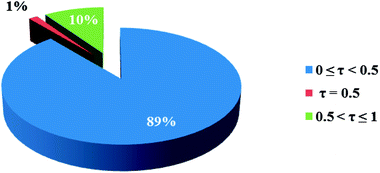
In the crystal structures of the 2, one acetate ligand acts as bridge between two copper atoms. For comparing the coordination mode of the acetato ligand in 2 with CSD analogues, a structural survey was carried out and results presented in Table 4. These data reveal that eight different coordination modes have been reported for copper complexes containing the acetato ligand. Among these coordination modes, the “O;O” mode (Table 4) is the most observed ones (48%, Fig. 5) in which the acetato unit acts as O2-donor and bridges two metal centers. This coordination mode also observed in the 2. The monodentate mode of “O” is the second most common among the CSD analogues (27%, Fig. 5). In another comparison, the percentage of bridged and non-bridged structures was calculated. These data revealed that the acetato unit commonly forms a bridged structure (59%) with copper atoms. In most cases this ligand is coordinated toward copper atom without forming the chelate ring (84%).
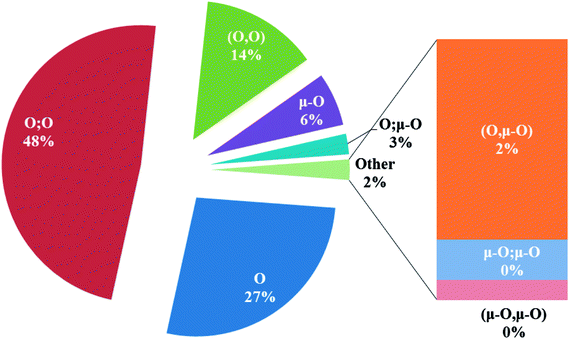 | ||
| Fig. 5 Pie chart, the percentage of different coordination modes of the acetato ligand among the complexes of the copper. | ||
The H3LBr ligand precursor is triply deprotonated and heptadentate and form four six-membered and two five-membered chelate rings. The deprotonated alcoholic moiety of ligands is bridging two copper atoms.
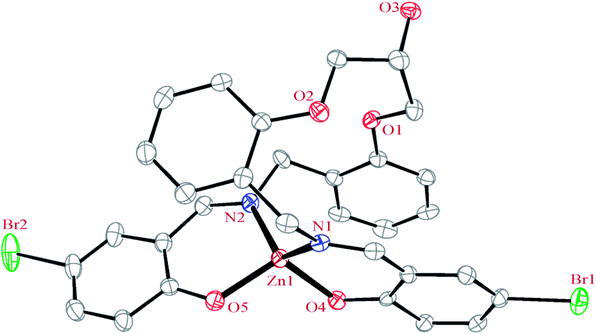 | ||
| Fig. 6 ORTEP diagram of the molecular structure of 3. The ellipsoids are drawn at the 20% probability level. The hydrogen atoms were deleted for clarity. | ||
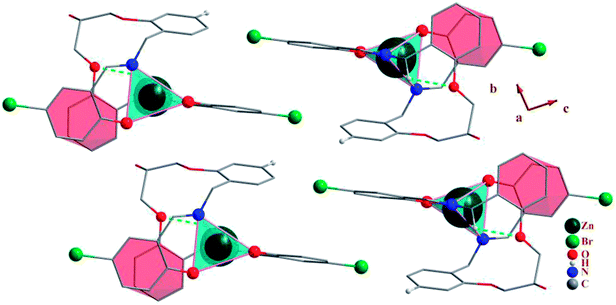 | ||
| Fig. 7 Packing of 3, showing the π–π stacking and hydrogen bonds. Each ZnN2O2 unit is shown as tetrahedron. | ||
In this complex, the ligand acts as tetradentate and forms two six-membered and one 14-membered chelate ring. The formation of 14-membered chelate ring around the zinc atom is very rare and there is only one example for such structure70 (in this search, the 14-memberd chelate ring formed by macrocyclic ligands were omitted). One six-membered chelate ring is planar (with rms value of 0.027 Å for the C4 and C28 atoms) while another is the non-planar (with rms value of 0.139 Å for the Zn1 atom).
In addition to the hydrogen bonds, the crystal networks of the compounds (1, 3) are further stabilized by inter and intra molecular π–π stacking interactions (Table 5) between aromatic rings71,72 (Fig. 2 and 7). H3LBr ligand has two arms and each arm contains one terminal and one middle aromatic ring. In 1 and 3 the arms of ligand are twisted to form π–π stacking interactions between the terminal phenyl of one arm with the middle aromatic group on the other arm. The formation of these types of the intra molecular π–π stacking interactions may be affecting the coordination geometry in these ligands.
| Centroid–centroid distance | Angle between the planes | Perpendicular distance | Slippage | Type | |
|---|---|---|---|---|---|
| 1 | 3.883 | 8.65 | — | — | Intra |
| 3.697 | 8.65 | — | — | Inter | |
| 3 | 3.881 | 9.68 | — | — | Intra |
| 3.700 | 9.68 | — | — | Inter | |
| 3.749 | 6.37 | — | — | Intra | |
| 3.673 | 6.37 | — | — | Inter |
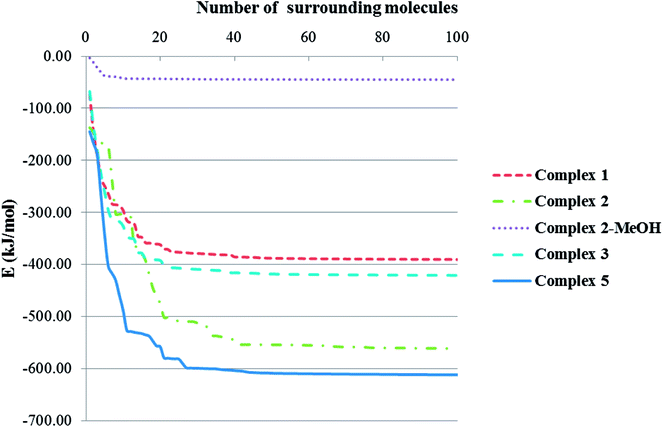
Total intermolecular interaction energy for one molecule of the complexes 1–3 were calculated using Mercury73 and its CSD-materials tool.62,74 For this, the sum of the intermolecular interactions energy in a molecular packing shell containing 100 molecules75 around the one molecule of 1–3 were calculated to be −390.23, −561.05 (complex 2), −44.96 (MeOH in the 2) and −420.68 kJ mol−1 (Fig. 9), respectively, confirming that 2 is more stabilized in the solid state by its network interactions than the others.75 Also comparing the energy level of interactions for one molecule of 2 with the trapped methanol molecule in the crystal network of 2 showed that one molecule of 2 is more stabilized than the methanol molecule by inter molecular interactions. In 1, 89% of the total energy equates to the interactions with its fourteen closest neighboring molecules in ranges of 7.147–13.965 Å distances (Fig. 9). This value for the same condition for complexes 2 and 3 is 65 (complex 2), 96 (MeOH in the complex 2) and 89%.
3.3 Theoretical studies
To study the charge distribution before and after complexation, an NBO analysis was done on the free H3LBr ligand and its copper and zinc complexes (Table 6). For this study all structures were optimized before NBO analysis (Fig. 10, H3LBr). The results reveal that the calculated charge on the metal atom (+0.91 and +1.45 for copper and zinc atoms, respectively) is lower than the formal charge (+2) owing to the electron donation of ligand during the complexation. The charge on the copper atom is decreased more than the zinc atom which can be attributed to the three step deprotonation (L3−) of the ligand in coordination toward copper atom while in zinc complex the ligand act as HL2−. Also the total charge on the acetato ligand is calculated to be −0.58 for 2, showing the electron donation of this ligand to the copper atom and may be another reason for the lower charge on the copper compared to the zinc atom. Based on the calculated total charge values, the charge of the carbon atoms of complexes is more positive than that of the free ligand, whilst the total charge of the hydrogen and nitrogen atoms is more negative than respect to the free ligands. This observation reveals that the carbon atoms play an important role in electron donation toward metal atom and decreasing the charge of them.| C | COAc | H | HOAc | N | NNO2 | O | ONO2 | OOAc | Br | Metal | |
|---|---|---|---|---|---|---|---|---|---|---|---|
| H3LBr | −2.75 | — | 7.08 | — | −0.93 | — | −3.49 | — | — | 0.09 | — |
| Complex 2 | −2.44 (+0.31) | 0.17 | 5.56 (−1.52) | 0.71 | −1.11 (−0.18) | — | −3.30 (+0.19) | — | −1.46 | 0.06 (−0.03) | 1.81 |
| Complex 3 | −2.46 (+0.29) | — | 6.03 (−1.05) | — | −1.33 (−0.40) | — | −3.75 (−0.26) | — | — | 0.06 (−0.03) | 1.45 |
In the structures of the optimized 2opt, τ was calculated to be 0.08, indicating a square-pyramidal geometry with negligible distortion respect to the solid state result. Similarly to the X-ray results, the Cu–OEther bond length is longer than the other bonds. For the optimized structure of the 3opt, the τsq value is calculated to be 0.34, indicating an incline to a tetrahedral geometry similarly to the solid state result.
3.4 Docking studies
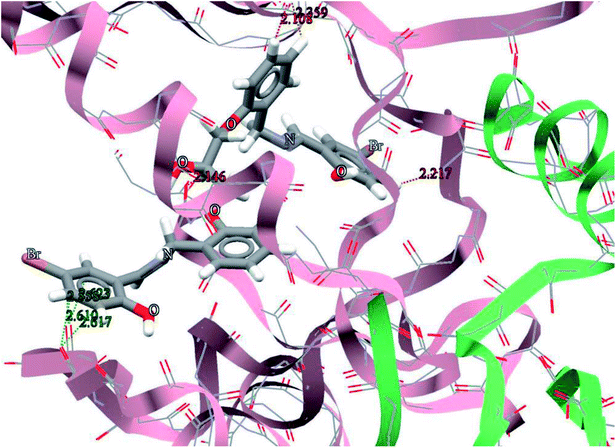
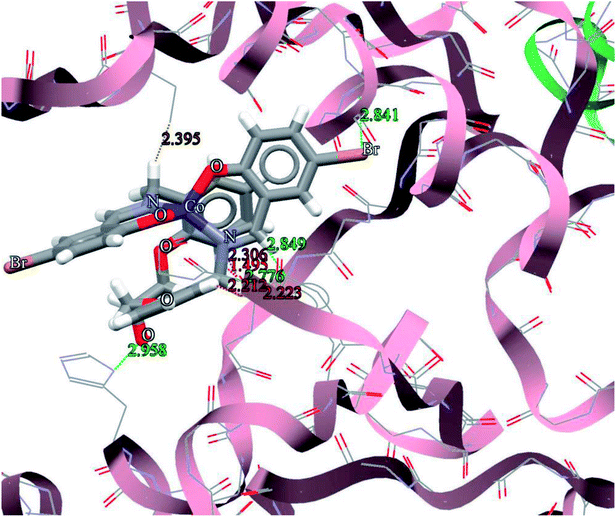
For predicting and comparison the biological activates of the ligand and complexes, interactions of these compounds with nine macromolecule receptors using Gold63 docking software was studied. The Gold docking results are reported in terms of the values of fitness which means the higher the fitness the better the docked interaction of the compounds.53 The results of the docking presented in this work is the best binding results out of the favorably ten predicted by Gold.The general features from the Gold docking prediction (Table 7) show that all studied structures can be consider as biologically active compounds. The best predicted target for the H3LBr is TrxR, while for the complexes is TS. The docking result of the interaction between H3LBr and complex 1 with BRAF kinase protein is shown in the Fig. 11 and 12, respectively.
| BRAF-kinase | CatB | DNA-gyrase | HDAC7 | rHA | RNR | TrxR | TS | Top II | |
|---|---|---|---|---|---|---|---|---|---|
| H3LBr | 70.96 | 50.46 | 62.70 | 78.53 | 71.85 | 60.63 | 84.75 | 73.37 | 75.66 |
| H3LNO2 | 68.99 | 50.14 | 54.82 | 70.64 | 70.40 | 68.56 | 83.28 | 76.29 | 71.07 |
| Complex 1 | 34.52 | 27.07 | 44.94 | 28.77 | 27.44 | 39.93 | 15.21 | 58.54 | 53.01 |
| Complex 2 | 59.63 | 35.38 | 17.23 | 44.31 | 6.76 | 42.29 | 54.29 | 62.61 | 24.13 |
| Complex 3 | 33.99 | 32.74 | 29.81 | 9.54 | 33.34 | 34.14 | 0.00 | 55.23 | 45.03 |
3.5 Biological screening
We evaluated the in vitro cytotoxicity of H3LBr ligand and its complexes with cobalt, copper and zinc on the human cancer cell line K562. Results are expressed as the IC50 values and are summarized in Table 8. The MTT assay showed that tested compounds exerted significant cytotoxic effects against K562 cell lines. For the studied compounds, the cytotoxic effects of the complexes are higher than the free ligand; showing that the biologically activities of these ligands are increased by binding to a metal center. The order of the cytotoxicity activity for different metal centers is Co > Cu > Zn.| Compounds | 24 h | 48 h | 72 h |
|---|---|---|---|
| H3LBr | 22.00 ± 0.51 | 22.03 ± 0.43 | 21.87 ± 0.21 |
| Complex 1 | 11.56 ± 0.13 | 10.71 ± 0.26 | 11.52 ± 0.10 |
| Complex 2 | 13.92 ± 0.42 | 13.17 ± 0.50 | 13.35 ± 0.32 |
| Complex 3 | 14.58 ± 0.33 | 15.67 ± 0.37 | 16.36 ± 0.32 |
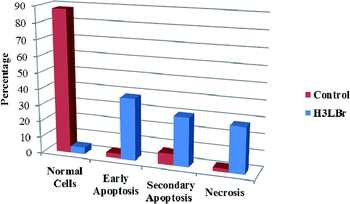
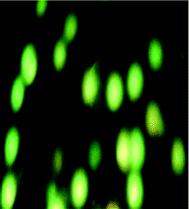
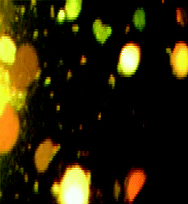
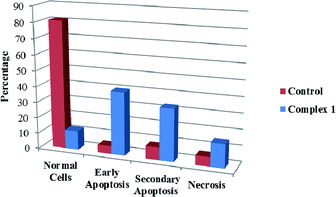
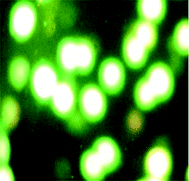
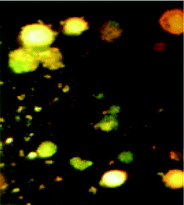
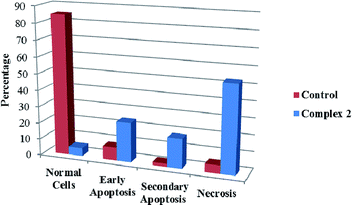
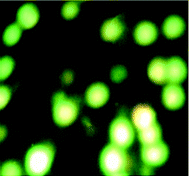
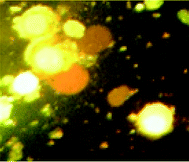
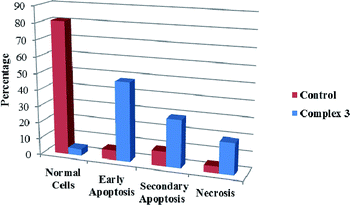
We also investigated the type of cell death induced by compounds in K562 cells, based on the analysis of morphological characteristics of the cells after the double staining of cells with acridine orange (AO) and propidium iodide (PI) by fluorescence microscopy. Morphological features of apoptosis such as chromatin condensation, nuclear fragmentation and alterations in the size and the shape of cells were observed after 48 h treatment with IC50 concentrations of the compounds. Also, the features of late apoptosis were clearly expressed; the DNA was fragmented and stained orange and red. As shown in Table 9, the percentage of early apoptotic cells after treatment with complex 3 for 48 h is higher than the other compounds (48%). Among the four tested compounds, the ability of complexes 1 and 2 to induce secondary apoptosis (33%) and necrosis (53%) in K562 cells is significant.
4. Conclusion
Four compartmental Schiff compounds, 2,2′-((((((2-hydroxypropane-1,3-diyl)bis(oxy))bis(2,1-phenylene))bis(methylene))bis(azanylylidene))bis(methanylylidene))bis(4-bromophenol) (H3LBr), [Co(HLBr)] (1), [Cu2(LBr)(μ-1,3-OAc)]·MeOH (2), [Zn(HLBr)] (3), were prepared, their spectral (IR, 1H NMR) and structural (single crystal X-ray diffraction) properties were investigated. In the complexes of 1 and 3, the metal atom has tetrahedral geometry. The ligand molecule in theses structure forms two six-membered and one 14-membered chelate rings which is very rare among the CSD database. In the complex of 2 the copper atom has a square pyramidal geometry. In this structure, HLBr and acetato ligands bridge two copper atoms to form a binuclear structure. Among the different coordination modes of the acetate ligand which is coordinated to the copper atom, the “O;O” mode is the most observed ones (48%) which is observed mode in 2. Based on these data, the acetato ligand commonly forms a bridged (59%) and non-chelated (84%) structures with copper atom.In addition to the hydrogen bonds in the crystal network of the complexes, there are π–π stacking interactions between aromatic rings, showing the high ability of these molecules to interact with neighboring units and making them good choice to docking studies. The docking studies on the eight synthesized compounds revealed that these compounds might be biologically active by interacting with the nine biomacromolecules (BRAF kinase, CatB, DNA gyrase, HDAC7, rHA, RNR, TrxR, TS and Top II). The best predicted targets for the free ligand is TrxR, while for the complexes is TS. The biological assay of the compounds on the human cancer cell line K562 confirmed the docking results. For the studied compounds, the cytotoxic effects of the complexes are higher than the free ligand with order of the cytotoxicity activity Co > Cu > Zn. Among the compounds, the complexes 1–3 can induce the secondary apoptosis (33%), necrosis (53%) and early apoptosis (48%) in K562 cells better than the others, respectively. The NBO analysis of the compounds revealed that among the hydrogen, carbon, nitrogen and oxygen atoms of the coordinated ligand, the carbon atoms act as electron donor and decrease the charge of the metal atom.
Conflicts of interest
There are no conflicts to declare.Acknowledgements
This study has been supported by the Council of the Payame Noor University, Iran. The authors thank Prof. Dr K. Adil from Universite du Maine, Institut des Molecules et Materiaux du Mans, Le Mans Cedex, France for the X-ray crystallography data collection.References
- K. C. Gupta and A. K. Sutar, Coord. Chem. Rev., 2008, 252, 1420–1450 CrossRef CAS
.
- R. Kannappan, M. Matsumoto, J. Hallren and K. M. Nicholas, J. Mol. Catal. A: Chem., 2011, 339, 72–78 CrossRef CAS
.
- L.-H. Li, W.-K. Dong, Y. Zhang, S. F. Akogun and L. Xu, Appl. Organomet. Chem., 2017, 31, e3818 CrossRef
.
- A. Wesley Jeevadason, K. Kalidasa Murugavel and M. A. Neelakantan, Renewable Sustainable Energy Rev., 2014, 36, 220–227 CrossRef CAS
.
- W.-K. Dong, X.-L. Li, L. Wang, Y. Zhang and Y.-J. Ding, Sens. Actuators, 2016, B229, 370–378 CrossRef
.
- B.-J. Wang, W.-K. Dong, Y. Zhang and S. F. Akogun, Sens. Actuators, 2017, B247, 254–264 CrossRef
.
- I. Ahamad, R. Prasad and M. A. Quraishi, Corros. Sci., 2010, 52, 933–942 CrossRef CAS
.
- C.-M. Che, S.-C. Chan, H.-F. Xiang, M. C. W. Chan, Y. Liu and Y. Wang, Chem. Commun., 2004, 1484–1485 RSC
.
- M. Zhang, D.-M. Xian, H.-H. Li, J.-C. Zhang and Z.-L. You, Aust. J. Chem., 2012, 65, 343–350 CAS
.
- M. D. Altıntop, A. Özdemir, G. Turan-Zitouni, S. Ilgın, Ö. Atlı, G. İşcan and Z. A. Kaplancıklı, Eur. J. Med. Chem., 2012, 58, 299–307 CrossRef PubMed
.
- V. C. da Silveira, J. S. Luz, C. C. Oliveira, I. Graziani, M. R. Ciriolo and A. M. d. C. Ferreira, J. Inorg. Biochem., 2008, 102, 1090–1103 CrossRef PubMed
.
- K. Shanker, R. Rohini, V. Ravinder, P. M. Reddy and Y.-P. Ho, Spectrochim. Acta, Part A, 2009, 73, 205–211 CrossRef PubMed
.
- Y. Li and Z.-y. Yang, Inorg. Chim. Acta, 2009, 362, 4823–4831 CrossRef CAS
.
- M. Taha, N. H. Ismail, M. S. Baharudin, S. Lalani, S. Mehboob, K. M. Khan, S. yousuf, S. Siddiqui, F. Rahim and M. I. Choudhary, Med. Chem. Res., 2015, 24, 1310–1324 CrossRef CAS
.
- C. Jing, C. Wang, K. Yan, K. Zhao, G. Sheng, D. Qu, F. Niu, H. Zhu and Z. You, Bioorg. Med. Chem., 2016, 24, 270–276 CrossRef CAS PubMed
.
- J. R. Morrow and K. A. Kolasa, Inorg. Chim. Acta, 1992, 195, 245–248 CrossRef CAS
.
- A. D. Tiwari, A. K. Mishra, S. B. Mishra, B. B. Mamba, B. Maji and S. Bhattacharya, Spectrochim. Acta, Part A, 2011, 79, 1050–1056 CrossRef CAS PubMed
.
- A. Biswas, S. Mondal and S. Mohanta, J. Coord. Chem., 2013, 66, 152–170 CrossRef CAS
.
- P. Chakraborty and S. Mohanta, Polyhedron, 2015, 87, 98–108 CrossRef CAS
.
- A. Jana, K. Das, S. Konar, A. Dhara, S. Biswas, S. Chatterjee and T. K. Mondal, J. Mol. Struct., 2015, 1100, 318–327 CrossRef CAS
.
- P. Chakraborty, I. Majumder, H. Kara, S. K. Chattopadhyay, E. Zangrando and D. Das, Inorg. Chim. Acta, 2015, 436, 139–145 CrossRef CAS
.
- P. A. Vigato, V. Peruzzo and S. Tamburini, Coord. Chem. Rev., 2012, 256, 953–1114 CrossRef CAS
.
- F. Benetollo, P. Di Bernardo, S. Tamburini, P. A. Vigato and P. Zanonato, Inorg. Chem. Commun., 2008, 11, 246–251 CrossRef CAS
.
- L. Chen, W.-K. Dong, H. Zhang, Y. Zhang and Y.-X. Sun, Cryst. Growth Des., 2017, 17, 3636–3648 CrossRef CAS
.
- W.-K. Dong, J.-C. Ma, L.-C. Zhu and Y. Zhang, New J. Chem., 2016, 40, 6998–7010 RSC
.
- S. A. Sadeek, M. S. El-Attar and S. M. Abd El-Hamid, J. Mol. Struct., 2013, 1051, 30–40 CrossRef CAS
.
- D. E. Fenton, Inorg. Chem. Commun., 2002, 5, 537–547 CrossRef CAS
.
- F. Benetollo, V. Peruzzo, S. Tamburini and P. A. Vigato, Inorg. Chem. Commun., 2012, 15, 84–87 CrossRef CAS
.
- D. E. Fenton and H. Okawa, Chem. Ber., 1997, 130, 433–442 CrossRef CAS
.
- A. Jayamani, M. Sethupathi, S. O. Ojwach and N. Sengottuvelan, Inorg. Chem. Commun., 2017, 84, 144–149 CrossRef CAS
.
- E. Lodyga-Chruscinska, M. Symonowicz, A. Sykula, A. Bujacz, E. Garribba, M. Rowinska-Zyrek, S. Oldziej, E. Klewicka, M. Janicka, K. Krolewska, M. Cieslak, K. Brodowska and L. Chruscinski, J. Inorg. Biochem., 2015, 143, 34–47 CrossRef CAS PubMed
.
- N. Nanjundan, R. Narayanasamy, S. Geib, K. Velmurugan, R. Nandhakumar, M. D. Balakumaran and P. T. Kalaichelvan, Polyhedron, 2016, 110, 203–220 CrossRef CAS
.
- A. Banerjee, A. Guha, J. Adhikary, A. Khan, K. Manna, S. Dey, E. Zangrando and D. Das, Polyhedron, 2013, 60, 102–109 CrossRef CAS
.
- R. Sanyal, S. K. Dash, P. Kundu, D. Mandal, S. Roy and D. Das, Inorg. Chim. Acta, 2016, 453, 394–401 CrossRef CAS
.
- A. K. Abu Al-Nasr and R. M. Ramadan, Spectrochim. Acta, 2013, A105, 14–19 CrossRef PubMed
.
- V. R. Martínez, M. V. Aguirre, J. S. Todaro, O. E. Piro, G. A. Echeverría, E. G. Ferrer and P. A. M. Williams, Toxicol. In Vitro, 2018, 48, 205–220 CrossRef PubMed
.
- A. Adhikari, N. Kumari, M. Adhikari, N. Kumar, A. K. Tiwari, A. Shukla, A. K. Mishra and A. Datta, Bioorg. Med. Chem., 2017, 25, 3483–3490 CrossRef CAS PubMed
.
- L.-Y. Tu, J. Pi, H. Jin, J.-Y. Cai and S.-P. Deng, Bioorg. Med. Chem. Lett., 2016, 26, 2730–2734 CrossRef CAS PubMed
.
- J. Dam, Z. Ismail, T. Kurebwa, N. Gangat, L. Harmse, H. M. Marques, A. Lemmerer, M. L. Bode and C. B. de Koning, Eur. J. Med. Chem., 2017, 126, 353–368 CrossRef CAS PubMed
.
- D. Palanimuthu and A. G. Samuelson, Inorg. Chim. Acta, 2013, 408, 152–161 CrossRef CAS
.
- A. K. Renfrew, E. S. O'Neill, T. W. Hambley and E. J. New, Coord. Chem. Rev., 2017, 221–233 Search PubMed
.
- P. Nithya, R. Rajamanikandan, J. Simpson, M. Ilanchelian and S. Govindarajan, Polyhedron, 2018, 145, 200–217 CrossRef CAS
.
- F. A. Al-Saif, K. A. Alibrahim, J. A. Alfurhood and M. S. Refat, J. Mol. Liq., 2018, 249, 438–453 CrossRef CAS
.
- S. R. Morcelli, É. S. Bull, W. S. Terra, R. O. Moreira, F. V. Borges, M. M. Kanashiro, A. J. Bortoluzzi, L. L. F. Maciel, J. C. de A. Almeida, A. H. Júnior and C. Fernandes, J. Inorg. Biochem., 2016, 161, 73–82 CrossRef CAS PubMed
.
- A. K. El-Sawaf, F. El-Essawy, A. A. Nassar and E.-S. A. El-Samanody, J. Mol. Struct., 2018, 1157, 381–394 CrossRef CAS
.
- M. Jopp, J. Becker, S. Becker, A. Miska, V. Gandin, C. Marzano and S. Schindler, Eur. J. Med. Chem., 2017, 132, 274–281 CrossRef CAS PubMed
.
- N. Sanz del Olmo, M. Maroto-Díaz, R. Gómez, P. Ortega, M. Cangiotti, M. F. Ottaviani and F. J. de la Mata, J. Inorg. Biochem., 2017, 177, 211–218 CrossRef CAS PubMed
.
- C. Acilan, B. Cevatemre, Z. Adiguzel, D. Karakas, E. Ulukaya, N. Ribeiro, I. Correia and J. C. Pessoa, Data Brief, 2016, 9, 1160–1174 CrossRef PubMed
.
- S. S. Massoud, F. R. Louka, G. T. Ducharme, R. C. Fischer, F. A. Mautner, J. Vančo, R. Herchel, Z. Dvořák and Z. Trávníček, J. Inorg. Biochem., 2018, 180, 39–46 CrossRef CAS PubMed
.
- J. Qi, S. Liang, Y. Gou, Z. Zhang, Z. Zhou, F. Yang and H. Liang, Eur. J. Med. Chem., 2015, 96, 360–368 CrossRef CAS PubMed
.
- F. Marandi, K. Moeini, F. Alizadeh, Z. Mardani, C. K. Quah, W.-S. Loh and J. D. Woollins, Inorg. Chim. Acta, 2018, 482, 717–725 CrossRef CAS
.
- F. Marandi, K. Moeini, F. Alizadeh, Z. Mardani, K. Quah Ching and W.-S. Loh, Z. Naturforsch., 2018, 73b, 369 Search PubMed
.
- A. A. Adeniyi and P. A. Ajibade, Molecules, 2013, 18, 3760–3778 CrossRef CAS PubMed
.
- H. G. Drexler, The Leukemia-Lymphoma Cell Line Facts Book, Academic Press, London, 2001 Search PubMed
.
- S. A. Hosseini-Yazdi, P. Samadzadeh-Aghdam, A. Mirzaahmadi, A. A. Khandar, G. Mahmoudi, M. Ruck, T. Doert, S. S. Balula and L. Cunha-Silva, Polyhedron, 2014, 80, 41–46 CrossRef CAS
.
- G. Sheldrick, Acta Crystallogr., 2008, A64, 112–122 CrossRef PubMed
.
- L. J. Farrugia, J. Appl. Crystallogr., 1997, 30, 565 CrossRef CAS
.
- M. N. Burnett and C. K. Johnson, Ortep-III, Report ORNL-6895, Oak Ridge National Laboratory, Oak Ridge, Tennessee, U.S., 1996 Search PubMed
.
- G. Bergerhof, M. Berndt and K. Brandenburg, J. Res. Natl. Inst. Stand. Technol., 1996, 101, 221–225 CrossRef PubMed
.
- M. J. Frisch, G. W. Trucks, H. B. Schlegel, G. E. Scuseria, M. A. Robb, J. R. Cheeseman, G. Scalmani, V. Barone, B. Mennucci, G. A. Petersson, H. Nakatsuji, M. Caricato, X. Li, H. P. Hratchian, A. F. Izmaylov, J. Bloino, G. Zheng, J. L. Sonnenberg, M. Hada, M. Ehara, K. Toyota, R. Fukuda, J. Hasegawa, M. Ishida, T. Nakajima, Y. Honda, O. Kitao, H. Nakai, T. Vreven, J. A. Montgomery Jr., J. E. Peralta, F. Ogliaro, M. J. Bearpark, J. Heyd, E. N. Brothers, K. N. Kudin, V. N. Staroverov, R. Kobayashi, J. Normand, K. Raghavachari, A. P. Rendell, J. C. Burant, S. S. Iyengar, J. Tomasi, M. Cossi, N. Rega, N. J. Millam, M. Klene, J. E. Knox, J. B. Cross, V. Bakken, C. Adamo, J. Jaramillo, R. Gomperts, R. E. Stratmann, O. Yazyev, A. J. Austin, R. Cammi, C. Pomelli, J. W. Ochterski, R. L. Martin, K. Morokuma, V. G. Zakrzewski, G. A. Voth, P. Salvador, J. J. Dannenberg, S. Dapprich, A. D. Daniels, Ö. Farkas, J. B. Foresman, J. V. Ortiz, J. Cioslowski and D. J. Fox, Gaussian, Inc., Wallingford, CT, USA, 2009
.
- J. P. Perdew, Phys. Rev., 1986, B33, 8822–8824 Search PubMed
.
- A. Gavezzotti, Acc. Chem. Res., 1994, 27, 309–314 CrossRef CAS
.
- G. Jones, P. Willett, R. C. Glen, A. R. Leach and R. Taylor, J. Mol. Biol., 1997, 267, 727–748 CrossRef CAS PubMed
.
- K. Nakamoto, in Infrared and raman spectra of inorganic and coordination compounds, John Wiley, Hoboken, ed. 6, 2009, p. 232 Search PubMed
.
- M. Hakimi, K. Moeini, Z. Mardani and F. Khorrami, J. Korean Chem. Soc., 2013, 57, 352–356 CrossRef CAS
.
- B. Żurowska, J. Mroziński and K. Ślepokura, Polyhedron, 2007, 26, 3379–3387 CrossRef
.
- M. Hakimi, Z. Mardani, K. Moeini and F. Mohr, Polyhedron, 2015, 102, 569–577 CrossRef CAS
.
- H. Zhang, W. Jiang, J. Yang, Y.-Y. Liu, S. Song and J.-F. Ma, CrystEngComm, 2014, 16, 9939–9946 RSC
.
- A. W. Addison, T. Rao, J. Reedjik, J. V. Rijn and G. Verschoor, Dalton Trans., 1984, 1349 RSC
.
- B. Nath, D. Kalita and J. B. Baruah, J. Coord. Chem., 2011, 64, 2545–2553 CrossRef CAS
.
- F. Marandi, K. Moeini, B. Mostafazadeh and H. Krautscheid, Polyhedron, 2017, 133, 146–154 CrossRef CAS
.
- F. Marandi, K. Moeini, S. Ghasemzadeh, Z. Mardani, C. K. Quah and W.-S. Loh, J. Mol. Struct., 2017, 1149, 92–98 CrossRef CAS
.
- C. F. Macrae, I. J. Bruno, J. A. Chisholm, P. R. Edgington, P. McCabe, E. Pidcock, L. Rodriguez-Monge, R. Taylor, J. Van De Streek and P. A. Wood, J. Appl. Crystallogr., 2008, 41, 466–470 CrossRef CAS
.
- A. Gavezzotti and G. Filippini, J. Phys. Chem., 1994, 98, 4831–4837 CrossRef CAS
.
- Z. Mardani, V. Golsanamlou, S. Khodavandegar, K. Moeini, A. M. Z. Slawin and J. D. Woollins, J. Coord. Chem., 2018, 1–15 Search PubMed
.
Footnote |
| † Electronic supplementary information (ESI) available. CCDC 1828806–1828808 respectively for complexes 1–3 contain the supplementary crystallographic data for this paper. For ESI and crystallographic data in CIF or other electronic format see DOI: 10.1039/c8ra07463a |
| This journal is © The Royal Society of Chemistry 2018 |

