 Open Access Article
Synthesis and characterization of magnetic mesoporous Fe3O4@mSiO2–DODGA nanoparticles for adsorption of 16 rare earth elements†
Jingrui Liab,
Aijun Gong *ab,
Fukai Liab,
Lina Qiuab,
Weiwei Zhangab,
Ge Gaoab,
Yu Liuab and
Jiandi Liab
aSchool of Chemistry and Biological Engineering, University of Science and Technology Beijing, Beijing 100083, China. E-mail: Gongaijun5661@ustb.edu.cn; Fax: +86-10-62334071; Tel: +86-10-82375661
bBeijing Key Laboratory for Science and Application of Functional Molecular and Crystalline Materials, University of Science and Technology Beijing, Beijing 100083, China
First published on 22nd November 2018
Abstract
In this study, novel magnetic mesoporous Fe3O4@mSiO2–DODGA nanoparticles were prepared for efficiently adsorbing and recycling REEs. Fe3O4@mSiO2–DODGA was characterized by powder X-ray diffraction (XRD), transmission electron microscopy (TEM), vibrating sample magnetometry (VSM), Fourier transform infrared spectroscopy (FT-IR) and thermogravimetric analysis (TGA). The adsorption behavior of Fe3O4@mSiO2–DODGA was investigated by ICP-OES. The results showed that the content of DODGA in the adsorbent was 367 μmol g−1. Fe3O4@mSiO2–DODGA exhibited the highest adsorption rates for 15 REEs, except Tm, in a 2 mol L−1 nitric acid solution. Among these elements, the adsorption rates for Nd, Sm, Eu, Dy, Ho, Yb, Lu, Y and Sc ranged from 85.1% to 100.1%. The desorption rates for all 16 REE ions reached their maximum values when 0.01 mol L−1 EDTA was used as the eluent. The desorption rates for Nd, Ce, Sm, Eu, Ho, Yb, Lu, Y, and Sc were 87.7–99.8%. Fe3O4@mSiO2–DODGA had high stability in 2 mol L−1 HNO3 and could be used five times without significant loss of adsorption capacity. Moreover, these nanoparticles had high selectivity, and their adsorption rate was not affected even in a high-concentration solution of a coexisting ion. Therefore, 8 REE ions (Nd, Sm, Eu, Ho, Yb, Lu, Y, and Sc) were selected for the study of adsorption kinetics and adsorption isotherm experiments. It was demonstrated that the values of Qe (equilibrium adsorption capacity) for Nd, Sm, Eu, Ho, Yb, Lu, Y, and Sc were 14.28–60.80 mg g−1. The adsorption of REEs on Fe3O4@mSiO2–DODGA followed the pseudo-second-order kinetic model, Elovich model and Langmuir isotherm model, which indicated that the adsorption process of Fe3O4@mSiO2–DODGA for REEs comprised single-layer adsorption on a non-uniform surface controlled by chemical adsorption. It was concluded that Fe3O4@mSiO2–DODGA represents a new material for the adsorption of REEs in strongly acidic solutions.
1. Introduction
Rare earth elements (REEs) have many unique physical and chemical properties, which are widely applied in some modern technologies, including alloys,1 magnets,2 ceramics,3 networks and communication devices. The outstanding properties mentioned above make these devices smaller, lighter and faster in terms of performance and enable devices to exhibit greater efficiency, speed, performance and thermal stability. With the dramatic increase in their global consumption, the requirement for pure REEs has also risen over the past two decades. At present, although the extraction of REEs on a large scale has been industrialized, the separation and purification of REEs are still the main technical difficulties and need further industrial processes.Therefore, many efforts have been made to develop efficient methods for extracting and purifying REEs, such as liquid–liquid extraction,4,5 supported liquid extraction6 or solid-phase extraction7 procedures. These methods all rely on the association constants between ligands and REEs. Liquid–liquid extraction is the most widely used method. The most widely used ligands include di(2-ethylhexyl)phosphoric acid (HDEHP, P204),8,9 2-ethylhexylphosphonic acid mono(2-ethylhexyl) ester (HEHEHP, P507),10 and tributyl phosphate (TBP).11 Among the obvious disadvantages inherent in liquid–liquid extraction are the utilization of large volumes of solvents in the extraction procedure and the generation of undesired waste. Supported liquid extraction and solid-phase extraction are relatively environmentally friendly. The combination of a suitable solid phase and effective ligands represents one direction for the development of extraction methods for REEs. Inspired by the above description, nanosized materials are among the candidates for the solid phase. Nanosized materials (e.g., silica nanoparticles,12 carbon nanotubes,13 and magnetic nanoparticles14,15) with a high surface area ratio have been utilized in various fields.16 In particular, magnetic nanoparticles are commonly considered for use as internal supporting materials in some fields for the following reasons: their easy preparation via solvothermal reactions and superparamagnetic features for fast separation from complex samples in practical applications.17 There are several kinds of magnetic solid-phase extraction material that are employed for the adsorption of a single REE such as Eu(III) and Ce(III) in an aqueous solution. These materials mainly include mesoporous SBA-15 modified with the Schiff base N,N′-bis(salicylidene)-1,2-ethylenediamine and decorated on Fe3O4 nanoparticles (SBA-15-BSEA-Fe3O4-NPs),18 a Ce(III) ion-imprinted polymer (Ce(III)-IIP) grafted on Fe3O4 nanoparticles supported by SBA-15 mesopores (Fe3O4@SBA-15-Ce(III)-IIP),19 a core–shell structured Fe3O4@carboxymethylcellulose magnetic composite (Fe3O4@CMC),20 an Fe3O4/sepiolite composite,21 an Fe3O4@cyclodextrin magnetic composite (Fe3O4@CD-MCs)22 and core–shell structured Fe3O4@humic acid magnetic nanoparticles (Fe3O4@HA-MNPs).23
In addition, the ligand is also an important aspect of the design of solid-phase extraction materials. Among the ligands used for adsorbing REEs, N,N,N′,N′-tetraoctyldiglycolamide (TODGA)24,25 is among the ligands commonly used for separation. In this ligand, the functional group diglycolamide (DGA) plays an important role in coordination with REE ions. Some derivatives based on the DGA chemical structure have been synthesized and used industrially for adsorbing REEs and exhibited excellent enrichment and selectivity.26,27 Unfortunately, no previous work has been published in which magnetic nanoparticles modified with a diglycolamide ligand were used for the adsorption of REEs. There have been reports on the synthesis of magnetic nanomaterials modified with diglycolamide ligands, including diglycolamic acid-functionalized chitosan-coated Fe3O4 (Fe@CS-DGA),28 TODGA-coated magnetite nanoparticles (Fe3O4@TODGA),29 and DGA-methacrylate-coated Fe3O4 particles (Fe3O4@MC-DGA).30 However, these materials were employed for removing Pb(II) and extracting Am(III) and Pu(IV) in a nitric acid solution, but not for the adsorption of REEs.
In this study, mesoporous magnetic Fe3O4@mSiO2–DODGA nanomaterials were prepared by modifying the surface of mesoporous Fe3O4 particles with a diglycolamide ligand. In comparison with previously reported materials, 16 REEs other than the radioactive element Pm were used to assess the adsorption properties of the final products. Studies of the influence of coexisting ions and adsorption kinetics demonstrated that Fe3O4@mSiO2–DODGA exhibited better anti-interference performance and a faster adsorption equilibrium process. Moreover, this highly selective Fe3O4@mSiO2–DODGA exhibited high stability and reusability and represents a new solid-phase extraction material for the adsorption of rare earth elements under strongly acidic and high-salinity conditions.
2. Experimental
2.1 Reagents and materials
All reagents were of analytical grade unless otherwise noted. Stock solutions (1.000 g L−1) of 16 REEs (La, Ce, Pr, Nd, Sm, Eu, Gd, Td, Dy, Ho, Er, Tm, Yb, Lu, Y and Sc) were prepared by dissolving appropriate amounts of the corresponding Specpure oxides in dilute HNO3. Working solutions were prepared daily by appropriately diluting the stock solutions. NaCl, Na2SO4, FeCl3, AlCl3, CuSO4, ZnCl2, NaAc, NaHCO3, NH4NO3, HNO3, H2O2, NH3·H2O, CH2Cl2, ethanol, carbamide, ethylene glycol, acetic anhydride, oxalyl chloride and tetraethoxysilane (TEOS) were bought from Sinopharm Chemical Reagent Co., Ltd, China. Diglycolic acid, dioctylamine, cetyltrimethylammonium bromide (CTAB), and aminopropyltriethoxysilane (APTES) were purchased from Sigma-Aldrich Chemical Company. High-purity water (18.2 MΩ cm) obtained from a Milli-Q Element system (Millipore, Molsheim, France) was used directly throughout this study. Plastic and glass containers and all other laboratory materials that could come into contact with the samples and standards were stored in 10% (v/v) nitric acid for 24 h and rinsed with high-purity water.2.2 Material preparation
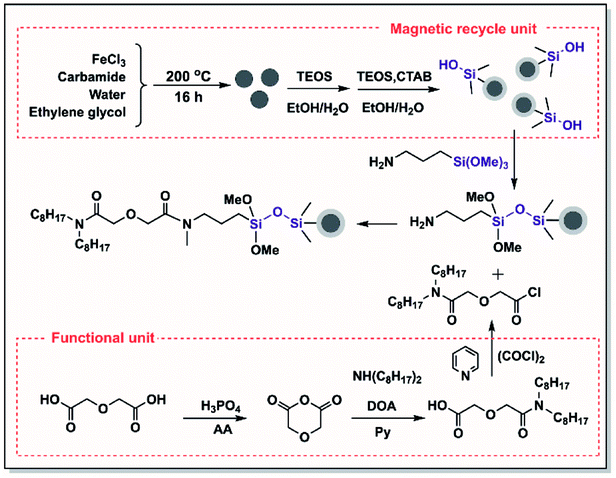
Firstly, a magnetic recycling unit was constructed. Uniform Fe3O4 particles prepared via a solvothermal reaction (Scheme 1)31 were chosen as the inner supporting materials, which were nanosized and had a much larger specific surface area and superparamagnetic properties. Secondly, amine groups were used to modify the surface of the Fe3O4 particles.32–34 Before this chemical modification, an SiO2 layer was coated efficiently on the Fe3O4 core to protect the Fe3O4 core from corrosion by the strong acid in the solution. A further mesoporous SiO2 layer was created on the surface of Fe3O4@SiO2 to further modify the amino groups to prepare Fe3O4@mSiO2@NH2. The mesoporous structure increased the specific surface area of the material to enable modification with a greater amount of amino groups.In the structure of TODGA, both carbonyl groups are bound to N,N-di(n-octyl)amine groups and have low reactivity. Therefore, N,N-dioctyldiglycolic acid (DODGA-OH) was synthesized.35,36 This compound has a highly active carboxylic acid group that can be converted into an acyl chloride (DODGA-Cl) and used to modify the magnetic core. In addition, DODGA-OH retains half of the n-octyl substituents in TODGA, which ensures that the functional groups are hydrophobic. Finally, functional magnetic Fe3O4@mSiO2–DODGA nanomaterials were obtained by modifying the diglycolamide functional unit DODGA-Cl with the aminated Fe3O4@mSiO2@NH2 particles.
2.3 Characterization
Characterization by Fourier transform infrared (FT-IR) spectroscopy was performed with an FT-IR 8400S spectrometer (Shimadzu, Japan). Spectra were recorded over the range of 4000–400 cm−1 in transmission mode, and 32 scans were accumulated at a resolution of 4 cm−1. Magnetic properties were determined with a 7410 vibrating sample magnetometer (VSM, Lake Shore Cryotronics, Inc., Ohio, USA). Morphological observations of the nanoparticles were carried out with a JEM-2010 high-resolution transmission electron microscope (JEOL, Tokyo, Japan). Thermogravimetric analysis (TGA) was conducted using a Mettler Toledo TGA2 analyzer (Switzerland) from 30 to 750 °C at a heating rate of 10 °C min−1. X-ray diffraction (XRD) patterns were recorded in the range of 2θ = 20–80° by step scanning using a Rigaku D/Max-2500 diffractometer (Japan) with Cu Kα radiation. 1H NMR and 13C NMR spectra were recorded with a Bruker AV-400 spectrometer with chemical shifts reported as ppm (in CDCl3 and DMSO-d6 with TMS as an internal standard). Mass spectrometric analysis was carried out using an LCQ Fleet mass spectrometer (Thermo Fisher). An ICP-OES system (715-ES, Varian Medical Systems, USA) was used for the determination of REEs.2.4 Adsorption experiments
Adsorption isotherms were calculated via batch experiments. The adsorbent was mixed with aqueous solutions containing different concentrations of 8 REEs ranging from 1 to 20 mg L−1 and stirred at 298 K for 24 h. The sorbent was subsequently separated with a magnet, and the supernatant was analyzed to determine the remaining concentration (Ce, mg L−1) using ICP-OES.
3. Results and discussion
3.1 Characterization of Fe3O4, Fe3O4@SiO2, and Fe3O4@mSiO2–DODGA
The morphological features of the nanomaterial were characterized by TEM to observe its specific shape and appearance characteristics. As shown in Fig. 1, the hollow Fe3O4 nanoparticles had spherical shapes and small sizes with a mean diameter of 200 nm (Fig. 1a and b). Single nanocrystals were analyzed by SAED, as shown in Fig. 1c. The diffraction patterns exhibited a distribution comprising a series of points, which was consistent with a face-centred crystal pattern, and the diffraction points corresponded to the (220) crystal planes of the crystal. The layer of SiO2 was coated by a sol–gel reaction on the surface of the Fe3O4 particles. Under the same TEM characterization conditions as were used for the hollow Fe3O4 nanoparticles, the mean diameter of the Fe3O4@SiO2 particles increased from 200 nm to 300 nm. Well-defined core–shell structures can be clearly observed in a TEM image of Fe3O4@SiO2 particles (Fig. 1d). The core with dark contrast represented an Fe3O4 particle; the outer layer with light contrast represented the SiO2 shell. The outer layer of mesoporous silica was constructed by a sol–gel reaction with the help of the surfactant CTAB. The outer mesoporous SiO2 layer was lighter in color and looser in structure than the inner SiO2 layer (Fig. 1e and f). The construction of the mesoporous structure on Fe3O4 particles was carried out to increase the specific surface area of the material. To characterize the mesoporous structure, a BET experiment was performed. As shown in Fig. S9,† the pore diameter of Fe3O4@mSiO2–DODGA was about 6 nm. Its specific surface area was 707.181 m2 g−1. In contrast, no pore structures existed in Fe3O4@SiO2 (Fig. S10†). Its specific surface area was 16.284 m2 g−1, which was much smaller than that of Fe3O4@mSiO2–DODGA.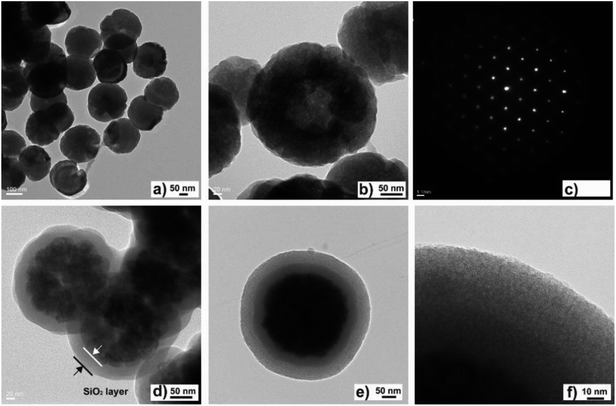 | ||
| Fig. 1 TEM images of hollow Fe3O4 (a and b), SAED pattern (c), and TEM images of Fe3O4@SiO2 (d) and Fe3O4@mSiO2 (e and f). | ||
The crystal structure of Fe3O4 was characterized by XRD. The X-ray diffraction pattern of Fe3O4 nanoparticles prepared via the solvothermal method exhibited six typical diffraction peaks corresponding to (220), (311), (400), (422), (511) and (440) planes. As shown in Fig. 2A, six peaks were observed by analyzing the Fe3O4, Fe3O4@mSiO2 and Fe3O4@mSiO2–DODGA nanoparticles, which indicated that the crystal structure of the magnetite core was not changed by coating with the SiO2 or mesoporous silica layer or chemical modification with DODGA.
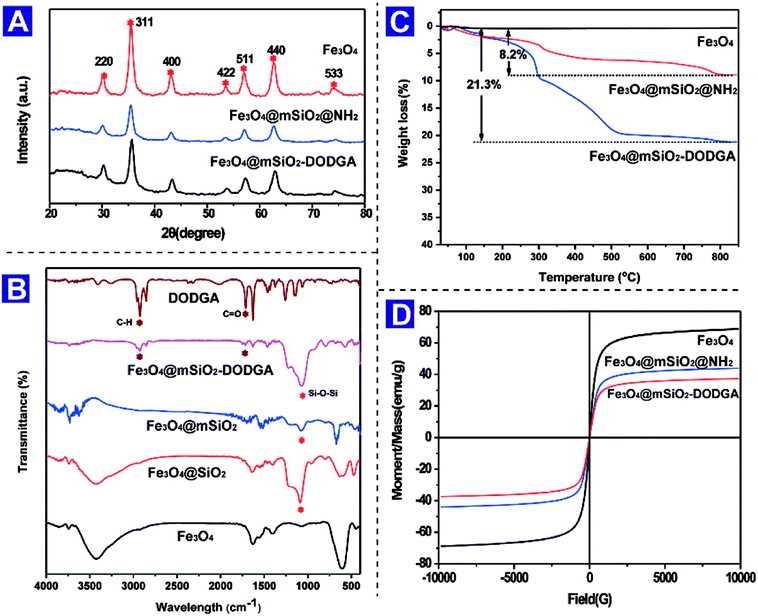 | ||
| Fig. 2 XRD patterns (A), FT-IR spectra (B), TGA curves (C) and VSM curves (D) of Fe3O4 nanoparticles. | ||
To characterize the chemical compositions of the bare Fe3O4 nanoparticles, SiO2- and mesoporous silica-coated Fe3O4 nanoparticles, and DODGA-modified Fe3O4 nanoparticles, their FT-IR spectra were recorded, as shown in Fig. 2B. Firstly, an absorption band at 606 cm−1 attributed to the characteristic stretching vibrations of Fe–O bonds in Fe3O4 appeared in the spectra of these nanoparticles, which indicated that the chemical structure of Fe3O4 was not changed by chemical modification. Owing to the coatings of SiO2 and mesoporous silica layers on the surface of the bare Fe3O4 nanoparticles, the strength of the Fe–O stretching band underwent a relative decrease. Secondly, after the SiO2 layer was coated, peaks appeared at 1089 cm−1, which were attributed to the stretching vibrations of Si–O–Si bonds. Thirdly, after the final modification with DODGA, the appearance of two new peaks at 1730 cm−1 and 2955 cm−1 confirmed that DODGA was successfully covalently bonded to the surface of Fe3O4@mSiO2, and these were attributed to the stretching vibrations of C![[double bond, length as m-dash]](https://www.rsc.org/images/entities/char_e001.gif) O and C–H bonds.
O and C–H bonds.
To quantify the DODGA present on the chemically modified Fe3O4 nanoparticles, thermogravimetric analysis was used to estimate the content of DGA ligands. As shown in Fig. 2C, in the TGA curves of Fe3O4@mSiO2, Fe3O4@mSiO2@NH2 and Fe3O4@mSiO2–DODGA in the temperature range of 30–750 °C there was an obvious change in the loss of mass from Fe3O4@mSiO2–DODGA. Owing to the physical adsorption of water by Fe3O4@mSiO2, there was a slight mass loss during the heating process. At 750 °C, the weight loss for Fe3O4@mSiO2 was 0.31 wt%. After the modification with amino groups and DODGA ligands of the surface of the magnetic nanoparticles, an obvious weight loss was detected. DODGA on the nanoparticles began to decompose thermally at about 200 °C. This process did not stop until the temperature reached 500 °C. Finally, the weight loss for Fe3O4@mSiO2–DODGA at 750 °C reached 21.3%, whereas the weight loss for Fe3O4@mSiO2@NH2 was 8.2%. According to the results of the TGA analysis, the weight percentage of DODGA on the modified nanoparticles was about 13.1%, which indicated that the content of the DODGA ligand on the modified adsorbent was approximately 367 μmol g−1.
The magnetic properties of magnetic nanoparticles are an important aspect of their properties and ensure the rapid separation of adsorbents from a complex matrix. VSM was utilized to investigate the magnetic properties of Fe3O4, Fe3O4@mSiO2 and Fe3O4@mSiO2–DODGA nanoparticles. As shown in Fig. 2D, because it was coated with SiO2 and DODGA layers the saturation magnetization of Fe3O4 decreased from the initial value of 58.5 emu g−1 to 37.3 emu g−1. This result for the magnetic response of Fe3O4@mSiO2–DODGA nanoparticles showed that they still possessed high magnetization and could be rapidly and completely separated from the mixture by an external magnetic field within 30 s. These three kinds of nanoparticle displayed no magnetic hysteresis and exhibited superparamagnetic behaviour, which made them disperse homogeneously without an external magnet and aggregate quickly in the presence of a magnet during practical applications.
3.2 Adsorption experiments
The material, namely, Fe3O4@mSiO2–DODGA, that was prepared and used in this study displayed some advantages over former materials. Firstly, magnetic Fe3O4 particles were chosen as the inner supporting core. Their excellent superparamagnetic characteristics were beneficial for their rapid collection from real samples. Secondly, the nanosized dimensions of this material guaranteed a large specific surface area for chemical modification for further anchoring the functional ligand DODGA. Thirdly, DODGA, which has a high coordination ability for REEs, was chemically bonded to the Fe3O4 particles to create a bifunctional adsorbent.The adsorption rate (AR%) was calculated by:
| AR% = (C0 − Ce) × 100/C0 |
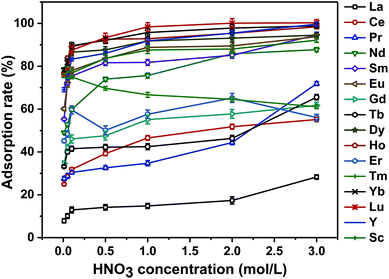
The adsorption results are shown in Fig. 3. When the concentration of the HNO3 solution was 0.01 mol L−1, the adsorbent displayed different adsorption capabilities for all 16 REEs. All the adsorption rates for each REE were low. With an increase in the concentration of the HNO3 solution, the adsorption rates for 15 REEs, other than Tm, all increased. The adsorption rates of Fe3O4@mSiO2–DODGA for 9 REEs (namely, Nd, Sm, Eu, Dy, Ho, Yb, Lu, Y and Sc) exceeded 80% when the concentration of the HNO3 solution was 1.0 mol L−1. However, when the concentration of nitric acid was increased to 3.0 mol L−1, the increase in the adsorption rate of the Fe3O4@mSiO2–DODGA nanoparticles for 9 rare earth elements was not obvious. During the adsorption procedure, a high concentration of HNO3 could potentially cause damage to instruments. Therefore, a 2.0 mol L−1 HNO3 solution was used in the following adsorption experiments. In these conditions, the adsorption rates for all 16 rare earth elements ranged from 17.3% to 100.1% (Table 1). Among these elements, the adsorption rates for Nd, Sm, Eu, Dy, Ho, Yb, Lu, Y and Sc ranged from 85.12% to 100.10%.
| Element | AR (%) | DR (%) | Element | AR (%) | DR (%) |
|---|---|---|---|---|---|
| La | 17 | 17 | Dy | 93 | 67 |
| Ce | 52 | 94 | Ho | 95 | 98 |
| Pr | 44 | 45 | Er | 65 | 48 |
| Nd | 86 | 88 | Tm | 65 | 83 |
| Sm | 85 | 96 | Yb | 98 | 98 |
| Eu | 90 | 93 | Lu | 100 | 100 |
| Gd | 58 | 64 | Y | 95 | 99 |
| Tb | 46 | 43 | Sc | 88 | 93 |
Moreover, the ligand has two carbonyl groups and an ether bond of which the oxygen atoms donate electrons to REE ions. It has been reported that47 nitrogen donor ligands have higher coordination affinities for trivalent actinide ions in comparison with trivalent lanthanide ions. The adsorption results shown in Table 1 are in agreement with the above conclusion. Furthermore, according to the literature48,49 cited in the above research article, DODGA exhibited different adsorption behaviour for REEs when it was used in liquid–liquid extraction. As the functional ligand for the adsorption of REEs, the anchoring of DODGA on Fe3O4@mSiO2–DODGA made it display the same adsorption properties. The difference in the amount of each REE adsorbed by Fe3O4@mSiO2–DODGA proved the above conclusion. Moreover, when each REE had the same concentration in the solution, the adsorption behaviour of each REE on Fe3O4@mSiO2–DODGA was competitive. In particular, if the same amount of Fe3O4@mSiO2–DODGA was used for adsorption, the amount of each REE adsorbed was different.
The desorption rate (DR%) was calculated by:
| DR% = Cd × 100/(C0 − Ce) |
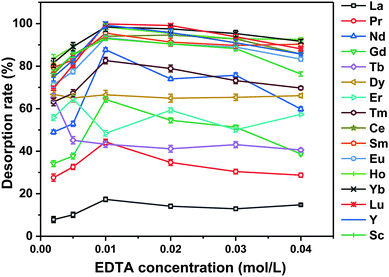
As shown in Fig. 4, when the concentration of EDTA was 0.01 mol L−1 the desorption rate for each REE ion reached its maximum value. The desorption rates for some REEs (namely, Nd, Ce, Sm, Eu, Ho, Yb, Lu, Y, and Sc) were greater than 85% (Table 1). When the concentration of EDTA continued to increase, the desorption rates for the REEs decreased. Therefore, 0.01 mol L−1 EDTA was selected as the optimal concentration in the following experiments.
| Element | Adsorption rate (%) | |||
|---|---|---|---|---|
| 1 | 2 | 3 | 4 | |
| La | 99 | 95 | 92 | 90 |
| Ce | 100 | 95 | 92 | 89 |
| Pr | 99 | 95 | 92 | 90 |
| Nd | 100 | 97 | 94 | 93 |
| Sm | 100 | 95 | 92 | 89 |
| Eu | 99 | 96 | 92 | 90 |
| Gd | 99 | 95 | 92 | 89 |
| Tb | 99 | 93 | 90 | 89 |
| Dy | 100 | 96 | 92 | 89 |
| Ho | 100 | 95 | 92 | 90 |
| Er | 99 | 94 | 90 | 88 |
| Tm | 99 | 96 | 93 | 91 |
| Yb | 99 | 96 | 94 | 91 |
| Lu | 100 | 95 | 92 | 89 |
| Y | 99 | 95 | 93 | 91 |
| Sc | 100 | 96 | 93 | 92 |
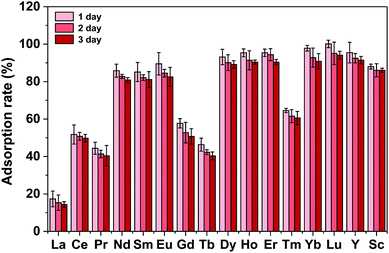
Several kinds of material used for recycling REEs are listed in Table S10.† The materials prepared with magnetic particles as the inner core and a functional ligand are usually employed for recycling one or two kinds of REE ion. After being used for 5 or more cycles, these materials still exhibited high adsorption abilities for REE ions, whereas Fe3O4@mSiO2–DODGA displayed great advantages over these materials.
| Coexisting ion | Tolerance limit mg L−1 | Tolerance limit mg L−1 | Tolerance limit mg L−1 | Tolerance limit mg L−1 |
|---|---|---|---|---|
| K+ | 5000 | 200 | — | — |
| Na+ | 5000 | 200 | — | 1610 |
| Ca2+ | 2000 | — | 5 | 200 |
| Mg2+ | 2000 | — | — | 120 |
| Fe3+ | 50 | — | 5 | — |
| Co2+ | 50 | — | 5 | — |
| Ni2+ | 50 | 50 | — | — |
| Al3+ | 150 | — | — | 135 |
| Zn2+ | 100 | — | — | — |
| Cu2+ | 50 | 50 | — | — |
| Ag+ | 100 | 67 | 5 | — |
| SO42− | 2000 | — | — | 500 |
| Cl− | 5000 | — | — | 200 |
| NO3− | 12![[thin space (1/6-em)]](https://www.rsc.org/images/entities/char_2009.gif) 000 000 |
— | — | 200 |
| HPO42− | 2000 | — | — | 500 |
| Reference | This work | 18 | 19 | 23 |
The adsorption rate of a material for REEs is commonly considered to be an important criterion for evaluating potential applications of the adsorbent. The adsorption capacity (Q, mg g−1) and the equilibrium adsorption capacity (Qe, mg g−1) were calculated according to the following equation:
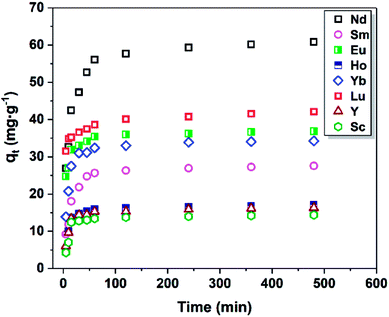
As shown in Fig. 6, the adsorption of REEs by Fe3O4@mSiO2–DODGA could reach adsorption equilibrium in 100 min. It could be calculated that the maximum adsorption capacity of Fe3O4@mSiO2–DODGA was 60.80, 27.54, 36.86, 17.16, 34.36, 42.15, 16.29, and 14.28 mg g−1 for Nd, Sm, Eu, Ho, Yb, Lu, Y, and Sc, respectively.
On the basis of the data that were obtained, four kinetic models were used to analyze the adsorption behaviour of Fe3O4@mSiO2–DODGA for the 8 REEs. According to the equations in Table 4, the original data were processed and fitted. The corresponding kinetic constants, equilibrium capacities, and correlation coefficients of each adsorption kinetics model are listed in Tables 5 and 6, and the kinetic model equations are listed in the ESI (Tables S1–S4†).
| Kinetic model | Equation | Parameter | |
|---|---|---|---|
| Pseudo-first-order37 | qt = qe(1 − e−k1t) | qe (mg g−1) | Amount of REEs adsorbed at equilibrium time |
| k1 (min−1) | Pseudo-first-order reaction rate constant | ||
| Pseudo-second-order38 |  |
k2 (g mg−1 min−1) | Pseudo-second-order reaction rate constant |
| Intra-particle diffusion39 |  |
ki (mg g−1 min−1/2) | Intra-particle diffusion rate constant |
| C | Boundary layer diffusion effect | ||
| Elovich40 |  |
α (mg g−1 min−1) | Initial adsorption rate constant |
| β (mg g−1 min−1) | Parameter related to the surface coverage of the adsorbent |
| Element | Pseudo-first-order | Pseudo-second-order | ||||
|---|---|---|---|---|---|---|
| R2 | qe (mg g−1) | k1 (min−1) | R2 | qe (mg g−1) | k2 (g mg−1 min−1) | |
| Nd | 0.9000 | 57.36 | 0.0891 | 0.9997 | 61.76 | 282.73 |
| Sm | 0.9755 | 26.65 | 0.0665 | 0.9998 | 28.01 | 123.03 |
| Eu | 0.7948 | 35.39 | 0.1882 | 1.0000 | 37.04 | 56.79 |
| Ho | 0.9561 | 16.43 | 0.0927 | 0.9997 | 17.30 | 61.47 |
| Yb | 0.9761 | 33.16 | 0.1052 | 0.9999 | 34.60 | 90.69 |
| Lu | 0.5491 | 39.29 | 0.2851 | 0.9998 | 42.19 | 84.57 |
| Y | 0.9592 | 15.61 | 0.1032 | 0.9999 | 16.45 | 51.42 |
| Sc | 0.9106 | 13.85 | 0.0881 | 0.9997 | 14.56 | 53.58 |
| Element | Intra-particle diffusion | Elovich | ||||
|---|---|---|---|---|---|---|
| R2 | ki (mg g−1 min−1/2) | C | R2 | α (mg g−1 min−1) | β (mg g−1 min−1) | |
| Nd | 0.6592 | 1.4109 | 35.99 | 0.9612 | 45.6711 | 0.03711 |
| Sm | 0.5851 | 0.7398 | 14.79 | 0.9266 | 17.5533 | 0.06792 |
| Eu | 0.5898 | 0.4675 | 28.68 | 0.9298 | 89.1700 | 0.10771 |
| Ho | 0.4838 | 0.3864 | 10.43 | 0.8744 | 12.38142 | 0.12171 |
| Yb | 0.5001 | 0.6897 | 22.53 | 0.8899 | 29.0774 | 0.06873 |
| Lu | 0.8311 | 0.4466 | 33.57 | 0.9867 | 284.1745 | 0.12994 |
| Y | 0.4985 | 0.3384 | 10.42 | 0.8782 | 13.1118 | 0.14076 |
| Sc | 0.4386 | 0.3277 | 8.76 | 0.8181 | 13.0943 | 0.14125 |
Kinetics plots were obtained by taking Nd as a representative element and are shown in Fig. 7. The pseudo-first-order kinetic model and pseudo-second-order model indicated that adsorption was determined by diffusion and chemical adsorption, respectively. Because the value of R2 of the pseudo-second-order model for each REE was 0.999, this model was a better fit than the pseudo-first-order kinetic model. This result indicated that the adsorption of the 8 REEs on the Fe3O4@mSiO2–DODGA nanoparticles mainly occurred in two ways, i.e., physical and chemical adsorption. Chemical adsorption determined the adsorption process.
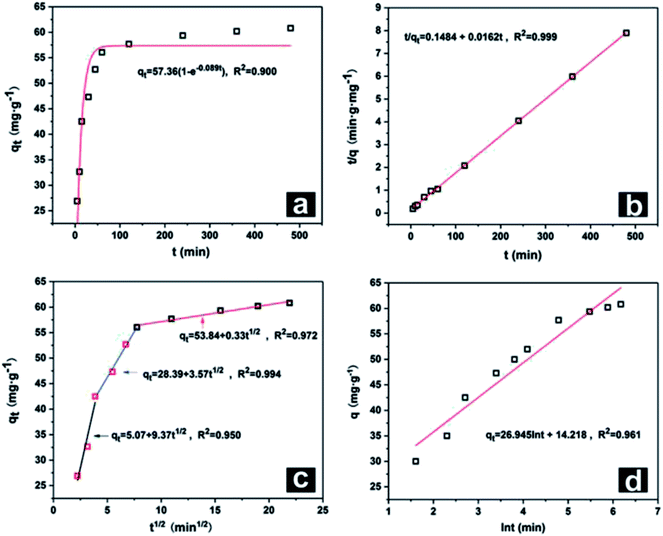 | ||
| Fig. 7 Kinetic plots for Nd as a representative element: (a) pseudo-first-order, (b) pseudo-second-order, (c) intra-particle diffusion, and (d) Elovich models. | ||
After data processing according to the intra-particle diffusion kinetic model, the plot displayed three typical linear relationships. Each linear relationship corresponded to a stage of the adsorption process. The first stage was surface diffusion, which explained the diffusion of REEs from the solution to the surface of Fe3O4@mSiO2–DODGA. The second stage was intra-particle diffusion of REEs between the Fe3O4@mSiO2–DODGA nanoparticles. The third stage was retention of the adsorbate on the active sites, which was considered to be a stage of instantaneous entrapment. This stage could be regarded as negligible.
The Elovich model was used to describe the adsorption process on the surface of a non-uniform solid, which was based on the theoretical assumption that adsorption increased exponentially with the number of adsorption sites, which described the kinetics of a chemical adsorption process. The value of R2 of this model was about 0.900, which indicated that the adsorption process of REEs tended to comprise chemical adsorption on an uneven surface, which was consistent with the structural characteristics of the mesoporous layer of nanoparticles.
The adsorption capacity of Fe3O4@mSiO2–DODGA for REEs was mainly reflected by the adsorbed amount. The total amount of REEs adsorbed by the material was 249.44 mg g−1 (Table 7). The highest adsorbed amount for a single REE was 60.8 mg g−1 for Nd(III), which was close to the reported amount.28 Other reported magnetic nanomaterials were used for the adsorption of single rare earth elements, usually Eu or Ce. In this study, the diglycolamide ligand was used to modify the magnetic nanomaterials for the further investigation of the adsorption properties for all 16 REEs and the adsorption kinetics of 8 REEs. The maximum adsorption capacities (Qmax) for 8 REEs of Fe3O4@mSiO2–DODGA in a 2 mol L−1 nitric acid solution are listed in Table 7. As shown, Qmax for Eu(III) was 36.86 mg g−1. This value is higher than those of a series of adsorbent materials such as an Fe3O4/sepiolite composite,21 Fe3O4@CD-MCs22 and Fe3O4@HA-MNPs.23 Fe3O4@mSiO2–DODGA could be used as an effective adsorbent for the adsorption of REEs.
| MSPE material | Element | Qmax (mg g−1) | Reference |
|---|---|---|---|
| SBA-15-BSEA-Fe3O4-NPs | Ce(III) | 49.00 | 18 |
| Fe3O4@SBA-15-Ce(III)-IIP | Ce(III) | 87.42 | 19 |
| Fe3O4@CMC | Eu(III) | 42.24 | 20 |
| Fe3O4/sepiolite | Eu(III) | 30.85 | 21 |
| Fe3O4@CD-MCs | Eu(III) | 12.69 | 22 |
| Fe3O4@HA-MNPs | Eu(III) | 10.56 | 23 |
| Fe@CS-DGA | Pb(II) | 70.57 | 28 |
| Fe3O4@MC-DGA | Am(III) | — | 29 |
| Fe3O4@TODGA | Am(III) | — | 30 |
| Pu(IV) | — | ||
| Fe3O4@mSiO2–DODGA | Nd(III) | 60.80 | This work |
| Sm(III) | 27.54 | ||
| Eu(III) | 36.86 | ||
| Ho(III) | 17.16 | ||
| Yb(III) | 34.36 | ||
| Lu(III) | 42.15 | ||
| Y(III) | 16.29 | ||
| Sc(III) | 14.28 |
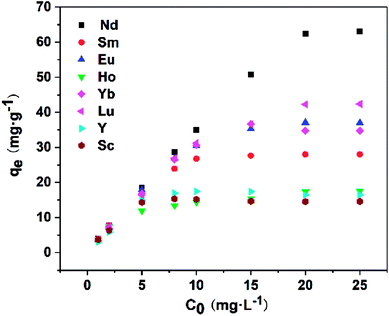
As shown in Fig. 8, the equilibrium adsorption capacity of Fe3O4@mSiO2–DODGA for REEs increased markedly with an increase in the initial REE concentration. When the concentration of REEs was 20 mg L−1, the adsorption capacity reached its maximum value. This result indicated that the main driving force generated by the initial concentration of REEs could significantly affect the mass transfer of REEs from the solution to the surface of Fe3O4@mSiO2–DODGA. Therefore, four kinds of adsorption model (Table 8, namely, Langmuir, Freundlich, Dubinin-Radushkevich (D-R) and Temkin) were utilized to quantify the adsorption capacity and investigate the specific adsorption characteristics of Fe3O4@mSiO2–DODGA. The constants, parameters, and correlation coefficients of the 4 adsorption models are listed in Tables 9 and 10, and the kinetic model equations are listed in the ESI (Tables S5–S8†).
| Isotherm model | Equation | Parameters | |
|---|---|---|---|
| Langmuir41 |  |
KL (L mg−1) | Constant related to the free energy of adsorption |
| Qm (mg g−1) | Langmuir monolayer adsorption capacity | ||
| Freundlich42 |  |
Kf | Constant indicative of the relative sorption capacity |
| n | Constant indicative of the heterogeneity factor | ||
| D-R43 | ln![[thin space (1/6-em)]](https://www.rsc.org/images/entities/char_2009.gif) Qe = ln Qe = ln![[thin space (1/6-em)]](https://www.rsc.org/images/entities/char_2009.gif) Qm − βε2 Qm − βε2 |
Qm (mg g−1) | Maximum adsorption capacity in D-R model |
| β (mol2 J−2) | Constant related to the adsorption energy | ||
| Temkin44 | Qe = BT![[thin space (1/6-em)]](https://www.rsc.org/images/entities/char_2009.gif) ln ln![[thin space (1/6-em)]](https://www.rsc.org/images/entities/char_2009.gif) KT + BT KT + BT![[thin space (1/6-em)]](https://www.rsc.org/images/entities/char_2009.gif) ln ln![[thin space (1/6-em)]](https://www.rsc.org/images/entities/char_2009.gif) Ce Ce |
BT = (RT)/bT | Constant related to the heat of adsorption |
| KT (L g−1) | Polanyi potential, Temkin equilibrium binding constant |
| Element | Langmuir | Freundlich | ||||
|---|---|---|---|---|---|---|
| R2 | Qmax (mg g−1) | KL (L mg−1) | R2 | Kf | n | |
| Nd | 0.9327 | 68.96 | 1.33 | 0.9972 | 31.79 | 2.18 |
| Sm | 0.9987 | 28.57 | 3.43 | 0.9366 | 16.31 | 3.40 |
| Eu | 0.9981 | 40.16 | 1.18 | 0.9838 | 26.21 | 6.48 |
| Ho | 0.9892 | 17.27 | 1.31 | 0.9950 | 10.27 | 5.53 |
| Yb | 0.9911 | 38.75 | 1.09 | 0.9828 | 18.55 | 1.29 |
| Lu | 0.9900 | 45.45 | 0.99 | 0.9444 | 17.60 | 2.06 |
| Y | 0.9919 | 17.60 | 1.78 | 0.9025 | 8.83 | 1.52 |
| Sc | 0.9983 | 14.83 | 6.41 | 0.9429 | 9.87 | 2.52 |
| Element | Temkin | D-R | ||||
|---|---|---|---|---|---|---|
| R2 | BT | KT (L g−1) | R2 | β (mol2 J−2) | E (kJ mol −1) | |
| Nd | 0.8545 | 9.08 | 63.97 | 0.9543 | 8.001 × 10⁻⁹ | 15.81 |
| Sm | 0.9702 | 3.89 | 153.23 | 0.9574 | 1.137 × 10⁻⁸ | 13.26 |
| Eu | 0.9665 | 7.73 | 16.24 | 0.9530 | 2.801 × 10⁻⁸ | 8.45 |
| Ho | 0.9805 | 2.24 | 101.69 | 0.9603 | 1.200 × 10⁻⁸ | 12.91 |
| Yb | 0.9395 | 8.06 | 12.33 | 0.9578 | 3.197 × 10⁻⁸ | 7.91 |
| Lu | 0.9650 | 7.91 | 18.79 | 0.9569 | 2.000 × 10⁻⁸ | 10.00 |
| Y | 0.8066 | 3.48 | 17.40 | 0.9555 | 4.001 × 10⁻⁸ | 7.07 |
| Sc | 0.8240 | 2.30 | 82.71 | 0.9666 | 1.600 × 10⁻⁸ | 11.18 |
Upon comparing the R2 values of the Langmuir and Freundlich models (Fig. 9), it was obvious that the adsorption data were more suitable for fitting with the Langmuir isotherm model than with the Freundlich isotherm model, which demonstrated that the adsorption of REEs by Fe3O4@mSiO2–DODGA comprised single-layer adsorption. Furthermore, the Langmuir dimensionless separation factor RL was used to predict the affinity between Fe3O4@mSiO2–DODGA and REEs:
| RL = 1/(1 + KLC0) |
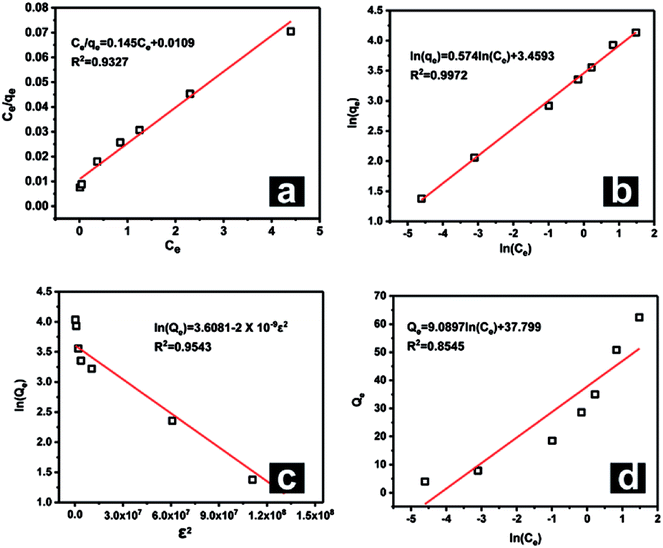 | ||
| Fig. 9 Adsorption model plots for Nd as a representative element: (a) Langmuir, (b) Freundlich, (c) Temkin, and (d) D-R models. | ||
The KL values for each REE are listed in Table S5.† Because all the KL values for the 8 REEs were positive, all the RL values were in the range of 0–1 for all the tested REE concentrations, which indicated that the adsorption process for each REE on Fe3O4@mSiO2–DODGA was favorable.
When the data were fitted with the D-R model, the E values were obtained from this model to explain that the adsorption process was mainly dominated by chemical ion exchange or physical forces.45,46 The E values for Yb and Y were less than 8 kJ mol−1, which indicated that physical forces dominated the adsorption mechanism. The E values for the other REEs were greater than 8 kJ mol−1, which suggested that chemical ion exchange was the major adsorption mechanism.
Otherwise, the Temkin isotherm model was used to process the data. The R2 values were all greater than 0.95. This result indicated that the binding energy distribution for each REE during the adsorption process was homogeneous. This was in agreement with the conclusion drawn from the Langmuir model.
4. Conclusions
In this study, magnetic mesoporous nanoparticles functionalized with the REE-adsorbing ligand DODGA were prepared. The nanoparticles of Fe3O4@mSiO2–DODGA that were obtained were characterized by the corresponding techniques. The results showed that Fe3O4@mSiO2–DODGA had a nanosized spherical shape and mesoporous structure, and the content of the DODGA ligand was about 367 μmol g−1. Moreover, the adsorption performance for 16 rare earth ions was measured using Fe3O4@mSiO2–DODGA as an adsorbent. In 2 mol L−1 HNO3, the adsorption rate for the 16 rare earth ions reached its maximum value. A 0.01 mol L−1 EDTA solution was selected as the eluent to make the rare earth ions adsorbed on Fe3O4@mSiO2–DODGA undergo effective desorption. The nanoparticles were stable in 2 mol L−1 nitric acid and could be reused 5 times. Moreover, the Fe3O4@mSiO2–DODGA nanoparticles had excellent anti-interference ability and the potential to adsorb rare earth ions in complex samples. The adsorption kinetics and adsorption isotherms of 8 rare earth ions that exhibited good performance in the adsorption and desorption experiments were investigated. An analysis of the kinetic model and adsorption isotherms indicated that the adsorption process of REEs by Fe3O4@mSiO2–DODGA comprised single-layer adsorption via two ways, namely, physical forces and chemical adsorption. The adsorption process was controlled by chemical adsorption and also the synergistic effect of diffusion. The Fe3O4@mSiO2–DODGA nanoparticles showed great potential for applications in the adsorption of REEs in high-salinity media.Conflicts of interest
There are no conflicts to declare.Acknowledgements
This work was financially supported by the National Key R&D Program of China (No. 2017YFB0702100) and the Major Science and Technology Program for Water Pollution Control and Treatment (No. 2017ZX07402001).References
- S. Yasuoka, J. Ishida, K. Kishida and H. Inui, J. Power Sources, 2017, 346, 56–62 CrossRef CAS.
- X. Cao, L. Chen, S. Guo, F. Fan, R. Chen and A. Yan, Scr. Mater., 2017, 131, 24–28 CrossRef CAS.
- G. G. Peng, D. Y. Zheng, C. Cheng, J. Zhang and H. Zhang, J. Alloys Compd., 2017, 693, 1250–1256 CrossRef CAS.
- A. Rout and K. Binnemans, Dalton Trans., 2014, 43, 1862–1872 RSC.
- T. V. Hoogerstraete and K. Binnemans, Green Chem., 2014, 16, 1594–1606 RSC.
- A. Bhattacharyya, P. K. Mohapatra, T. Gadly, D. R. Raut, S. K. Ghosh and V. K. Manchanda, J. Hazard. Mater., 2011, 1951, 238–244 CrossRef PubMed.
- B. Srivastava, M. K. Barman, M. Chatterjee, D. Roy and B. Mandal, J. Chromatogr. A, 2016, 1451, 1–14 CrossRef CAS PubMed.
- X. Chen, Q. Chen, F. Guo, Y. Liao and Z. Zhao, Hydrometallurgy, 2018, 175, 326–332 CrossRef CAS.
- X. W. Huang, J. S. Dong, L. S. Wang, Z. Y. Zong, Q. N. Xue and X. L. Meng, Green Chem., 2017, 19, 1345–1352 RSC.
- J. Liu, K. Huang, X. Wu, W. Liu, W. Song and H. Liu, Hydrometallurgy, 2018, 175, 340–347 CrossRef CAS.
- M. K. Jha, A. Kumari, R. Panda, J. R. Kumar, K. Yoo and Y. L. Jin, Hydrometallurgy, 2016, 165, 2–26 CrossRef CAS.
- D. Li, S. Egodawatte, D. I. Kaplan, S. C. Larsen, S. M. Serkiz and J. C. Seaman, J. Hazard. Mater., 2016, 317, 494–502 CrossRef CAS PubMed.
- D. Xiao, P. Dramou, N. Xiong, H. He, H. Li, D. Yuan and H. Dai, J. Chromatogr. A, 2013, 1274, 44–53 CrossRef CAS PubMed.
- Q. L. Fang, S. D. Duan, J. F. Zhang, J. X. Li and K. C. F. Leung, J. Mater. Chem. A, 2017, 5, 2947–2958 RSC.
- J. J. Wang and J. Wei, J. Mater. Chem. A, 2017, 5, 4651–4659 RSC.
- R. Zhou, N. F. Shen, J. Zhao, Y. Su and H. J. Ren, J. Mater. Chem. A, 2018, 6, 1275–1283 RSC.
- J. Xu, Z. Cao, X. Liu, H. Zhao, X. Xiao, J. P. Wu, X. H. Xu and J. L. Zhou, J. Hazard. Mater., 2016, 317, 656–666 CrossRef CAS PubMed.
- K. Dashtian and R. Zaredorabei, J. Colloid Interface Sci., 2017, 494, 114–123 CrossRef CAS PubMed.
- Y. Liu, J. Qiu, Y. H. Jiang, Z. C. Liu, M. J. Meng, L. Ni, C. C. Qin and J. B. Peng, Microporous Mesoporous Mater., 2016, 234, 176–185 CrossRef CAS.
- Y. W. Cai, F. Yuan, X. M. Wang, Z. Sun, Y. Chen, Z. Y. Liu, X. K. Wang, S. T. Yang and S. A. Wang, Cellulose, 2016, 24, 1–16 Search PubMed.
- S. M. Yu, X. G. Liu, G. J. Xu, Y. Qiu and L. L. Cheng, Desalin. Water Treat., 2015, 57, 1–12 Search PubMed.
- Z. Q. Guo, Y. Li, S. H. Pan and J. Z. Xu, J. Mol. Liq., 2015, 206, 272–277 CrossRef CAS.
- S. T. Yang, P. F. Zong, X. M. Ren, Q. Wang and X. K. Wang, ACS Appl. Mater. Interfaces, 2012, 4, 6891–6900 CrossRef CAS PubMed.
- E. A. Mowafy and D. Mohamed, Sep. Purif. Technol., 2014, 128, 18–24 CrossRef CAS.
- K. Shimojo, K. Kurahashi and H. Naganawa, Extraction behavior of lanthanides using a diglycolamide derivative TODGA in ionic liquids, Dalton Trans., 2008, 252, 5083–5088 RSC.
- F. K. Li, A. J. Gong, L. N. Qiu, W. W. Zhang, J. R. Li, Y. Liu, Y. N. Liu and H. T. Yuan, PLoS One, 2017, 12, e0185302 CrossRef PubMed.
- H. T. Yuan, W. X. Hong, Y. S. Zhou, B. S. Pu, A. J. Gong, T. Xu, Q. S. Yang, F. K. Li, L. N. Qiu, W. W. Zhang and Y. N. Liu, J. Rare Earths, 2018, 336, 624–627 Search PubMed.
- R. X. Bai, Y. Zhang, Z. G. Zhao, Q. X. Liao, P. Chen, P. P. Zhao, W. H. Guo, F. Yang and L. C. Li, J. Ind. Eng. Chem., 2018, 59, 416–424 CrossRef CAS.
- S. Ojha, S. Chappa, A. M. Mhatre, K. K. Singh, V. Chavan and A. K. Pandey, J. Radioanal. Nucl. Chem., 2017, 312, 675–683 CrossRef CAS.
- V. Chavan, V. Thekkethil, A. K. Pandey, M. Iqbal, J. Huskens, S. S. Meena, A. Goswami and W. Verboom, React. Funct. Polym., 2014, 74, 52–57 CrossRef CAS.
- S. W. Cao, Y. J. Zhu and J. Chang, New J. Chem., 2008, 32, 1526–1530 RSC.
- D. Liu, Y. Li, J. Deng and W. Yang, React. Funct. Polym., 2011, 71, 1040–1044 CrossRef CAS.
- J. P. Yang, F. Zhang, Y. R. Chen, S. Qian, P. Hu, W. Li, Y. H. Deng, Y. Fang, L. Han, M. Luqman and D. Y. Zhao, Chem. Commun., 2011, 47, 11618–11620 RSC.
- Y. H. He, Y. Y. Huang, Y. L. Jin, X. J. Liu, G. Q. Liu and R. Zhao, ACS Appl. Mater. Interfaces, 2014, 6, 9634–9642 CrossRef CAS PubMed.
- G. Kantin, E. Chupakhin, D. Dar'in and M. Krasavin, Tetrahedron Lett., 2017, 58, 3160–3163 CrossRef CAS.
- M. Bessodes and N. Mignet, Nanotechnology for Nucleic Acid Delivery, 2013, vol. 948, pp. 67–84 Search PubMed.
- N. A. Oladoja, C. O. Aboluwoye and Y. B. Oladimeji, Turk. J. Eng. Environ. Sci., 2008, 32, 303–312 CAS.
- Y. S. Ho and G. McKay, Sorption of dye from aqueous solution by peat, Chem. Eng. J., 1998, 70, 115–124 CrossRef CAS.
- M. K. Sureshkumar, D. Das, M. B. Mallia and P. C. Gupta, J. Hazard. Mater., 2010, 184, 65–72 CrossRef CAS PubMed.
- S. H. Chein and W. R. Clayton, Soil Sci. Soc. Am. J., 1980, 44, 265–268 CrossRef.
- E. Repo, J. K. Warchol, T. A. Kurniawan and M. E. T. Sillanpää, Chem. Eng. J., 2010, 161, 73–82 CrossRef CAS.
- M. Jain, V. K. Garg and K. Kadirvelu, J. Hazard. Mater., 2009, 162, 365–372 CrossRef CAS PubMed.
- X. J. Hu, J. S. Wang, Y. G. Liu, X. Li, G. M. Zeng, Z. L. Bao, X. X. Zeng, A. W. Chen and F. Long, J. Hazard. Mater., 2011, 185, 306–314 CrossRef CAS PubMed.
- A. Sari and M. Tuzen, J. Hazard. Mater., 2009, 164, 1004–1011 CrossRef CAS PubMed.
- S. Ricodel, S. Tahaa, I. Cisseb and G. Dorange, Sep. Purif. Technol., 2001, 24, 389–401 CrossRef.
- M. Arias, M. T. Barral and J. C. Mejuto, Chemosphere, 2002, 48, 1081–1088 CrossRef CAS PubMed.
- E. A. Mowafy and D. Mohamed, Sep. Purif. Technol., 2014, 128, 18–24 CrossRef CAS.
- E. A. Mowafy and H. F. Aly, Solvent Extr. Ion Exch., 2006, 24, 677–692 CrossRef CAS.
- S. A. Ansari, P. K. Mohapatra, D. R. Raut, V. C. Adya, S. K. Thulasidas and V. K. Manchanda, Sep. Purif. Technol., 2008, 63, 239–242 CrossRef CAS.
Footnote |
| † Electronic supplementary information (ESI) available. See DOI: 10.1039/c8ra07762b |
| This journal is © The Royal Society of Chemistry 2018 |

