 Open Access Article
Color-tunable photoluminescence and energy transfer of (Tb1−xMnx)3Al2(Al1−xSix)3O12:Ce3+ solid solutions for white light emitting diodes
Tianchun Langab,
Tao Han *a,
Cong Zhaoa,
Shixiu Caoa,
Shuangqiang Fangb,
Shuai Lib,
Lei Zhaoc,
Vladimir I. Korepanovb and
Alexey N. Yakovlevb
aResearch Institute for New Materials Technology, Chongqing University of Arts and Sciences, Chongqing, 402160, China. E-mail: danbaiht@126.com
bInstitute of High Technology Physics, National Research Tomsk Polytechnic University, Tomsk, 634050, Russia
cSchool of Physics and Opto-Electronic Technology, Baoji University of Arts and Sciences, Baoji, Shaanxi 721016, P. R. China
First published on 23rd October 2018
Abstract
(Tb1−xMnx)3Al2(Al1−xSix)3O12:Ce3+ solid solution phosphors were synthesized by introducing the isostructural Mn3Al2(SiO4)3 (MAS) into Tb3Al5O12:Ce3+ (TbAG). Under 456 nm excitation, (Tb1−xMnx)3Al2(Al1−xSix)3O12:Ce3+ shows energy transfers (ET) in the host, which can be obtained from the red emission components to enhance color rendering. Moreover, (Tb1−xMnx)3Al2(Al1−xSix)3O12:Ce3+ (x = 0–0.2) exhibits substantial spectral broadening (68 → 86 nm) due to the 5d → 4f transition of Ce3+ and the 4T1 → 6A1 transition of Mn2+. The efficiency of energy transfer (ηT, Ce3+ → Mn2+) gradually increases with increasing Mn2+ content, and the value reach approximately 32% at x = 0.2. Namely, the different characteristics of luminescence evolution based on the effect of structural variation by substituting the (MnSi)6+ pair for the larger (TbAl)6+ pair. Therefore, with structural evolution, the luminescence of the solid solution phosphors could be tuned from yellow to orange-red, tunable by increasing the content of MAS for the applications of white light emitting diodes (wLED).
Introduction
Nowadays, white light emitting diodes (wLEDs), as new solid state light sources, are currently undergoing rapid development in the field of lighting. They are fabricated with single garnet phosphors (Y3Al5O12:Ce3+) and a blue or near-UV LED chip.1–3 Rare earth (RE)-activated luminescent materials are of sizable interest due to their high efficiency and abundant emissions based on level transitions.4–8 Although yellow phosphors are commercially available, the lack of a sufficient red component in the spectra leads to a low color rendering index (Ra < 0) and high color temperature (7750 K), restricting their wide application in high-quality general lighting, such as indoor lighting.9,10 Hence, to resolve the issue, several promising red-emitting phosphors have been applied to effectively increase the color rendering index. There are red-emitting phosphors with single doped activator ions in the host, such as M2Si5N8:Eu2+ (M = Ca, Sr, Ba), MAlSiN3:Eu2+ (M = Ca, Sr), (Na, K, NH4+)2MF6:Mn4+(M = Ti, Ge, Si, Sn, Ga, Y) and (Ca, Ba, Sr)MF6:Mn4+(M = Ti, Ge, Si).11–17 Moreover, with the co-doped activator ions and the energy transfer among them, most single-phase white light phosphors can be obtained, such as the familiar double-doped Eu2+–Sm3+, Eu2+–Mn2+, Ce3+–Mn2+, and triple-doped Tb3+–Ce3+–Mn3+, Eu2+–Tb3+–Mn2+, and so on.18–24 However, such a method in the single host system full-color emission can be realized by designing the activator ions entering different crystallographic sites.Recently, solid solution phosphors have been widely studied for broadband, color-tunable photoluminescence, which indicates that the regular luminescence can be achieved by changing components of the solid-solution,25,26 including color-tunable, broadband solid solution phosphors Ca1−xLixAl1−xSi1+xN3:Eu2+, (Na1−xCax)(Sc1−xMgx)Si2O6, Ca2+xLa8−x(SiO4)6−x(PO4)xO2:Eu2+ and MgGa2O4–ZnGa2O4:Mn2+,Eu3+ and so on.9,27–29 Namely, the solid solution phosphors, showing gradually controlled blue-yellow zone emission, are obtained by a conventional high-temperature solid-state reaction. However, researchers rarely reported the solid solution phosphors of garnet. Therefore, in the present work, we systematically report synthesis and luminescence properties of color-tunable, broadband (Lu1−xMnx)3Al2(Al1−xSix)3O12 new garnet solid solution phosphors doped with 0.06 mol% Ce3+. The emissions of the solid solution phosphors can be tuned continuously from yellow to orange-red. We researched phase structure and luminescence properties of solid solution phosphors (Tb1−xMnx)3Al2(Al1−xSix)3O12:Ce3+ (x = 0–0.2), and observed that the width at half maximum (FWHM) of the emission band broadens with the increase of the MAS. Meanwhile, the PL spectra of the (Tb1−xMnx)3Al2(Al1−xSix)3O12:Ce3+ phosphors upon blue excitation can yield orange-red emission.
Experimental
Synthetic procedures
The main text of the article should appear here with headings as appropriate. (Tb1−xMnx)3Al2(Al1−xSix)3O12:Ce3+ solid solution phosphors were prepared by conventional solid state reaction method. The raw materials consisted of Tb4O7 (99.99%), CeO2 (99.99%), Al2O3 (A. R.), SiO2 (A. R.) and MnO2 (A. R.) powders. The x value was varied in the range of 0–0.2. The stoichiometric raw materials were mixed and preheated at 1000 °C for 2 h in air, and then the pre-fired products were calcined at 1600 °C for 6 h in a reductive atmosphere (H2 10% + N2 90%). Finally, a series of (Tb1−xMnx)3Al2(Al1−xSix)3O12:Ce3+ solid solutions were obtained with the different percentage of MAS after cooling down to room temperature.Characterization
The crystal structure of samples were analyzed by X-ray diffractometer (XRD, TD-3500, Dandong, China) with Cu Kα radiation (λ = 1.5406 Å). The cathode voltage and tube current were 30 kV and 20 mA, respectively. The Rietveld refinement of the structure of samples was completed by using the General Structure Analysis System (GSAS) package within the CMPR and EXPGUI interface. The photoluminescence emission (PL) and photoluminescence excitation (PLE) spectra were measured by using a fluorescent spectrophotometer (F-7000, Hitachi, Japan) with a 150 W Xe lamp as the excitation light source. The excitation and emission spectra were scanned in a range of 290–530 nm and 480–680 nm, respectively. The morphology of sample was observed using a transmission electron microscopy (TEM) and high-resolution TEM (HRTEM) analyses (JEM-21000, JEOL, Japan). The room temperature fluorescence decay curves were obtained from a spectrofluorometer (Horiba, Jobin-Yvon Tokyo, Japan) using a tunable pulse laser radiation (nano-LED-450 nm) for the excitation.Results and discussion
Crystallization behavior and structure
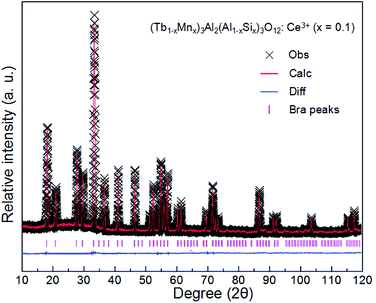
The XRD patterns of (Tb1−xMnx)3Al2(Al1−xSix)3O12:Ce3+ (x = 0–0.2) are showed in Fig. 1a. All the diffraction peaks of samples match well with single-phase TbAG (JCPDF Card no. 17-0735). It is observed that the solid solutions have been synthesized successfully. With an increase of x in (Tb1−xMnx)3Al2(Al1−xSix)3O12:Ce3+, the diffraction peaks shift to larger angles (Fig. 1b). In order to acquire the quantitatively structural evolution of solid solution, the crystallographic data was analyzed by Rietveld refinement. Fig. 2 shows the X-ray Rietveld refinement of (Tb0.9Mn0.1)3Al2(Al0.9Si0.1)3O12:Ce3+ and the refined results of (Tb1−xMnx)3Al2(Al1−xSix)3O12:Ce3+ (x = 0, 0.1, 0.2) were shown in Table 1. The results support that the obtained solid solutions are single-phase structures and belong to the same symmetry and space group Ia![[3 with combining macron]](https://www.rsc.org/images/entities/char_0033_0304.gif) d (230). When x rise from 0 to 0.2, the cell parameters (a/c) decrease from 12.074 Å to 12.034 Å, and the cell volume (V) shrinks from 1760.17 Å3 to 1742.8 Å3.
d (230). When x rise from 0 to 0.2, the cell parameters (a/c) decrease from 12.074 Å to 12.034 Å, and the cell volume (V) shrinks from 1760.17 Å3 to 1742.8 Å3.
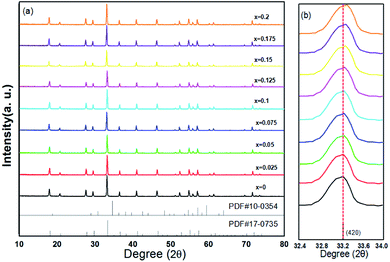 | ||
| Fig. 1 (a) XRD patterns of (Tb1−xMnx)3Al2(Al1−xSix)3O12:Ce3+ (x = 0–0.2) and (b) enlarged XRD patterns within the range of 32.4–34.0°. | ||
| X = 0 | X = 0.1 | X = 0.2 | |
|---|---|---|---|
| Crystal system | Cubic | Cubic | Cubic |
| Space group | Ia![[3 with combining macron]](https://www.rsc.org/images/entities/char_0033_0304.gif) d (230) d (230) |
Ia![[3 with combining macron]](https://www.rsc.org/images/entities/char_0033_0304.gif) d (230) d (230) |
Ia![[3 with combining macron]](https://www.rsc.org/images/entities/char_0033_0304.gif) d (230) d (230) |
| Z | 8 | 8 | 8 |
| Cell parameters/Å | a/c = 12.074 | a/c = 12.051 | a/c = 12.034 |
| α/β/γ (°) | 90 | 90 | 90 |
| Cell volume (Å3) | 1760.17 | 1751.72 | 1742.8 |
| 2θ interval, deg | 10–120 | 10–120 | 10–120 |
| Profile factor Rp | 7.49% | 7.25% | 8.13% |
| Weighted profile factor Rwp | 10.12% | 10.03% | 12.51% |
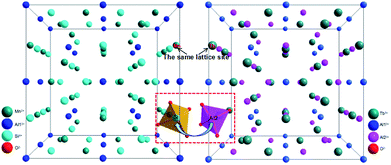
The crystal structural evolution by introducing MAS into TbAG is shown in Fig. 3. According to Bragg's equation (2d![[thin space (1/6-em)]](https://www.rsc.org/images/entities/char_2009.gif) sin
sin![[thin space (1/6-em)]](https://www.rsc.org/images/entities/char_2009.gif) θ = nλ, where d is the spacing between the planes, λ is the wavelength of the X-ray, and θ is the diffraction angle). Here, Mn2+ (0.67 Å, CN = 8) and Si4+ (0.26 Å, CN = 4) ions have a smaller radius than Tb3+ (0.92 Å, CN = 8) and Al3+ (0.39 Å, CN = 4) ions. When MAS (cubic, V = 1573.04 Å3) is dissolved in TbAG (cubic, V = 1760.17 Å3), the (MnSi)6+ pair will partially substitute the larger (TbAl)6+ pair, leading to a decline of the spacing between the planes and a shrink of lattice cell. Additionally, with increasing the content of MAS in solid solution, the lattice symmetry will be lowered and the crystalline cell will distort. These changes of crystal structure will have important effects on the photoluminescence of the obtained solid solutions.
θ = nλ, where d is the spacing between the planes, λ is the wavelength of the X-ray, and θ is the diffraction angle). Here, Mn2+ (0.67 Å, CN = 8) and Si4+ (0.26 Å, CN = 4) ions have a smaller radius than Tb3+ (0.92 Å, CN = 8) and Al3+ (0.39 Å, CN = 4) ions. When MAS (cubic, V = 1573.04 Å3) is dissolved in TbAG (cubic, V = 1760.17 Å3), the (MnSi)6+ pair will partially substitute the larger (TbAl)6+ pair, leading to a decline of the spacing between the planes and a shrink of lattice cell. Additionally, with increasing the content of MAS in solid solution, the lattice symmetry will be lowered and the crystalline cell will distort. These changes of crystal structure will have important effects on the photoluminescence of the obtained solid solutions.
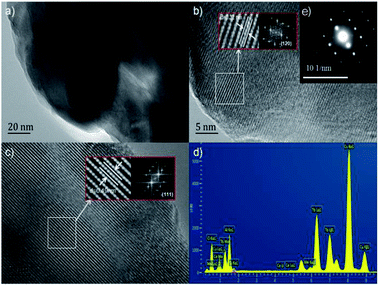
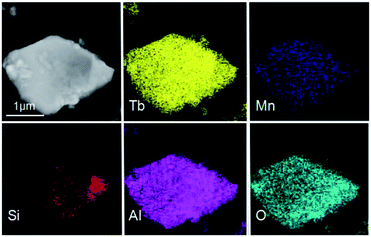
The TEM and HRTEM images of (Tb0.9Mn0.1)3Al2(Al0.9Si0.1)3O12:Ce3+ was shown in Fig. 4. The d-spacings of 0.32 nm and 0.49 nm could be assigned to the (321) and (211) planes. The selected-area electron diffraction (SAED) pattern shows the single crystal character of (Tb0.9Mn0.1)3Al2(Al0.9Si0.1)3O12:Ce3+ grain. The EDS elemental analysis (in Fig. 4d) and mappings (in Fig. 5) exhibit that Tb, Mn, Al, Si, and O are very homogeneously distributed within a single crystal particle of the solid solutions.
Photoluminescence characteristics
Under 456 nm excitation, the emission spectra of (Tb1−xMnx)3Al2(Al1−xSix)3O12:Ce3+ (x = 0–0.2) at room temperature, exhibit an obvious broadening trend with a maximum at 544 nm as shown in Fig. 6a. FWHM increases gradually from 68 nm (x = 0) to 86 nm (x = 0.2) with increasing x, whereas the left wing and peak position remains almost unchanged. The broadening emission bands were achieved with the increase of the MAS concentrations in TAG, which can be ascribed to combine the 5d1 → 4f (2F5/2,7/2) transition of Ce3+ and the 4T1 (t42e) → 6A1 (t33e2) transition of Mn2+, mainly dependent on energy transfer of Ce3+ → Mn2+ and Tb3+ → Mn2+. At that, the Tb3+ ions in the host acted both host and activator and it can show host lattice emission. It is observed that the luminescence spectra of (Tb1−xMnx)3Al2(Al1−xSix)3O12:Ce3+ is a complex band, which presents the mixture of Ce3+, Tb3+ and Mn2+ luminescence and the Ce3+ emission plays the leading role.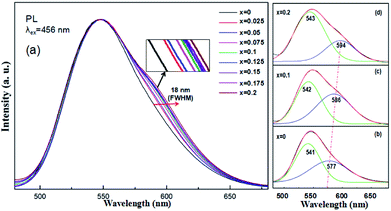 | ||
| Fig. 6 (a) PL spectra of (Tb1−xMnx)3Al2(Al1−xSix)3O12:Ce3+ (x = 0–0.2), and (b–d) Gaussian curve fittings of (Tb1−xMnx)3Al2(Al1−xSix)3O12:Ce3+ (x = 0, 0.1, 0.2). | ||
As we know, in order to realize asymmetric color-tunable spectral broadening, the (Tb1−xMnx)3Al2(Al1−xSix)3O12:Ce3+ solid solution phosphors can be mainly attributed to structural disorder and energy transfer from sensitizer to activator are one of important way.30 Structural disorder is one of causes for spectral broadening in luminescent materials and can be synthesized by introducing analogous substitution in crystal lattice.31 TbAG is isostructural with MAS, both crystallizing in a cubic Ia![[3 with combining macron]](https://www.rsc.org/images/entities/char_0033_0304.gif) d structure, which makes it possible to introduce MAS into TbAG as a substitution. In addition, the substitution between (MnSi)6+ pair and (TbAl)6+ pair can be considered as double-doping in TbAG. According to the increases of Mn2+/Tb3+, Si4+/Al3+ ratio, the degree of structural disorder also increase. Moreover, the electronic and crystal structure of the solid solution productions (Tb1−xMnx)3Al2(Al1−xSix)3O12 can be changed, which can affect the spectral tuning. Energy transfer is another reason, which plays an important role in the (Tb1−xMnx)3Al2(Al1−xSix)3O12 host.
d structure, which makes it possible to introduce MAS into TbAG as a substitution. In addition, the substitution between (MnSi)6+ pair and (TbAl)6+ pair can be considered as double-doping in TbAG. According to the increases of Mn2+/Tb3+, Si4+/Al3+ ratio, the degree of structural disorder also increase. Moreover, the electronic and crystal structure of the solid solution productions (Tb1−xMnx)3Al2(Al1−xSix)3O12 can be changed, which can affect the spectral tuning. Energy transfer is another reason, which plays an important role in the (Tb1−xMnx)3Al2(Al1−xSix)3O12 host.
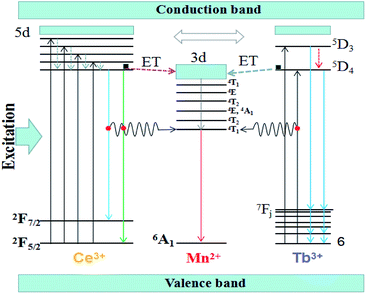
The Fig. 7 shows the schematic energy level for the energy transfer processes of Ce3+, Tb3+ → Mn2+ in the (Tb1−xMnx)3Al2(Al1−xSix)3O12 host. As a sensitizer, the Ce3+ ions can transfer their energy to the activator Mn2+ ions, including between the 5d1 → 4f (2F5/2,7/2) of Ce3+ and 7F6 → 5D4 of Tb3+ transitions. When the solid solution phosphors (Tb1−xMnx)3Al2(Al1−xSix)3O12:Ce3+ are excited within the Ce3+ absorptions for instance at 456 nm blue light, the electrons of Ce3+ ions are firstly lifted from the ground state 4f to the excited state of the 5d. Then, the electrons relax from highest excited state (5d) to lowest excited state (5d) orbitals and release energy in form of yellow lights and eventually return to the ground state 4f (2F5/2,7/2). When the Mn2+ dopants are built into, partial energy which is absorbed by Ce3+ groups can be transferred to Mn2+ in non-radiative process as well as transfer the lowest activation energy (5D4) of Tb3+ ions to the 3d level of Mn2+, and then release energy in form of orange-red lights and eventually return to the ground state 6A1.
In our work, TbAG:Ce phosphors emit bright yellow light due to the 5d1 → 4f (2F5/2,7/2) transition of Ce3+; moreover, the (Tb1−xMnx)3Al2(Al1−xSix)3O12:Ce3+ solid solution phosphors can emit orange-red light via energy transfer of Ce3+ → Mn2+ in the pictorial diagram Fig. 11b. Thus, it can be realized that the color-tunable emissions shift from yellow light to orange-red light in the solid solution garnets. The Gaussian curve fittings of (Tb1−xMnx)3Al2(Al1−xSix)3O12:Ce3+ (x = 0, 0.2) phosphors are shown in Fig. 6b–d. The curve fittings exhibit that the emission bands consist of two broad bands peaking at 541 nm, 542 nm, 543 nm (Fit Peak 1, green curve) and 577 nm, 586 nm 594 nm (Fit Peak 2, blue curve), respectively. The Fit Peak 1 exhibits that the shift is not obvious; however, the Fit Peak 2 shows obvious red-shift from 577 nm to 594 nm. The luminescence of Mn2+ (3d5) ions in solids typical exhibits broad band emission with the maxima around 590 nm due to the 4T1 (t42e) → 6A1 (t33e2) transition of Mn2+.32,33 Therefore, this is attributed to the significant spectral overlap between the emission of 5d1 → 4f (2F5/2,7/2) transition of Ce3+ and the d–d spin-forbidden transition of Mn2+. It is almost in agreement with the spectral broadening.
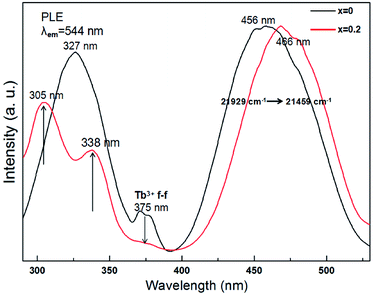
The excitation spectrum of Tb3Al2Al3O12:Ce3+ (x = 0) in the range of 290 to 530 nm (in Fig. 8, black curve) consist of broad band peaked at 327, 375, and 456 nm. Of these, the two stronger bands with peaks at 327 and 456 nm are related correspondingly to the 4f → 5d transition of Ce3+ ions, and the two weak peaks around 375 nm are ascribed to the f → f allowing transition of Tb3+ ion. Moreover, the excitation spectrum of (Tb0.8Mn0.2)3Al2(Al0.8Si0.2)3O12:Ce3+ (x = 0.2) (in Fig. 8, red curve) indicates three bands peaked at 305, 338, and 466 nm in the range of 290 to 530 nm. As the MAS concentration increases to x = 0.2, the excitation peak has two bands with the maxima at 466 and 338 nm due to the 4f(2F5/2) → 5d1 transitions of Ce3+ as well as the excitation peak around 305 nm is attributed to the spin-forbidden (E1) transitions of Tb3+ cations. In addition, the relative intensity of the two weak peaks around 375 nm distinctly reduces due to the Tb3+ to Mn2+ energy transfer. Meanwhile, the results can indicate a good indicator of the energy transfer from Ce3+, Tb3+ to Mn2+ in (Tb1−xMnx)3Al2(Al1−xSix)3O12 host.
The temperature dependence experiment of phosphors illustrated that the thermal quenching is one of the most important parameters applied in wLEDs because it directly affects light output and CRI, and the peak relative emission intensity under 456 nm excitation of (Tb1−xMnx)3Al2(Al1−xSix)3O12:Ce3+ (x = 0, 0.1, 0.2) was depicted in Fig. 9. As shown in Fig. 9, as the temperature increases, the emission intensity of phosphors decreases. In addition, with increasing x values the thermal stability gradually decreases, which can be explained by the neighboring-cation effect.34 While the temperature was increased to 150 °C (∼423 K), the peak emission intensities are decreased to 73%, 67% and 61% of the initial value (25 °C).
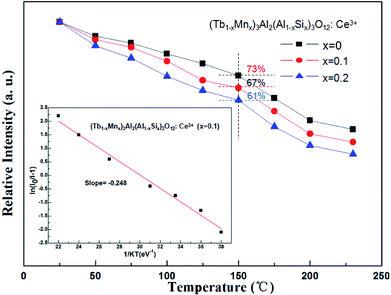 | ||
| Fig. 9 Temperature-dependent emission intensity of (Tb1−xMnx)3Al2(Al1−xSix)3O12:Ce3+ (x = 0, 0.1, 0.2) phosphors. | ||
The real quenching temperature (T50%) is defined as the temperature at which the emission intensity is 50% of its original value. The phosphors have a T50 of over 250 °C, suggesting their superior thermal stability as luminescent materials for use in WLEDs. The activation energy (ΔE) of thermal quenching was calculated by the Arrhenius equation:35
 | (1) |
In addition, in order to further expound the energy transfer process, the decay curves of the Ce3+ ion emission in the (Tb1−xMnx)3Al2(Al1−xSix)3O12:Ce3+ solid solution phosphors under 456 nm excitation and monitored at 544 nm are shown in Fig. 10. In principle, the lifetime of Ce3+ can be shortened by the Ce3+ → Mn2+ energy transfer. All of the decay curves can be fitted well with the second exponential equation:
I(t) = A1![[thin space (1/6-em)]](https://www.rsc.org/images/entities/char_2009.gif) exp(−t/τ1) + A2 exp(−t/τ1) + A2![[thin space (1/6-em)]](https://www.rsc.org/images/entities/char_2009.gif) exp(−t/τ2) exp(−t/τ2)
| (2) |
| τ* = (A1τ12 + A2τ22)/(A1τ1 + A2τ2) | (3) |
| ηT = 1 − τs/τs0 | (4) |
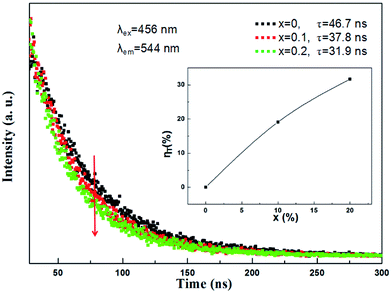 | ||
| Fig. 10 Room temperature decay curves of (Tb1−xMnx)3Al2(Al1−xSix)3O12:Ce3+ (x = 0, 0.1, 0.2) under excitation at 456 nm and emission at 544 nm. The inset shows the energy transfer efficiency ηT. | ||
The CIE coordinates of (Tb1−xMnx)3Al2(Al1−xSix)3O12:Ce3+ (x = 0, 0.1, 0.2) phosphors were shown in Fig. 11a. The calculated CIE coordinates are (0.4485, 0.5073) for x = 0, (0.4803, 0.4618) for x = 0.1 and (0.5011, 0.4102) for x = 0.2, respectively. We can clearly see that the color shifts red zone conducive to improve the CRIs with increasing x. The digital photos of the (Tb1−xMnx)3Al2(Al1−xSix)3O12:Ce3+ (x = 0, 0.1, 0.2) solid solution phosphors at 365 nm excitation are demonstrated in Fig. 11b. The color of phosphors gradually shifts from yellow light to orange-red light with increase of the MAS content. Then, it can be obviously observed that the luminescence of (Tb1−xMnx)3Al2(Al1−xSix)3O12:Ce3+ (x = 0.2) has high CRI, and is redder than TbAG:Ce.
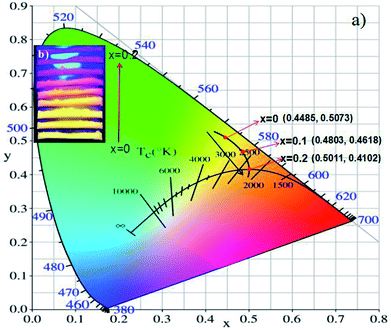 | ||
| Fig. 11 (a) CIE chromaticity coordinates and (b) digital photos under 365 nm excitation of (Tb1−xMnx)3Al2(Al1−xSix)3O12:Ce3+ (x = 0, 0.1, 0.2). | ||
Conclusions
In summary, a series of color-tunable (Tb1−xMnx)3Al2(Al1−xSix)3O12:Ce3+ garnet solid solution phosphors were successfully synthesized by a solid-state reaction method. With the increase of MAS content, there is no other special impurity phase, which can be compared with values of the cell parameters via the suggested formula. The right wing of PL spectra under the 456 nm excitation exhibit spectral broadening and the FWHM increases gradually from 68 nm to 86 nm. Furthermore, the PLE spectra show spectral shift and new absorption band, which is attributed to change of crystal structure and energy transfer Ce3+ → Mn2+ and Tb3+ → Mn2+. Meanwhile, via fluorescence decay analyses the energy transfer of activators can be proved further. The CIE coordinates shift from (0.4485, 0.5073) to (0.5011, 0.4102), which can obtain high CRI. These results indicate that (Tb1−xMnx)3Al2(Al1−xSix)3O12:Ce3+ garnet solid solution phosphors may be promising for general lighting in future.Conflicts of interest
There are no conflicts to declare.Acknowledgements
This work is financially supported by the Natural Science Foundation of Chongqing (cstc2018jcyjAX0339, cstc2016jcyjA0567, cstc2017jcyjAX0393), Chongqing Youth Science and Technology Talent Cultivation Project (cstc2014kjrc-qnrc40006) and Chongqing International Science & Technology Cooperation Program (cstc2015gjhz0003).Notes and references
- N. C. George, K. A. Denault and R. Seshadri, Annu. Rev. Mater. Res., 2013, 43, 481–501 CrossRef CAS.
- H. Daicho, T. Iwasaki, K. Enomoto, Y. Sasaki, Y. Maeno, Y. Shinomiya, S. Aoyagi, E. Nishibori, M. Sakata, H. Sawa, S. Matsuishi and H. Hosono, Nat. Commun., 2012, 3, 1132–1139 CrossRef PubMed.
- S. Nakamura, T. Mukai and M. Senoh, Appl. Phys. Lett., 1994, 64, 1687–1689 CrossRef CAS.
- Z. G. Xia and A. Meijerink, Chem. Soc. Rev., 2017, 46, 275–299 RSC.
- Z. G. Xia and Q. L. Liu, Prog. Mater. Sci., 2016, 8, 59–117 CrossRef.
- R. T. Wegh, H. Donker, K. D. Oskam and A. Meijerink, Science, 1999, 283, 663–666 CrossRef CAS PubMed.
- K. Li, D. L. Geng, M. M. Shang, Y. Zhang, H. Z. Lian and J. Lin, J. Phys. Chem. C, 2014, 118, 11026–11034 CrossRef CAS.
- J. Ueda, P. Dorenbos, A. J. J. Bos, A. Meijerink and S. Tanabe, J. Phys. Chem. C, 2005, 119, 25003–25008 CrossRef.
- L. Wang, R. J. Xie, Y. Q. Li, X. J. Wang, C. G. Ma, D. Luo, T. Takeda, Y. T. Tsai, R. S. Liu and N. Hirosaki, Light: Sci. Appl., 2016, 5, 1–9 CAS.
- Z. G. Xia, Y. Y. Zhang, M. S. Molokeev and V. V. Atuchin, J. Phys. Chem. C, 2013, 117, 20847–20854 CrossRef CAS.
- A. A. Setlur, E. V. Radkov, C. S. Henderson, J. H. Her, A. M. Srivastava, N. Karkada, M. S. Kishore, N. P. Kumar, D. Aesram, A. Deshpande, B. Kolodin, L. S. Grigorov and U. Happek, Chem. Mater., 2010, 22, 4076–4082 CrossRef CAS.
- Y. Q. Li, J. E. J. van Steen, J. W. H. van Krevel, G. Botty, A. C. A. Delsing, F. J. Disalvo, G. de With and H. T. Hintzen, J. Alloys Compd., 2006, 417, 273–279 CrossRef CAS.
- K. Uheda, N. Hirosaki, Y. Yamamoto, A. Naito, T. Nakajima and H. Yamamoto, Electrochem. Solid-State Lett., 2006, 9, 22–25 CrossRef.
- H. Watanabe and N. Kijima, J. Alloys Compd., 2009, 475, 434–439 CrossRef CAS.
- P. Pust, V. Weiler, C. Hecht, A. Tucks, A. S. Wochnik, A. K. Hen, D. Wiechert, C. Scheu, P. J. Schmidt and W. Schnick, Nat. Mater., 2014, 13, 891–896 CrossRef CAS PubMed.
- H. M. Zhu, C. C. Lin, W. Q. Luo, S. T. Shu, Z. G. Liu, Y. S. Liu, J. T. Kong, E. Ma, Y. G. Cao, R. S. Liu and X. Y. Chen, Nat. Commun., 2014, 5, 4312–4321 CrossRef CAS PubMed.
- T. Han, T. C. Lang, J. Wang, M. J. Tu and L. L. Peng, RSC Adv., 2015, 5, 100054–100059 RSC.
- C. H. Huang, T. M. Chen, W. R. Liu, Y. C. Chiu, Y. T. Yeh and S. M. Jang, ACS Appl. Mater. Interfaces, 2010, 2, 259–264 CrossRef CAS.
- G. G. Li, D. L. Geng, M. M. Shang, C. Peng, Z. Y. Cheng and J. Lin, J. Mater. Chem., 2011, 21, 13334–13344 RSC.
- W. Lu, Z. D. Hao, X. Zhang, Y. S. Luo, X. J. Wang and J. H. Zhang, Inorg. Chem., 2011, 50, 7846–7851 CrossRef CAS PubMed.
- R. Martinez-Martinez, E. Alvarez, A. Speghini, C. Falcony and U. Caldino, Thin Solid Films, 2010, 518, 5724–5730 CrossRef CAS.
- L. Cheng, W. T. Zhang, Y. H. Li, S. Y. Dai, X. F. Chen and K. H. Qiu, Ceram. Int., 2017, 43, 11244–11249 CrossRef CAS.
- K. A. Denault, J. Brgoch, M. W. Gaultois, A. Mikhailovsky, R. Petry, H. Winkler, S. P. DenBaars and R. Seshadri, Chem. Mater., 2014, 26, 2275–2282 CrossRef CAS.
- V. Bachmann, C. Ronda and A. Meijerink, Chem. Mater., 2009, 21, 2077–2084 CrossRef CAS.
- H. W. Fang, X. T. Wei, Z. Z. Wang, J. Cheng, M. Yin and Y. H. Chen, J. Lumin., 2016, 191, 46–50 CrossRef.
- F. R. Cheng, Z. G. Xia, M. S. Molokeev and X. P. Jing, Dalton Trans., 2015, 44, 18078–18089 RSC.
- Z. G. Xia, Y. Y. Zhang, M. S. Molokeev, V. V. Atuchin and Y. Luo, Sci. Rep., 2013, 3, 3310–3316 CrossRef PubMed.
- Y. F. Xia, J. Chen, Y. G. Liu, M. S. Molokeev, M. Guan, Z. H. Huang and M. H. Fang, Dalton Trans., 2016, 44, 1007–1015 RSC.
- A. Luchechko and O. Kravets, J. Lumin., 2017, 192, 11–16 CrossRef CAS.
- F. W. Kang, M. Y. Peng, X. B. Yang, G. P. Dong, G. C. Nie, W. J. Liang, S. H. Xu and J. R. Qiu, J. Mater. Chem. C, 2014, 2, 6068–6076 RSC.
- D. Mocatta, G. Cohen, J. Schattner, O. Millo, E. Rabani and U. Banin, Science, 2011, 332, 77–81 CrossRef CAS PubMed.
- T. Han, S. X. Cao, L. L. Peng, D. C. Zhu, C. Zhao, M. J. Tu and J. Zhang, Opt. Mater., 2012, 34, 1618–1621 CrossRef CAS.
- Y. Zorenko, V. Gorbenko, T. Voznyak, M. Batentschuk, A. Osvet and A. Winnacker, J. Lumin., 2010, 130, 380–386 CrossRef CAS.
- Y. F. Liu, X. Zhang, Z. D. Hao, Y. S. Luo, X. J. Wang, L. Ma and J. H. Zhang, J. Lumin., 2013, 133, 21–24 CrossRef CAS.
- S. Bhushan and M. V. Chukichev, J. Mater. Sci. Lett., 1988, 7, 319–321 CrossRef CAS.
- C. C. Lin, Y. S. Zheng, H. Y. Chen, C. H. Ruan, G. W. Xiao and R. S. Liu, J. Electrochem. Soc., 2010, 157, H900–H903 CrossRef CAS.
- J. Zhou and Z. G. Xia, J. Mater. Chem. C, 2014, 2, 6978–6984 RSC.
| This journal is © The Royal Society of Chemistry 2018 |

