 Open Access Article
Creative Commons Attribution 3.0 Unported Licence
Determination of the absolute CH4 adsorption using simplified local density theory and comparison with the modified Langmuir adsorption model
Yeyu Zhangade,
Shaonan Zhangc,
Zhicheng Wangde,
Hucheng Deng*ab,
Minghui Qide,
Xianfeng Penga and
Yueliang Liu *f
*f
aCollege of Energy Resources, Chengdu University of Technology, Chengdu, 610059, China. E-mail: denghucheng@cdut.edu.cn; Tel: +86 13402851216
bState Key Laboratory of Oil and Gas Reservoir Geology and Exploitation, Chengdu, 610059, China
cCollege of Geoscience and Technology, Southwest Petroleum University, Chengdu, 610501, China
dSichuan Institute of Coal Field Geological Engineering Exploration and Designing, Chengdu, 610072, China
eShale Gas Evaluation and Exploitation Key Laboratory of Sichuan Province, Chengdu, 610051, China
fSchool of Petroleum Engineering, China University of Petroleum (East China), Qingdao, Shandong 266580, China. E-mail: sdliuyueliang@163.com
First published on 11th December 2018
Abstract
Accurately determining the adsorbed amount of CH4 on shale is significant for understanding the mechanisms of shale gas storage and shale methane recovery from shale gas reservoirs. Excess CH4 adsorption is measured using the thermogravimetric method. Simplified local density (SLD) theory is applied to calculate the adsorbed CH4 density to obtain the absolute adsorption. Moreover, the modified Langmuir adsorption model is employed to fit the excess adsorption to describe the absolute adsorption. The adsorbed CH4 density from the SLD model is affected by the system pressure and temperature, while such density obtained from the modified Langmuir model is only a function of temperature. Compared to the modified Langmuir model, the SLD model can better capture the adsorbed CH4 density, which allows accurate determination of the absolute CH4 adsorption.
1. Introduction
Shale gas is one kind of unconventional energy resource, which has become an increasingly important energy in recent years. Shale reservoirs generally exhibit some typical characteristics of extremely low permeability, and heterogeneity.1 Shale generally contains a large amount of kerogen, which can result in the significant adsorption of shale gas on the organic shale surface.2 Accurately measuring the amount of adsorbed shale gas is quite important for the estimation of shale gas storage and the development of shale gas reservoirs.As is known, CH4 is a common component existing in shale fluid. In shale gas reservoirs, CH4 is generally stored in three different states, which is clarified as free-gas state in nanopores, absorbed-gas state in kerogen, and adsorbed-gas state on pore surface.3–5 It has been found that the adsorbed CH4 can take 20–85 vol% accounting for the total gas amount.4 Recently, extensive studies are implemented to measure the CH4adsorption on shale samples. Volumetric method6–10 and thermogravimetric (TGA) method3,11,12 are two main approaches applied for measuring the CH4 adsorption isotherms on shale. TGA method enables to measure the weight difference as accurate as 1 μg. Thereby, compared to volumetric method, TGA method is more accurate in measuring the amount of adsorbed CH4 on shale samples.
However, the laboratory measurement only provides the excess adsorption. It has proposed that the measured excess adsorption has possible underestimation of the amount of adsorbed CH4.12 Generally, the measured excess adsorption is transformed to the absolute values, which reflects the actual adsorbed amount of CH4 on shale.4,12 The density of adsorbed CH4 is usually employed to make this conversion. Due to the difficulty in measuring such density directly, some constant values are generally used to represent the density of adsorbed CH4. For instance, the density of adsorbed CH4 is suggested to be the liquid CH4 density at the room boiling point, i.e., 420 kg m−3.13–17 However, it is proved that the density of adsorbed CH4 is strongly affected by temperature, pressure, and pore size.12,18,19 Most recently, some correlation models, such as the modified Langmuir adsorption model, Dubinin–Radushkevitch equation, Ono–Kondo models, and Supercritical Dubinin–Radushkevitch equation, are widely employed to obtain the absolute adsorption by adjusting the adsorbed CH4 density.19–22 Due to the simplicity for usage, the modified Langmuir adsorption model is extensively used in obtaining the absolute adsorption.
Molecular simulation is also employed to investigate the density of adsorbed CH4 on shale. By specifically considering the fluid-pore wall interactions, molecular simulation provides the fundamental mechanisms of CH4 adsorption in organic pores. Recently, Liu et al. (2018)12 measured the excess adsorption of two hydrocarbon-species, i.e., methane and n-butane, on two typical shale samples; the molecular simulation method was then used to calculate the adsorbed CH4 density. Such density is then applied to describe the absolute adsorption by correcting the measured excess. Base on their simulation results, they observed that the adsorbed CH4 density is affected by temperature, pressure, and pore size. Furthermore, Ambrose et al. (2012)19 also observed the adsorbed CH4 density changes with temperature, pressure, and pore size. Although molecular simulation could accurately determine the adsorbed phase density, the computation is quite expensive compared to the conventional methods. Simplified local density (SLD) theory specifically takes into consideration the fluid/pore surface interactions, which can thereby determine the density of adsorbed CH4 accurately. Compared to molecular simulation method, SLD model significantly reduces the computational time.
In this study, the excess CH4 adsorption is measured on the typical shale samples. The modified Langmuir adsorption model and the SLD model are then employed to capture the absolute adsorption based on the excess adsorption. As the previous study,23 the SLD model captures the absolute adsorption by obtaining the density of adsorbed CH4 on shale. The modified Langmuir adsorption model describes the absolute adsorption by accurately fitting the excess adsorption. The performance of the modified Langmuir adsorption model is then evaluated by comparing with the SLD model. The objectives of this study are: (1) to assess the validity of the widely used modified Langmuir adsorption model in determining the absolute CH4 adsorption on shale; (2) to propose a practical method, i.e., the SLD model, to determine the absolute CH4 adsorption. In our SLD model, the carbon-slit pore model is employed to describe the organic pores.
2. Experimental section
2.1 Materials
The CH4 used in this work has a purity of 99.95 mol%. The two shale samples used are obtained from Longmaxi formation. Before experiment, the shale samples are sealed to avoid the moisture.2.2 Characterization of the shale samples
2.3 Measurement of the excess adsorption
In this adsorption experiment, we measure the excess CH4 adsorption with a thermalgravimetric (TGA) analyzer at the temperatures of 303.15, 345.15, and 387.15 K, and pressures as high as 15.0 MPa. With the TGA method, the measured excess adsorption uptake can be expressed as,24| Mex = Mad − ρVad | (1) |
The adsorbed volume of CH4 can be given by,
 | (2) |
Substituting eqn (2) into (1), we can obtain the expression for absolute adsorption, which represents the actual adsorption uptake of CH4 on shale,
 | (3) |
To confirm the reliability and reproductivity of the measured data, we repeat each test twice, and it is found that the maximum deviation is always smaller than ±3.76% between two measuring runs.
2.4 Modified Langmuir adsorption model
As shown in eqn (1), the adsorbed CH4 density is important to obtain the absolute adsorption. Recently, three categories of conversion methods have been proposed to represent this quantity. One approach is to predetermine the adsorbed CH4 density as a constant value, which generally ranges between 0.373 g cm−3 (ref. 19 and 25) and 0.423 g cm−3.3,26,27 Our previous study has proved that this method is unphysically reasonable considering that the adsorbed CH4 density is generally influenced by system pressure, temperature, and pore size.12 Another approach is to determine this value by fitting a modified equation to the measured excess isotherm by adjusting the adsorbed CH4 density.26–28 Due to its simplicity and low computational cost, the modified Langmuir adsorption model is widely used for fitting excess isotherms and then calculating the absolute isotherms.26,27 This model is based on the assumption that CH4 generally exhibits monolayer adsorption on carbon surface,29,30 which can be expressed as,27
 | (4) |
 in eqn (4) is the standard Langmuir equation. ρad is initially determined by fitting eqn (4) to the directly measured excess adsorption. According to eqn (4), the absolute adsorption uptake is then calculated as,27
 | (5) |
2.5 Simplified local density (SLD) model
The SLD model is originally proposed by Rangarajan et al. (1995),31 which is generally applied to describe gas adsorption on adsorbate surface over a wide pressure/temperature range. The SLD model specifically considers the fluid-pore surface and fluid–fluid interactions, which can accurately describe the gas adsorption on pore surface.32The main assumptions proposed for the SLD model are summarized as below,
(1) Near the pore surface, the chemical potential at any point is equal to the chemical potential in bulk;
(2) At any point, the chemical potential at equilibrium is equal to the summation of potentials due to fluid-pore surface and fluid–fluid interactions;
(3) The fluid-pore surface potentials at any point do not correlate the total number of molecules around this point.
When adsorption reaches equilibrium, the gas chemical potential at position z is calculated as the summation of the potentials due to fluid-pore surface and fluid–fluid interactions; it is regarded as the bulk chemical potential.
| μ(z) = μff(z) + μfs(z) = μbulk | (6) |
The bulk chemical potential of gas can be given as a function of fugacity by,
 | (7) |
 | (8) |
The gas chemical potential in nanopores due to the fluid-pore wall interaction is expressed as,31
| μfs(z) = NA[Ψfs(z) + Ψfs(L − z)] | (9) |
The Lee's partially integrated 10–4 Lennard-Jones potential33 is applied to represent the fluid-pore surface interaction,
 | (10) |
Substituting eqn (8)–(10) into eqn (6), we can obtain the following,
 | (11) |
The Peng–Robinson equation of state (PR-EOS) is employed to take into consideration the fluid–fluid interactions, which can be expressed as a function of density (ρ) as,
 | (12) |
 | (13) |
 | (14) |
The term α(T) in eqn (13) can be expressed as.35
 | (15) |
Applying the PR-EOS, the gas fugacity in bulk is expressed as,
 | (16) |
The fugacity of CH4 taking into consideration the fluid–fluid interactions is expressed as,
 | (17) |
It has been found that the covolume parameter b in eqn (17) affects the adsorbed CH4 density near the pore surface.30 In order to consider the repulsive interactions of the adsorbed CH4, Fitzgerald (2005)37 modified this term to improve the predictive capacity of CH4 on pore surface. It is expressed as,37
| bads = b(1 + Λb) | (18) |
 | (19) |
The density profile of CH4 in a pore is calculated by combining eqn (6) through (19). The excess adsorption is expressed as,
 | (20) |
The average density (ρave) of the adsorbed CH4 in nanopores is calculated by,
 | (21) |
3. Results and discussion
In this subsection, characterization results of the shale samples are first presented. Then, we show the absolute CH4 adsorption calculated from the modified Langmuir adsorption model. SLD model is then employed to obtain the adsorbed CH4 density in pores. Using the calculated adsorbed CH4 density, the measured excess adsorption is then corrected to obtain the absolute adsorption. Finally, we evaluate the performance of the modified Langmuir adsorption model by comparing with SLD model.3.1 Shale sample characterization
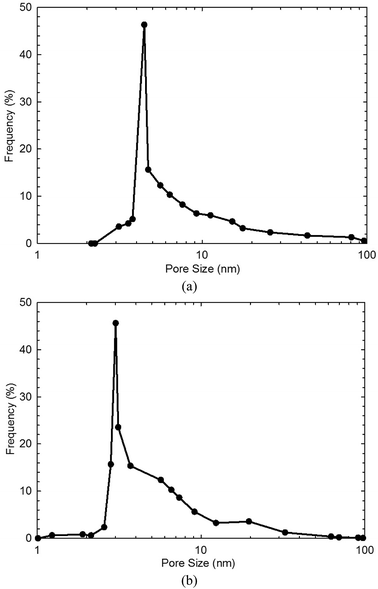
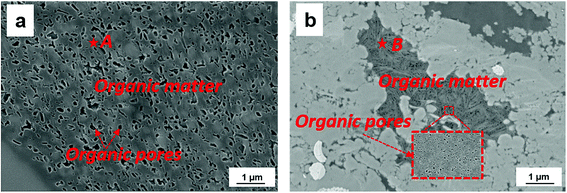
Table 1 shows the measured TOC content and specific surface area of both shale samples. We find that the TOC content in shale sample-1 is higher than that in shale sample-2. However, the specific surface area of shale sample-1 is lower than that of shale sample-2. High TOC content indicates high content of kerogen in shale, which contributes to the specific surface area of shale samples. However, for given shale sample, the specific surface area also correlates with the clay content, heterogeneity, and pore size distribution etc. Fig. 1 shows the measured pore size distribution of both shale samples. Pores in both shale samples are generally in nano-scale locating in the range of 1–100 nm. The dominant pore sizes for the two shale samples are 4.35 nm and 3.12 nm, respectively. Fig. 2 presents the scanned SEM digital images for the shale samples. The X-ray spectroscopy analysis is conducted on the locations of A and B on both shale samples. We observe a high content of carbon element residing in the two points, indicting kerogen. As shown in Fig. 2, we can also observe a bunch of pores present in kerogen, which is recognized as a unique characteristic of kerogen in shale.| Sample ID | TOC content (wt%) | Specific surface area (m2 g−1) |
|---|---|---|
| 1 | 2.38 | 21.365 |
| 2 | 1.65 | 29.569 |
3.2 Absolute CH4 adsorption from the modified Langmuir adsorption model
Fig. 3 presents the measured excess CH4 adsorption on both shale samples at pressures up to 15.0 MPa and temperatures of 303.15–387.15 K. The modified Langmuir adsorption model is employed to fit the excess adsorption by adjusting the adsorbed CH4 density (ρad). We can observe that a perfect matching has been achieved between the measured results and the predicted values from the modified Langmuir adsorption model. At 303.15 K, the excess adsorption of CH4 is enhanced as pressure increases. The excess adsorption reaches the maximum at around 8.0 MPa on the two shale samples. However, as pressure further increases, the measured excess adsorption decreases. Tian et al. (2017)2 attributed this behavior to the much higher CH4 density at the center of organic pores at higher pressure conditions. The excess adsorption is then corrected to absolute adsorption using eqn (5) from the modified Langmuir adsorption model, as shown in Fig. 3. The absolute adsorption is clearly affected by the system temperature and pressure; specifically, it decreases with increasing temperature but increases as pressure increases. Moreover, compared to the excess adsorption, the absolute adsorption is higher, especially at higher pressure conditions, which agrees well with the previous findings.2,12 It suggests the amount of adsorbed CH4 on the organic shale is underestimated by the excess adsorption. In addition, the absolute CH4 adsorption varies for different shale samples at the same testing pressure/temperature conditions. Besides of system pressure and temperature, CH4 adsorption is expected to be also influenced by mineral contents, heterogeneity, specific surface area, and total organic carbon content etc.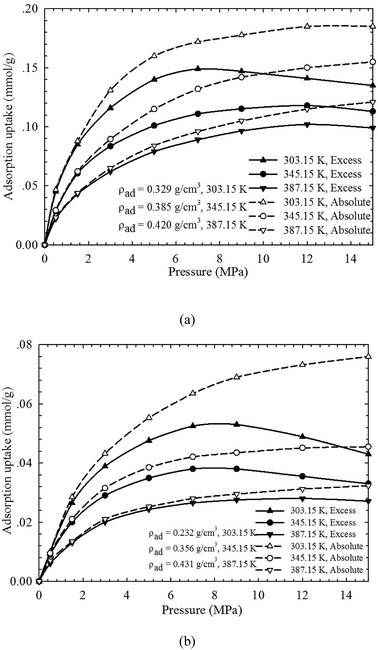 | ||
| Fig. 3 The measured excess adsorption and the calculated absolute CH4 adsorption on (a) shale sample-1, and (b) shale sample-2 from the modified Langmuir adsorption model. | ||
3.3 Adsorbed CH4 density in nanopores
Using SLD model, we investigate the CH4 distribution in the 4.35 nm and 3.12 nm pores. Note that the most probable pore sizes of shale samples-1 and -2 are 4.35 nm and 3.12 nm, respectively. Based on the previous studies, it has been found that CH4 is single-layered adsorption in organic pores.2,12 As is known that the molecular diameter of CH4 is about 0.37 nm, previous works generally used 0.37 nm as the phase width of the adsorbed CH4. In our work, we also take 0.37 nm as the phase width of the adsorbed CH4 in nanopores. The average density of the adsorbed phase is calculated with (where ρave represents the averaged adsorbed phase density of CH4; ρads represents the in situ density in the adsorbed phase of CH4; and zab represents the phase width of the adsorbed CH4). Fig. 4 shows the calculated density of the adsorbed CH4 in the 4.35 nm and 3.12 nm pores at the experimental temperature/pressure conditions. We observe the adsorbed CH4 density is related with the experimental temperature and pressure. Specifically, the adsorbed CH4 density increases with increasing pressure but decreases as temperature increases. We observe that such density varies in the two different pores. Therefore, we may expect that the density of the adsorbed CH4 in is affected by temperature, pressure, and pore size. The previous works that employed constant values to represent the density of adsorbed CH4 is not physically reasonable.13–17
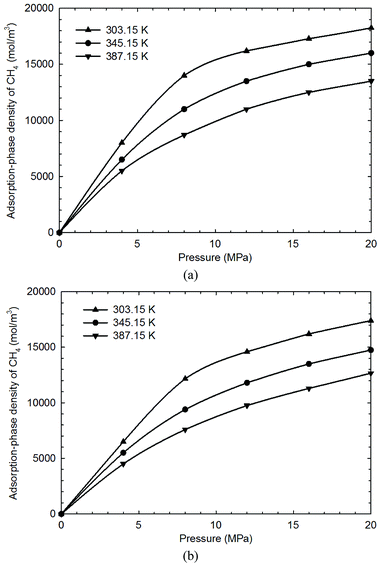 | ||
| Fig. 4 The adsorbed CH4 density in the carbon-slit pores of (a) 4.35 nm, and (b) 3.12 nm at different temperature and pressure conditions. | ||
3.4 Absolute adsorption isotherms of CH4 from SLD model
In this work, two key parameters, i.e., fluid-pore surface interaction energy (εfs/k) and covolume correction parameter (Ab), are adjusted in the SLD model. These parameters are obtained by adjusting these parameters to fit the measured excess adsorption. Table 2 shows the adjusted parameters in the SLD model for both shale samples. We observe that the covolume correction parameter is in the range of −0.3–0.3, which has a good agreement with the previous studies.34,38,39 Fig. 5 shows the measured excess adsorption and the calculated absolute CH4 adsorption on both shale samples from the SLD model. We find that the SLD model can properly represent the excess CH4 adsorption. Moreover, the converted absolute adsorption is also greater than the measured excess, especially at high pressure conditions, which is similar to the observation from the modified Langmuir adsorption model.| Core sample | L (nm) | εfs/k (K) | Ab | A (m2 g−1) |
|---|---|---|---|---|
| #1 | 4.35 | 78.6 | 0.039 | 21.365 |
| 4.35 | 76.3 | 0.065 | 21.365 | |
| 4.35 | 72.1 | 0.046 | 21.365 | |
| #2 | 3.12 | 72.6 | 0.126 | 29.569 |
| 3.12 | 70.9 | 0.139 | 29.569 | |
| 3.12 | 68.5 | 0.116 | 29.569 |
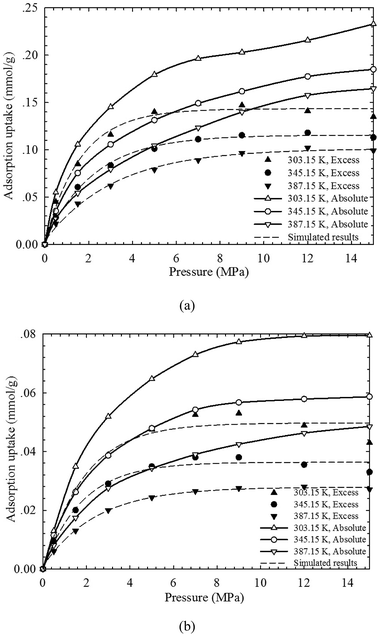 | ||
| Fig. 5 The measured excess adsorption and the calculated absolute CH4 adsorption on (a) shale sample-1, and (b) shale sample-2 from the SLD model. | ||
3.5 Evaluation of the modified Langmuir adsorption model
It has been proved that SLD model can reasonably capture the adsorbed CH4 density and can thus accurately describe the absolute adsorption isotherms. In Fig. 6, the absolute adsorption isotherms calculated from SLD model are compared with those obtained from the modified Langmuir adsorption model. The performance of the modified Langmuir adsorption model is then evaluated in describing the absolute adsorption. We observe that the absolute adsorption obtained from SLD model are always higher than those obtained from the modified Langmuir adsorption model. The modified Langmuir adsorption model describes the absolute adsorption isotherm with constant density values representing the adsorbed CH4 density at a given temperature (see Fig. 3). However, based on the results calculated from SLD model, the density of adsorbed CH4 is related with the temperature, pressure, and pore size. Thereby, the widely used modified Langmuir adsorption model underestimates the actual adsorption and is not reasonable in obtaining the absolute CH4 adsorption on organic shale samples.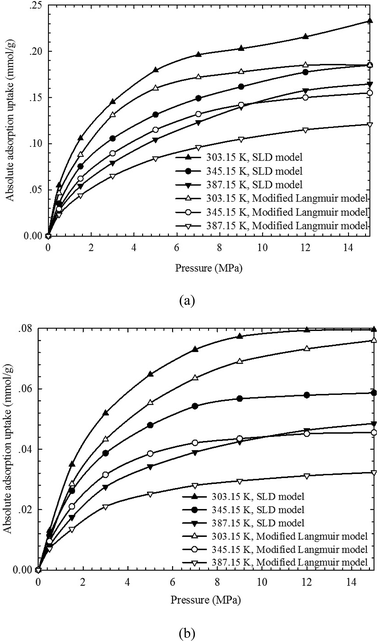 | ||
| Fig. 6 Comparisons of absolute adsorption isotherms between the SLD model and the modified Langmuir adsorption model. | ||
4. Conclusions
In this paper, the excess CH4 adsorption is measured on two shale core samples. We then use the modified Langmuir adsorption model and SLD model to fit the excess adsorption and then describe the absolute CH4 adsorption on the shale core samples. SLD model considers the fluid/pore surface interactions, which can thereby capture the density of adsorbed CH4 in nanopores. This study evaluates the performance of the modified Langmuir adsorption model in describing absolute adsorption of CH4 on organic carbon surface, and more importantly, it raises a more efficient approach (i.e., SLD theory) than the sophisticated molecular simulation tools in determining the absolute adsorption. The detailed conclusions can be summarized as follows:• Based on the simulation results from SLD model, the density of adsorbed CH4 is affected by temperature, pressure, and pore size. It highlights the importance for accurately determining the adsorbed CH4 density in obtaining the absolute CH4 absorption;
• It is found that the corrected absolute adsorption is greater than the excess CH4 adsorption on shale, especially at high pressures. It indicates that the measured excess CH4 adsorption shows underestimation of the amount of adsorbed CH4 on shale;
• Compared to the SLD model, the absolute adsorption obtained from the modified Langmuir adsorption model is always smaller than that obtained from the SLD model. It suggests that the absolute adsorption obtained from the modified Langmuir adsorption model underestimates the actual adsorbed CH4.
This study may inspire us new tools in determining the absolute adsorption uptake of CH4 on shale samples, which is practical in estimating the shale gas storage in shale gas reservoirs. The SLD model is more efficient in calculating the adsorbed CH4 density on shale than the molecular simulation methods. However, besides CH4, some heavier hydrocarbon components may also appear in shale fluids. Therefore, in the future works, the excess adsorption is suggested to be measured for the heavier hydrocarbon species and the SLD model recommended to calculate the adsorbed density for the heavier hydrocarbons on shale samples.
Conflicts of interest
There are no conflicts to declare.Acknowledgements
The first author greatly acknowledges a Discovery Grant from Science and Technology Department of Si Chuan Province for financial support to Mr Y. Zhang (2018JZ0003).References
- Y. Liu, Z. Jin and H. Li, Soc. Pet. Eng. J., 2018, 23, 1784–1797 Search PubMed.
- Y. Tian, C. Yan and Z. Jin, Sci. Rep., 2017, 7, 12040 CrossRef PubMed.
- C. R. Clarkson and B. Haghshenas, Texas, USA, 2013, vol. 10–12, SPE-164532-MS.
- Y. Wu, T. Fan and S. Jiang, et al., Energy Fuels, 2015, 29, 4160–4167 CrossRef CAS.
- B. Yan, Y. Wang and J. E. Killough, Comput. Geosci., 2016, 20, 69–91 CrossRef.
- X. C. Lu, F. C. Li and A. T. Watson, Fuel, 1995, 74, 599–603 CrossRef CAS.
- F. O. Mertens, Surf. Sci., 2009, 603(10–12), 1979–1984 CrossRef CAS.
- R. Heller and M. Zoback, Journal of Unconventional Oil and Gas Resources, 2014, 8, 14–24 CrossRef.
- M. Gasparik, P. Bertier and Y. Gensterblum, et al., Int. J. Coal Geol., 2014, 123, 34–51 CrossRef CAS.
- A. L. Myers and P. A. Monson, Adsorption, 2014, 20, 591–622 CrossRef CAS.
- S. Zhou, H. Wang and H. Xue, et al., Nat. Gas Ind., 2016, 36, 12–20 Search PubMed.
- Y. Liu, H. Li and Y. Tian, et al., Fuel, 2018, 218, 67–77 CrossRef CAS.
- W. K. Lewis, E. R. Gilliland and B. Chertow, et al., Ind. Eng. Chem., 1950, 42, 1326–1332 CrossRef CAS.
- R. J. Grant and M. Manes, Ind. Eng. Chem. Fundam., 1964, 3, 221–224 CrossRef CAS.
- P. G. Menon, J. Phys. Chem., 1968, 72, 2695–2696 CrossRef CAS.
- M. C. Tsai, W. N. Chen and P. L. Cen, et al., Carbon, 1985, 23, 167–173 CrossRef CAS.
- Y. Wang, Y. Zhu and S. Liu, et al., Fuel, 2016, 172, 301–309 CrossRef CAS.
- Z. Jin and A. Firoozabadi, Fluid Phase Equilib., 2013, 360, 456–465 CrossRef CAS.
- R. J. Ambrose, R. C. Hartman and M. Diaz-Campos, et al., Soc. Pet. Eng. J., 2012, 17, 219–229 CAS.
- Y. Gensterblum, P. Hemert and P. Billemont, et al., Carbon, 2009, 47, 2958–2969 CrossRef CAS.
- Y. Gensterblum, P. van Hemert and P. Billemont, et al., Int. J. Coal Geol., 2010, 84, 115–124 CrossRef CAS.
- F. Xiong, X. Wang and M. A. Amooie, et al., Fuel, 2017, 208, 236–246 CrossRef CAS.
- Y. Liu and C. Wang, SPE J., 2019 Search PubMed , under review.
- Y. Wang, T. T. Tsotsis and K. Jessen, Ind. Eng. Chem. Res., 2015, 54, 12187–12195 CrossRef CAS.
- F. E. Hall, C. H. Zhou, K. A. M. Gasem, R. L. Robinson and Y. Dan, SPE Eastern Regional Meeting, vol. 8–10, Charleston, West Virginia, 1994 Search PubMed.
- M. Gasparik, A. Ghanizadeh and P. Bertier, et al., Energy Fuels, 2012, 26, 4995–5004 CrossRef CAS.
- T. F. T. Rexer, M. J. Benham and A. C. Aplin, et al., Energy Fuels, 2013, 27, 3099–3109 CrossRef CAS.
- L. J. Yu, M. Fan, H. Y. Chen, W. W. Zhang and E. Xu, Acta Pet. Sin., 2015, 36, 557–563 CAS.
- B. M. Krooss, F. van Bergen, Y. Gensterblum, N. Siemons, H. Pagnier and P. David, Int. J. Coal Geol., 2002, 51, 69–92 CrossRef CAS.
- Y. Gensterblum, A. Merkel, A. Busch and B. M. Krooss, Int. J. Coal Geol., 2013, 118, 45–57 CrossRef CAS.
- B. Rangarajan, C. T. Lira and R. Subramanian, AIChE J., 1995, 41, 838–845 CrossRef CAS.
- S. A. Mohammad, J. S. Chen and R. L. Robinson Jr, et al., Energy Fuels, 2009, 23, 6259–6271 CrossRef CAS.
- L. L. Lee, Butterworths: Stoneham, MA, 1988 Search PubMed.
- S. A. Mohammad, A. Arumugam and R. L. Robinson Jr, et al., Energy Fuels, 2011, 26, 536–548 CrossRef.
- K. A. M. Gasem, W. Gao and Z. Pan, et al., Fluid Phase Equilib., 2001, 181, 113–125 CrossRef CAS.
- J. H. Chen, D. S. H. Wong and C. S. Tan, et al., Ind. Eng. Chem. Res., 1997, 36, 2808–2815 CrossRef CAS.
- J. E. Fitzgerald, PhD Dissertation, Oklahoma State University, Stillwater, OK, 2005.
- S. Mohammad, J. S. Chen and J. E. Fitzgerald, et al., Energy Fuels, 2008, 23, 1107–1117 CrossRef.
- Y. Pang, Y. S. Mohamed and J. Sheng, SPE Reservoir Eval. Eng., 2018, 21, 73–95 CrossRef CAS.
| This journal is © The Royal Society of Chemistry 2018 |

