 Open Access Article
Creative Commons Attribution 3.0 Unported Licence
Ag8SnS6: a new IR solar absorber material with a near optimal bandgap†
Patsorn Boon-ona,
Belete Asefa Aragawab,
Chun-Yen Leea,
Jen-Bin Shic and
Ming-Way Lee *a
*a
aInstitute of Nanoscience, Department of Physics, National Chung Hsing University, Taichung 402, Taiwan. E-mail: mwl@phys.nchu.edu.tw
bDepartment of Chemistry, Bahir Dar University, P.O. Box 79, Bahir Dar, Ethiopia
cDepartment of Electronic Engineering, Feng Chia University, Taichung, 40724, Taiwan
First published on 26th November 2018
Abstract
We report the synthesis and photovoltaic properties of a new ternary solar absorber – Ag8SnS6 nanocrystals prepared by successive ionic layer adsorption reaction (SILAR) technique. The synthesized Ag8SnS6 nanocrystals have a bandgap Eg of 1.24–1.41 eV as revealed from UV-Vis and external quantum efficiency (EQE) measurements. Its photovoltaic properties were characterized by assembling a liquid-junction Ag8SnS6 sensitized solar cell for the first time. The best cell yielded a Jsc of 9.29 mA cm−2, a Voc of 0.23 V, an FF of 31.3% and a power conversion efficiency (PCE) of 0.64% under 100% incident light illumination using polysulfide electrolyte and Au counter electrode. The efficiency improved to 1.43% at a reduced light intensity of 10% sun. When the polysulfide was replaced by a cobalt electrolyte with a lower redox level, the Voc increased to 0.54 V and PCE increased to 2.29% under 0.1 sun, a respectable efficiency for a new solar material. The EQE spectrum covers the spectral range of 300–1000 nm with a maximum EQE of 77% at λ = 600 nm. The near optimal Eg and the respectable photovoltaic performance suggest that Ag8SnS6 nanocrystals have potential to be an efficient IR solar absorber.
1. Introduction
Semiconductor nanocrystals are now receiving much research attention in the field of photovoltaics. This is due to the unique properties of semiconductor NC materials such as band gap tenability1,2 and high absorption coefficient.3 Moreover, multiple exciton generation effect and hot electron injection in these solar absorbers could improve the solar cell efficiency beyond the Shockley–Queisser limit.4–9 Semiconductor nanocrystals materials can be prepared by solution-based processing, which has the advantages of ease of fabrication and low-cost over Si based solar cell processing.A requirement for a good solar absorber material is that the energy gap Eg should be near 1.4 eV in order to produce a maximal output power.10 To date, the most widely studied solar absorber materials have been the binary metal sulfides and selenides such as CdS, CdSe, PbS, PbSe, Sb2S3 and Ag2S etc.11–16 For a binary semiconductor, its Eg is a fixed value. Only a small number of binary semiconductor satisfies the Eg = 1.4 eV requirement. This limits the number of binary semiconductors suitable for solar absorbers. An advantage of ternary semiconductors is that Eg can be tuned by varying the ratios of the constituent elements, leading to formation of a broad range of new compounds that could be potential solar absorber materials. Solar cells based on ternary metal sulfides have been relatively less explored due to the difficulty in the material synthesis (the widely studied Cu–In–Se system being an exception).
The family of I–III/IV–VI (Cu- and Ag-based) ternary metal sulfides, such as AgInS2,17 AgBiS2,18 AgSbS2,19 Ag3SbS3,20 CuInS2,16 Cu2SnS3 (ref. 21 and 22) and Cu4SnS4,23,24 have been investigated for their applications in photovoltaics and photocatalytics. Among them, Ag8SnS6 owns several important properties such as an ideal Eg of 1.3–1.5 eV, which is near the optimal Eg of 1.4 eV for a solar cell, and high absorption coefficients of α ∼ 104 cm−1 in the visible range.25 Moreover, the three elements contained in Ag8SnS6 – Ag, Sn and S – are nontoxic and environmentally friendly. Ag8SnS6 nanocrystals have been synthesized for various purposes26–30 such as counter electrodes in dye-sensitized solar cells,31 photocatalytic dye degradation,32 photoelectrochemical salt-water splitting33 and thermoelectrics.34 Ag8SnS6 solar cells have recently been reported with an efficiency of 0.25%.35 Here, we report the simple solution-based preparation of Ag8SnS6 nanocrystals and investigation of their photovoltaic properties. Ag8SnS6 nanocrystals were directly grown on the surfaces of mesoporous TiO2 nanoparticles using the successive ionic layer adsorption and reaction (SILAR) technique. Liquid-junction quantum dot-sensitized solar cells based on Ag8SnS6 nanocrystals are demonstrated for the first time. The material crystal structure, morphology and optical property have been investigated. The dependence of photovoltaic performance on SILAR conditions, sun intensity and type of electrolyte have also been studied.
2. Experimental
2.1. Preparation of TiO2 electrodes
Fluorine-doped tin oxide glass (FTO, Pilkington, sheet resistance ∼ 7 Ω □−1) was cleaned with acetone, methanol, and deionized water successively in an ultrasonic bath. It was then coated with three layers of TiO2 film with different particle sizes and film thicknesses. First, a 90 nm thick compact TiO2 film was made by spin-coating (2000 rpm, 1 min) a 0.2 M titanium tetraisopropoxide solution (TTIP) onto an FTO substrate, followed by annealing at 190 °C for 5 min. Next, a mesoporous TiO2 (mp-TiO2) layer (Dyesol 30NR-D, particle size 30 nm, ∼10 μm thick) was coated on top of the compact layer by the doctor blade technique and heated at 125 °C for 5 min. Finally, a TiO2 scattering layer (Dyesol WER2-O, particle size 300 nm, ∼5 μm thick) was coated on top of the mp-TiO2 layer and heated at 500 °C for 15 min.2.2. SILAR growth of Ag8SnS6 nanocrystals
The formation of Ag–Sn–S nanocrystals was made by a two-stage SILAR process. In the first stage, Ag–S nanoparticles were grown on the mp-TiO2 electrode. In the second stage, Sn–S nanoparticles were grown on top of the Ag–S nanoparticles. Post-annealing transformed the Ag–S/Sn–S double-layered structure into the Ag–Sn–S phase. An Ag–S SILAR cycle was performed by dipping the TiO2 electrode in the solution of AgNO3 (0.1 M) for 30 s accompanied with rinsing and drying the electrode. The step resulted in the adsorption of Ag ions on the pores of mp-TiO2. The electrode was then dipped in a Na2S (0.1 M) solution. This process is called one SILAR cycle and creates the Ag2S nuclei. Repetition of this process is necessary to increase the particle size of Ag2S nuclei. In the second-stage SILAR cycle for Sn–S, the same procedure was followed except changing the AgNO3 cation precursor solution with SnCl2 solution to make Sn–S. To achieve high performance, the numbers of Ag2S and Sn–S SILAR cycles need to be optimized. The best ratio for Ag2S and Sn–S SILAR cycles were found to be 3![[thin space (1/6-em)]](https://www.rsc.org/images/entities/char_2009.gif) :
:![[thin space (1/6-em)]](https://www.rsc.org/images/entities/char_2009.gif) 2. For example, a sample with 12 Ag2S cycles has 8 Sn–S cycles. To simplify discussion, a sample with Ag2S (12 cycles)/Sn–S (8 cycles) will be referred to as sample with SILAR(12) herein. Finally, the Ag2S/Sn–S deposited mp-TiO2 electrode was annealed at 400 °C for 10 min under flowing N2 gas, which resulted in the formation of ternary phase Ag8SnS6 nanoparticles.
2. For example, a sample with 12 Ag2S cycles has 8 Sn–S cycles. To simplify discussion, a sample with Ag2S (12 cycles)/Sn–S (8 cycles) will be referred to as sample with SILAR(12) herein. Finally, the Ag2S/Sn–S deposited mp-TiO2 electrode was annealed at 400 °C for 10 min under flowing N2 gas, which resulted in the formation of ternary phase Ag8SnS6 nanoparticles.
2.3. Fabrication of solar cells
The solar cells were fabricated by a sandwich-type assembly of the Ag8SnS6 nanocrystal-immobilized TiO2 photoelectrode and counter electrode (CE) using a 190 μm-thick parafilm thermoplastic spacer and sealant. Gold (Au) was used as the CE. A polysulfide electrolyte containing 0.5 M Na2S, 2 M S, 0.2 M KCl and 0.5 M NaOH in a methanol/DI water (volume ratio 7![[thin space (1/6-em)]](https://www.rsc.org/images/entities/char_2009.gif) :
:![[thin space (1/6-em)]](https://www.rsc.org/images/entities/char_2009.gif) 3) solution was used as a redox mediator. The cobalt electrolyte consisted of 0.2 M Co2+ (Co[PyPz]3[PF6]2 salt-Dyesol), 0.05 M Co3+ (Co[PyPz]3[PF6]2-Dyesol), 0.2 M LiClO4, and 0.2 M t-butyl pyridine with acetonitrile solution, where Py is pyridine and Pz is pyrazole. The electrolyte was injected separately through a predrilled hole on the counter electrode into the cell. The Au CE film, ∼70 nm in thickness, was deposited onto an FTO substrate by sputtering evaporation.
3) solution was used as a redox mediator. The cobalt electrolyte consisted of 0.2 M Co2+ (Co[PyPz]3[PF6]2 salt-Dyesol), 0.05 M Co3+ (Co[PyPz]3[PF6]2-Dyesol), 0.2 M LiClO4, and 0.2 M t-butyl pyridine with acetonitrile solution, where Py is pyridine and Pz is pyrazole. The electrolyte was injected separately through a predrilled hole on the counter electrode into the cell. The Au CE film, ∼70 nm in thickness, was deposited onto an FTO substrate by sputtering evaporation.
2.4. Material characterization and photovoltaic measurements
The crystal structure and phase purity of the prepared material were studied using a high-resolution X-ray diffractometer (XRD, Bruker D8 SSS). The particle size and morphology were determined by a transmission electron microscope (TEM, Joel JEM-2010). Optical properties were studied using a Hitachi U-2800A UV-Vis spectrophotometer. The photovoltaic performance was studied by measuring photocurrent–voltage (I–V) curves using a Keithley 2400 source meter under 100 mW cm−2 light illumination from an Oriel 150 W Xe lamp with an Oriel bandpass filter simulating the AM 1.5 solar spectrum. External quantum efficiency (EQE) was measured using the monochromatic light generated from an Acton monochromator with a 250 W tungsten halogen lamp. The active area, defined by a metal mask, was 3 mm × 3 mm.3. Results and discussion
3.1. Morphology and crystal structure characterization
The structural property of the prepared Ag–Sn–S ternary phase was investigated by studying its X-ray diffraction (XRD) pattern after annealing at 400 °C under nitrogen atmosphere. The XRD pattern shown in Fig. 1 indicates the formation of orthorhombic Ag8SnS6 structure that is in agreement with the reference JCPDS no. 00-038-0434. The diffraction planes given at (311), (120), (411), (022), (122), (510), (313), (322), (123), (031), (611), (131), (603) and (424) are characteristic of the orthorhombic Ag8SnS6 structure. The (022) peak shows the strongest peak intensity compared with other peaks signifying the preferential orientation or major growth of the crystal along (022) plane. The other peaks due to the TiO2 and FTO substrates were also observed. The calculated lattice constants for orthorhombic Ag8SnS6 are a = 15.29, b = 7.57 and c = 10.71 Å, which are in good agreement with the lattice constants of the data in the JCPDS database. For comparison, the major peaks associated with the binary Ag2S and SnS2 compounds are displayed in the bottom panel. It is clear the Ag8SnS6 XRD pattern does not contain the two starting binary phases, indicating successful formation of the Ag8SnS6 single phase. The deposited Ag–S/Sn–S double-layered particles are mostly amorphous before heat treatment (see Fig. S1, ESI†). Only a weak Ag2S peak at 37° corresponding to the (200) plane can be observed. The average particle size of Ag8SnS6 nanocrystals, calculated by the Scherrer's formula36 given in eqn (1) using the strongest (022) peak, is about 17.4 nm.
 | (1) |
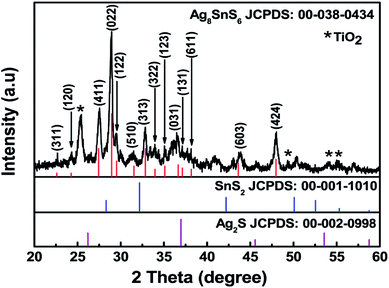 | ||
| Fig. 1 XRD spectra of Ag8SnS6 nanocrystals along with the reference JCPDS 00-038-0434, reference patterns of SnS2 and reference pattern of Ag2S. | ||
Fig. 2a displays a TEM image of bare TiO2 nanoparticles. The rectangular shaped TiO2 particles have round corners and an average length of 30 nm. Fig. 2b displays a TEM image of Ag8SnS6 nanocrystals grown on the surface of TiO2 nanoparticles. The Ag8SnS6 nanocrystals, marked by red arrows, are randomly distributed all over the pores of mesoporous TiO2 with no visible aggregation. Fig. 2c shows the size distribution of Ag8SnS6 nanocrystals prepared with eight SILAR cycles. The particle size of Ag8SnS6 nanocrystals is the range of ∼10–20 nm with a distribution peak near 15 nm. This size is in agreement with the value (17 nm) calculated using Scherrer's formula.
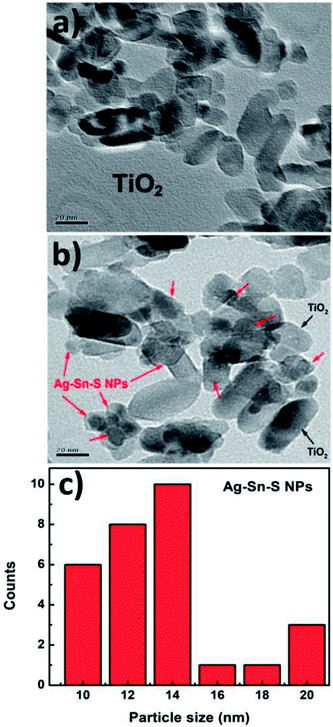 | ||
| Fig. 2 TEM images of (a) 30 nm bare TiO2 nanoparticles, (b) Ag8SnS6 nanocrystals deposited on TiO2 nanoparticles and (c) size distribution of Ag8SnS6 nanocrystals. | ||
3.2. Optical property
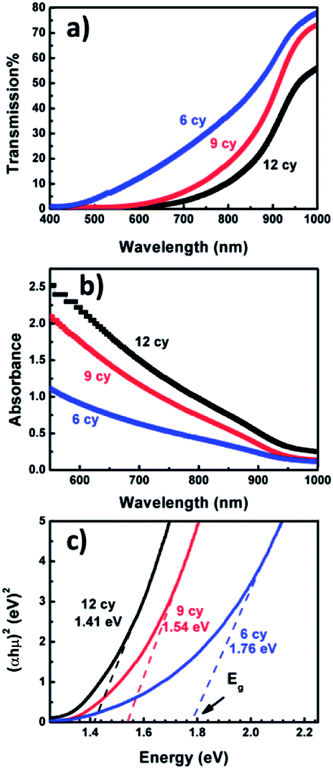
Fig. 3a shows the UV-Visible transmission spectra T(λ) of Ag8SnS6 nanocrystals with different numbers of SILAR cycles n. The corresponding optical absorbance A(λ), calculated from the optical transmission value using the relation , is displayed in Fig. 3b. The transmission T(λ) decreases with increasing n, indicating increasing light absorption by the increased amount of material with increasing SILAR cycles. The absorbance A(λ) increases with increasing n, which is, again, the result of increasing material. A notable feature of the transmission spectra is that the small transmission (T(λ) ≤ 5%, n = 12 sample) for wavelengths < 700 nm. This implies the Ag8SnS6 nanocrystals can absorb nearly all the photon energy with wavelength lower than 700 nm (the visible and near IR regions of the solar spectrum). The large light absorption ability is an advantageous property for a solar material.
Fig. 3c shows the Tauc plot, (αhν)2 versus hν, of the Ag8SnS6 nanocrystals where h is the Planck constant and ν is the frequency. The optical band gap Eg can be estimated by finding the x-intercept of an extrapolated Tauc plot. Eg decreases with increasing SILAR cycles n as: 1.76, 1.54, 1.41 eV for SILAR cycles of 6, 9, 12, respectively. The decrease in Eg with increasing n is attributed partly to the quantum size effect – a large SILAR cycle produced larger particles and, hence, a lower Eg. The Eg observed here is in agreement with the literature values for Ag8SnS6 nanocrystals prepared by other synthesis methods (1.31–1.45 eV).31,33,35 Moreover, The Eg of 1.41 eV (n = 12 sample) is equal to the optimal Eg (1.4 eV) for a solar absorber, which is favorable property for a solar material.
3.3. Photovoltaic performance
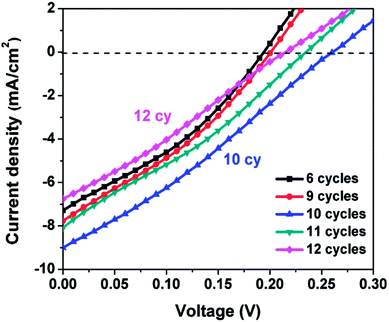
The photovoltaic performance of a SILAR-prepared QDSSC is strongly dependent on the number of SILAR cycles n. An insufficient or excess amount of semiconductor absorber material leads to low efficiencies. Fig. 4 displays the J–V curves for Ag8SnS6 QDSSCs with various numbers of SILAR cycles n. The CE was Au and the electrolyte was polysulfide. Table 1 lists the photovoltaic parameters – short-circuit current density (Jsc), fill factor (FF), open-circuit voltage (Voc) and power conversion efficiency (PCE). The efficiency increased with SILAR cycles n, reaching a maximal PCE of 0.68% at n = 10 (sample no. 3), then decreased again for a larger SILAR cycle of n = 11 (sample no. 4). The optimal sample (no. 3) has the photovoltaic parameters of Jsc = 9.01 mA cm−2, open-circuit voltage Voc = 0.26 V and FF = 28.9%. These are typical results for QDSSCs prepared by SILAR. Initially, the amount of material deposited on the mp-TiO2 electrode was low, leading to insufficient solar light harvesting and low efficiencies. The deposited material increased with the SILAR cycle, leading to improved efficiencies. This result had been observed in CdS and other semiconductor solar cells as reported previously.37,38 After reaching the optimal SILAR cycle of 10, a further increase in SILAR cycle led to over-saturated material among the porous spaces within the mp-TiO2 matrix, which hindered the flow of liquid electrolyte and led to a reduced efficiency.| Sample no. | SILAR cycle | Jsc (mA cm−2) | V (V) | FF (%) | PCE (%) |
|---|---|---|---|---|---|
| 1 | 6 | 7.29 | 0.19 | 34.07 | 0.47 |
| 2 | 9 | 7.77 | 0.20 | 32.45 | 0.50 |
| 3 | 10 | 9.01 | 0.26 | 28.90 | 0.68 |
| 4 | 11 | 8.08 | 0.23 | 30.25 | 0.56 |
| 5 | 12 | 7.62 | 0.24 | 29.91 | 0.55 |
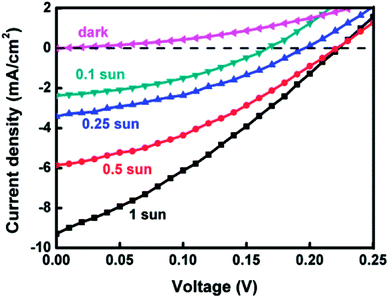
The photovoltaic performance of a QDSSC could be improved by measuring J–V curves under reduced light intensities. Fig. 5 displays the J–V curves of the best Ag8SnS6 cell under various light intensities. The cell had an Au CE and a polysulfide electrolyte. Table 2 lists the photovoltaic parameters. As the incident light intensity was reduced from 100% sun to 10% sun, the PCE increased from 0.64% to 1.43%, a significant increase of 123%. The improved PCE is due to (a) an increase in FF from 31.3% to 39.7%, an improvement of 27%; and (b) an improvement in Jsc due to the reduction in carrier recombination (explained below). For an ideal solar cell, the current density Jsc should be linearly proportional to the number of incident photon nph. As the light intensity was reduced from 1 to 0.1 sun, the number of incident photons nph was also reduced to 0.1nph. Hence, the linear response model predicted that Jsc at 0.1 sun should equal to 9.29 mA cm−2 (1 sun) × 0.1 = 0.929 mA cm−2. However, the experimental data in Table 2 shows a much higher Jsc of 2.25 mA cm−2 under 0.1 sun. Semiconductor nanocrystals prepared by SILAR inherently contain a large number of surface defects, which act as recombination sites for photocarriers. The mechanism of recombination can be revealed by analyzing the dependence of Jsc on light intensity I0. Analysis of the data in Table 2 yielded a sublinear relation: Jsc ∝ I0α where α = 0.67. Nelson has explained the sublinear Jsc–I0 relation in terms of the multiple trapping model for carrier recombination.39 A solar cell with multiple trapping would experience reduced carrier recombination at low light intensities and yield improved performance. The most important effect of low light intensities is the increase in electron lifetime τn under low light. Miyashita et al. and A. C. Fisher et al. had observed in dye-sensitized solar cells that τn increased by ∼3–10 times as the light intensity was decreased from 100 to 10% sun.40,41 The significantly improved performance under low light intensities indicates that carrier recombination is the limiting process in the liquid-junction Ag8SnS6 sensitized solar cell at high incident light intensities. The competition between recombination and extraction of free charges determines FF, Jsc and inturn the PCE of the cell. At low light intensities, the charge carrier recombination process is reduced, which improves the charge extraction process and the performance of the solar cell.42
| Sun intensity | Jsc (mA cm−2) | Voc (V) | FF (%) | η (%) |
|---|---|---|---|---|
| 100% | 9.29 | 0.23 | 31.3 | 0.64 |
| 50% | 5.85 | 0.22 | 35.4 | 0.92 |
| 25% | 3.42 | 0.19 | 36.6 | 0.96 |
| 10% | 2.25 | 0.16 | 39.7 | 1.43 |
Reducing light intensities also has an effect on Voc. As seen in Table 2, Voc decreased monotonically with light intensity. As the light intensity decreased from 100% to 10% sun, Voc decreased from 0.23 to 0.16 V. This can be explained as follows. The theoretical maximal Voc of a QDSSC is the difference between the quasi Fermi level EF of TiO2 and the redox potential Eredox of the electrolyte, i.e.,
| Voc = EF − Eredox. | (2) |
The Fermi level EF depends on the electron density nCB in the conduction band (CB) of TiO2 according to:43
EF = kBT![[thin space (1/6-em)]](https://www.rsc.org/images/entities/char_2009.gif) ln(nCB) ln(nCB) |
A reduced light intensity generates a reduced number of photoelectrons nCB, leading to a lower EF and Voc as shown in Table 2.
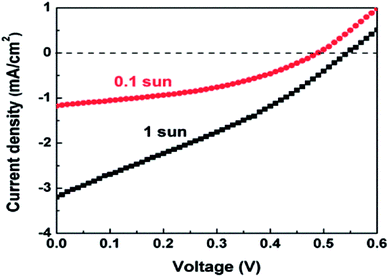
A disadvantage of the Ag8SnS6 QDSSC is that the Voc had a low value of 0.24 V, which lowered the attainable efficiency. One way to improve Voc is to use a different electrolyte. As eqn (2) indicates, a lower redox potential Eredox will produce a higher Voc. Here the polysulfide electrolyte in the Ag8SnS6 QDSSC was replaced by the cobalt electrolyte. Cobalt electrolytes have a redox level of 0.86 V relative to NHE (normal hydrogen electrode) whereas the polysulfide electrolyte has a redox level of −0.77 V.44 The difference is 1.57 V. The cobalt electrolyte produced a much larger Voc of 0.54 V (Table 3) under 1 sun, as compared to 0.24 V of the polysulfide electrolyte. The PCE of the cobalt-electrolyte Ag8SnS6 QDSSC is 0.53% under 1 sun. However, at the reduced light intensity of 0.1 sun, the PCE greatly increased to 2.29% (Fig. 6), which is 60% higher than that (1.43%) of the polysulfide cell.
| Light intensity | Jsc (mA cm−2) | Voc (V) | FF (%) | PCE (%) |
|---|---|---|---|---|
| 1 sun | 3.20 | 0.54 | 30.61 | 0.528 |
| 0.1 sun | 1.18 | 0.48 | 40.60 | 2.29 |
A known disadvantage of cobalt electrolytes is its low diffusion coefficient and slow kinetics for hole transfer in electrolytes, resulting a low Jsc. So the cobalt electrolyte works better under low light intensities when the small number of photoelectrons is small. A cobalt electrolyte will produce a low Jsc and a high Voc. The large gains in Voc and FF compensate loss in Jsc and increase the PCE to 2.29% under 0.1 sun.
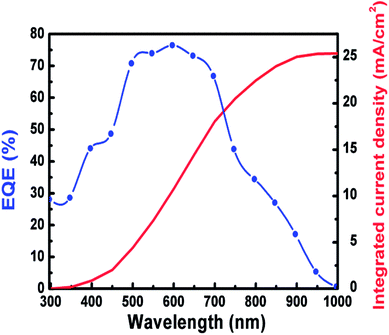
Fig. 7 displays the EQE spectrum for the best Ag8SnS6 QDSSCs in the 300–1000 nm wavelength range, where a maximum EQE value of 77% at λ = 600 nm was achieved. The cell started to produce a current at the onset wavelength of 1000 nm. The Eg of Ag8SnS6 nanocrystals, calculated from the onset wavelength of the EQE spectrum using the relation:  , is 1.24 eV, which is close to the optical Eg value of 1.41 eV shown in Fig. 4. Therefore, we conclude that the Ag8SnS6 nanocrystal has an Eg value of 1.24–1.41 eV. This Eg equals to the optimal Eg (1.4 eV) for a solar absorber, showing its potential as a solar absorber material. The area under the EQE curve represents the total integrated current density Jph generated from the solar cell. Jph can be calculated from the EQE curve using the following equation:
4. Conclusion
We demonstrated liquid-junction Ag8SnS6 QDSSCs prepared by SILAR on a mp-TiO2 electrode. The orthorhombic Ag8SnS6 nanocrystals have an Eg of 1.24–1.41 eV and an average size of 15 nm. The cell employing polysulfide electrolyte exhibited a Voc of 0.23 V, and a PCE of 1.43% at 0.1 sun. In contrast, the cell employing cobalt electrolyte yielded a higher PCE of 2.29% at 0. 1 sun. The near optimal Eg and the broad absorption band suggest that Ag8SnS6 nanocrystal could be a promising candidate material for solar cells.Conflicts of interest
There are no conflicts to declare.Acknowledgements
The authors are grateful to the financial support from the Ministry of Science and Technology of the Republic of China under grant No. MOST 106-2112-M-005-006.References
- P. V. Kamat, J. Phys. Chem. C, 2008, 112, 18737–18753 CrossRef CAS.
- A. Kongkanand, K. Tvrdy, K. Takechi, M. Kuno and P. V. Kamat, J. Am. Chem. Soc., 2008, 130, 4007–4015 CrossRef CAS PubMed.
- I. Moreels, K. Lambert, D. D. Muynck, F. Vanhaecke, D. Poelman, J. C. Martins, G. Allan and Z. Hens, Chem. Mater., 2007, 19, 3023–3030 CrossRef.
- R. D. Schaller and V. I. Klimov, Phys. Rev. Lett., 2004, 92, 186601–186604 CrossRef CAS PubMed.
- R. J. Ellingson, M. C. Beard, J. C. Johnson, P. Yu, O. I. Micic, A. J. Nozik, A. Shabaev and A. L. Efros, Nano Lett., 2005, 5, 865–871 CrossRef CAS PubMed.
- V. I. Klimov, J. Phys. Chem. B, 2006, 110, 16827–16845 CrossRef CAS PubMed.
- J. B. Sambur, T. Novet and B. A. Parkinson, Science, 2010, 330, 63–66 CrossRef CAS PubMed.
- O. E. Semonin, J. M. Luther, S. Choi, H.-Y. Chen, J. Gao, A. J. Nozik and M. C. Beard, Science, 2011, 334, 1530–1533 CrossRef CAS PubMed.
- W. A. Tisdale, K. J. Williams, B. A. Timp, D. J. Norris, E. S. Aydil and X.-Y. Zhu, Science, 2010, 328, 1543–1547 CrossRef CAS PubMed.
- T. Zdanowicz, T. Rodziewicz and M. M. Zabkowska-Waclawek, Sol. Energy Mater. Sol. Cells, 2005, 87, 757–769 CrossRef CAS.
- G. Larramona, C. Chone, A. Jacob, D. Sakakura, B. Delatouche, D. Pere, X. Cieren, M. Nagino and R. Bayon, Chem. Mater., 2006, 18, 1688–1696 CrossRef CAS.
- N. Guijarro, T. L. Villarreal, I. Mora-Seró, J. Bisquert and R. J Gómez, J. Phys. Chem. C, 2009, 113, 4208–4214 CrossRef CAS.
- V. G. Pedro, C. Sima, G. Marzari, P. P. Boix, S. Giménez, Q. Shen, T. Dittrich and I. M. Seró, Phys. Chem. Chem. Phys., 2013, 15, 13835–13843 RSC.
- Y. Itzhaik, O. Niitsoo, M. Page and G. Hodes, J. Phys. Chem. C, 2009, 113, 4254–4256 CrossRef CAS.
- A. Tubtimtae, K. L. Wu, H. Y. Tung, M. W. Lee and G. J. Wang, Electrochem. Commun., 2010, 12, 1158–1160 CrossRef CAS.
- S. L. Castro, S. G. Bailey, R. P. Raffaelle, K. K. Banger and A. F. Hepp, J. Phys. Chem. B, 2004, 108, 12429–12435 CrossRef CAS.
- T. Torimoto, T. Adachi, K. I. Okazaki, M. Sakuraoka, T. Shibayama, B. Ohtani, A. Kudo and S. Kuwabata, J. Am. Chem. Soc., 2007, 129, 12388–12389 CrossRef CAS PubMed.
- P. C. Huang, W. C. Yang and M. W. Lee, J. Phys. Chem. C, 2013, 117, 18308–18314 CrossRef CAS.
- W. C. Yang and M. W. Lee, J. Electrochem. Soc., 2014, 161, H92–H96 CrossRef CAS.
- C. L. Chou, N. Suriyawonga, B. Aragawa, J. B Shib and M. W. Lee, J. Electrochem. Soc., 2016, 163, H445–H449 CrossRef CAS.
- Z. Jia, Q. Chen, J. Chen, T. Wang, Z. Li and X. Dou, RSC Adv., 2015, 5, 28885–28891 RSC.
- H. D. Shelke, A. C. Lokhande, J. H. Kim and C. D. Lokhande, J. Colloid Interface Sci., 2017, 506, 144–153 CrossRef CAS PubMed.
- Q. Chen, X. Dou, Z. Li, Y. Ni, J. Chen, F. Zhou, Y. Yamaguchi and S. Zhuang, Optik, 2014, 125, 3217–3220 CrossRef CAS.
- Y. Chen, L. Ma, Y. Yin, X. Qian, G. Zhou, X. Gu, W. Liu, X. Wu and F. Zhang, J. Alloys Compd., 2016, 672, 204–211 CrossRef CAS.
- C. L. Lu, Z. Lin, Y. W. Zhang, S. Y. Liu and M. Yang, Chin. Phys. B, 2015, 24, 017501 CrossRef.
- C. An, K. Tang, G. Shen, C. Wang, L. Huang and Y. Qian, Mater. Res. Bull., 2003, 38(5), 823–830 CrossRef CAS.
- B. Li, Y. Xie, J. Huang, H. Su and Y. Qian, J. Solid State Chem., 2000, 149(2), 338–340 CrossRef CAS.
- Q. Li, Y. Ding, X. Liu and Y. Qian, Mater. Res. Bull., 2001, 36, 2649–2656 CrossRef CAS.
- B. H. Shambharkar and A. P. Chowdhury, RSC Adv., 2016, 6, 10513–10519 RSC.
- M. Deng, S. Shen, Y. Zhang, H. Xu and Q. Wang, New J. Chem., 2014, 38, 77–83 RSC.
- Q. He, S. Huang, C. Wang, Q. Qiao, N. Liang, M. Xu, W. Chen, J. Zai and X. Qian, ChemSusChem, 2015, 8, 817–820 CrossRef CAS PubMed.
- W. Q. Hu, Y. F. Shi and L. M. Wu, Cryst. Growth Des., 2012, 12, 3458–3464 CrossRef CAS.
- K. W. Cheng, W. T. Tsai and Y. H. Wu, J. Power Sources, 2016, 317, 81–88 CrossRef CAS.
- T. Ghrib, A. L. A. Otaibi, M. A. Almessiere, I. B. Assaker and R. Chtourou, Chin. Phys. Lett., 2015, 32, 127402 CrossRef.
- L. Zhu, Y. Xu, H. Zheng, G. Liu, X. Xu, X. Pan and S. Dai, Sci. China Mater., 2018, 61, 1549–1556 CrossRef.
- A. L. Patterson, Phys. Rev., 1939, 56, 978–982 CrossRef CAS.
- M. Ganjian, M. Kolahdouz, A. Aletayeb, M. Norouzi, P. Ebrahimi, S. Pourjafari and M. S. S. Mousavi, Vacuum, 2017, 146, 548–553 CrossRef CAS.
- M. Marandi, E. Rahmani and F. A. Farahani, J. Electron. Mater., 2017, 46, 6769–6783 CrossRef CAS.
- J. Nelson, S. A. Haque, D. R. Klug and J. R. Durrant, Phys. Rev. B: Condens. Matter Mater. Phys., 2001, 63, 205321–205329 CrossRef.
- M. Miyashita, K. Sunahara, T. Nishikawa, Y. Uemura, N. Koumura, K. Hara, A. Mori, T. Abe, E. Suzuki and S. Mori, J. Am. Chem. Soc., 2008, 130, 17874–17881 CrossRef CAS PubMed.
- A. C. Fisher, L. M. Peter, E. A. Ponomarev, A. B. Walker and K. G. U. Wijayantha, J. Phys. Chem. B, 2000, 104, 949–958 CrossRef CAS.
- D. Bartesaghi, I. C. Pérez, J. Kniepert, S. Roland, M. Turbiez, D. Neher and L. J. A. Koster, Nat. Commun., 2015, 6, 7083 CrossRef CAS PubMed.
- J. Nelson, The Physics of Solar Cells, Imperial College Press, London, 2003, p. 59, DOI:10.1142/p276.
- F. Hao, P. Dong, Q. Luo, J. Li, J. Lou and H. Lin, Energy Environ. Sci., 2013, 6, 2003–2019 RSC.
Footnote |
| † Electronic supplementary information (ESI) available. See DOI: 10.1039/c8ra08734b |
| This journal is © The Royal Society of Chemistry 2018 |

