 Open Access Article
Co-metabolism kinetics and electrogenesis change during cyanide degradation in a microbial fuel cell
Hao Wu ab,
Ya-li Feng
 *a,
Hao-ran Lib,
Hong-jun Wanga and
Jun-jie Wangb
aSchool of Civil and Resource Engineering, University of Science and Technology Beijing, Beijing, China. E-mail: ylfeng126@126.com
bState Key Laboratory of Biochemical Engineering, Institute of Process Engineering Chinese Academy of Sciences, Beijing, China
First published on 4th December 2018
Abstract
The co-metabolic degradation kinetics, microbial growth kinetics and electricity generation capacity were researched of strain MC-1 in a MFC (microbial fuel cell). The results show that Haldane and Aiba models suit the growth kinetics of a single substrate (sodium acetate) MFC with 0.995 correlation coefficient. Moreover, the Haldane model was appropriate to describe the growth kinetics of a single substrate (sodium cyanide) MFC with 0.986 correlation coefficient. The growth kinetics of a mixed substrate MFC can be explained well by the SKIP model with correlation coefficient 0.995. Second order and three-half order models were found to suitably describe the cyanide degradation process. The maximum output voltage of MFC and the cyanide degradation efficiency were significantly enhanced by using sodium acetate and cyanide as mixed substrates. Also, the trend of electricity production is related to the growth cycle of microorganisms in a MFC.
1. Introduction
Cyanide leaching is the effective process for gold extraction in industry,1 but the resulting cyanide wastewater has brought potential hazards to the environment and human health.2 In recent years, with the increasing intensity of gold resource development and the growing requirement for environmental protection, it has become urgent to treat wastewater containing cyanide efficiently. Several purification methods3 have been developed for effective removal of cyanide from effluent, such as acidification recovery,4 the alkaline-chlorination process,5 hydrogen peroxide oxidation,6 and the SO2/air (INCO) process.7 However, chemical and physical decontamination has numerous disadvantages comprising the high expense, low removal rate, difficulty in reaching the effluent standard, and secondary pollution.In the past, some microbial species have been proved to grow utilizing cyanide as the source of carbon and nitrogen.8 These microorganisms9–11 use a variety of enzymatic pathways to destruct or convert cyanide to less hazardous products, such as ammonia, formic acid, carbon dioxide, methane, and carboxylic acid. Wastewater was decontaminated to be recycled back to mineral leaching circuits or disposed of into surface waters. Microbiological treatments of cyanide degradation and wastewater purification by microbial species (bacteria, fungi, protozoa, algae, and yeast) have been researched extensively, and remarkable results have been achieved.12 Compared with the existing chemical and physical treatment technologies, the biological treatment process present advantages, such as low costs, environment-friendly, more efficient and non-secondary pollution.13 It was demonstrated that biological processes are sustainable and economically viable.
Microbial fuel cell (MFC) is a research hotspot in the field of environment, biology and energy in recent years.14 Microbial fuel cells convert the chemical energy of organic compounds into electrical energy using microorganisms as catalysts, both purposes of wastewater treatment and electrical energy production can be achieved.15 At present, MFC research mainly focuses on organic wastewater, such as trichlorophenol,16 furfural,17 landfill leachate,18 brewery wastewater19 and so on. Few studies have been conducted on the MFC to degrade cyanide-containing wastewater and produce electric energy simultaneously, although there are many studies on the biodegradation of cyanide-containing wastewater. Feng Ya-li20 isolated a facultative anaerobic bacterium (MC-1) which can produce electricity and degrade cyanide. Moreover, it was applied in the microbial fuel cell to purify cyanide-containing wastewater by co-metabolism of glucose with cyanide.
However, the high concentration of cyanide has adverse effects on the growth of microorganisms, thus affecting the degradation ratio of cyanide and the electricity generation performance of microbial fuel cells. Therefore, it is necessary to explore the inhibition effect of microbial growth and power generation performance by variety concentrations cyanide. Furthermore, the relationship was investigated between the cyanide degradation and the power generation performance. In this research, the co-metabolic degradation kinetics of sodium cyanide (as a non-growth substrate) and sodium acetate (as a growth substrate) was studied by using Klebsiella sp. (MC-1). Microbial growth kinetics and electricity generation capacity also were researched through condition test and dynamic simulation. The cyanide degradation and electricity generation performance could be accounted by the obtained theoretical principle, which could be used to increase performance and efficiency of MFC.
2. Materials and methods
2.1 Growth medium and microorganism
Klebsiella sp. (MC-1), a laboratory preserved strain, was used as an experimental strain. The isolation procedure and microbial character have been reported by previous research.20 The composition of the synthetic medium used in the study was: sodium acetate (1.6 g L−1), KCl (0.13 g L−1), NaCl (1 g L−1), NH4Cl (0.1 g L−1), KH2PO4 (2 g L−1), K2HPO4 (4.5 g L−1), Wolfes' trace mineral solution (10 mL L−1) and Wolfes' vitamin solution (10 mL L−1). The microorganism was grown and enriched in the medium. The anodic solution contained KC1 (0.1 g L−1), NaCl 2.9 g L−1, NaH2PO4 0.6 g L−1, NaHCO3 2.5 g L−1, Wolfes' trace mineral solution (10 mL L−1) and Wolfes' vitamin solution (10 mL L−1).2.2 MFC construction and operation
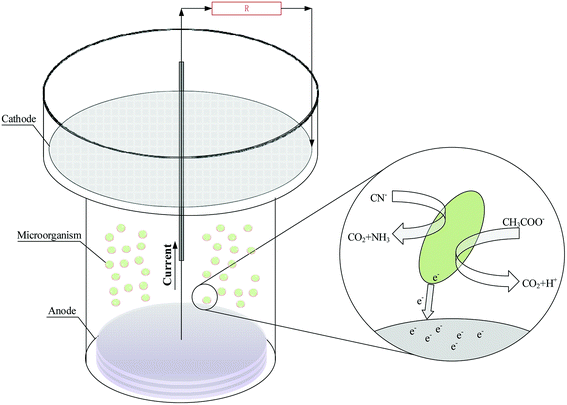
The structure of the single chamber MFC reactor is shown in Fig. 1. The cathode electrode and anode electrode were respectively made of 1.5 mm (thickness) and 5 mm (thickness) disc graphite felt, and their shallow areas respective were 95.0 cm2 and 43.0 cm2. The surface of cathodic graphite felt was coated with Nafion solution and platinum–carbon catalyst. Titanium wire was used for the connection of the external circuit to the electrodes. After the MFC reactor was assembled, the mixed liquid which ratio of bacterial solution to anode solution is 1![[thin space (1/6-em)]](https://www.rsc.org/images/entities/char_2009.gif) :
:![[thin space (1/6-em)]](https://www.rsc.org/images/entities/char_2009.gif) 3 was added to the MFC reactor until the liquid swamped the cathode. As adding the required concentration of substrate (sodium acetate or sodium cyanide) in MFC reactors, reactors were operated in a temperature-controlled room at 25 °C. Moreover, cell voltages were measured every 5 min using a data acquisition system (RBH8223H, Ribohua Co.) across an external resistance of 510 Ω.
3 was added to the MFC reactor until the liquid swamped the cathode. As adding the required concentration of substrate (sodium acetate or sodium cyanide) in MFC reactors, reactors were operated in a temperature-controlled room at 25 °C. Moreover, cell voltages were measured every 5 min using a data acquisition system (RBH8223H, Ribohua Co.) across an external resistance of 510 Ω.
2.3 Analysis of substrate concentration and biomass
Biomass in MFC reactor was calculated by optical density (OD) measurement method. Biomass concentration in MFC reactor was observed by measuring its absorbance at 600 nm wavelength using a UV-Visible Spectrophotometer (UV-1780). 2 mL sample volume was taken from MFC reactor into a centrifuge tube and centrifuge at 4000 rpm for 10 min. The precipitate obtained was washed twice with sterile distilled water and dried thoroughly in an oven. The dry biomass obtained was diluted to the appropriate concentration, and OD600 value of dilutions were measured. Each experiment was repeated three times, and the average values were used to get correct experimental values. The relationship between OD600 and biomass concentration was established through a calibration curve. So, the Biomass concentration of the unknown solution can be measured by this relationship.Cyanide concentration in biomass free supernatant was analyzed quantitatively at 600 nm using the isonicotinic acid-barbituric acid method by a UV-Visible Spectrophotometer. The sodium acetate content in the biomass free samples was determined quantitatively using ion chromatography by an ion chromatograph (Aquion ICS, USA).
2.4 Mathematical model
Co-metabolism recently has emerged as a powerful method for the biodegradation of refractory pollutants.21 The microbial degradation efficiency of refractory compounds could be improved by altering the substrate structure of carbon and energy sources.22 Co-metabolic kinetics was modelled for better understanding the effect of cyanide (non-growth substrate) and sodium acetate (growth substrate) on the microbial growth, which could also explore the interaction between cyanide and sodium acetate in the process of co-metabolism.23 Microbial growth kinetics and substrate degradation kinetics in the co-metabolism process were fitted using nonlinear least squares method by Origin 8.5. The adopted models along with their mathematical form have been described below. In the early 1940s, Monod24 model was proposed, which relates specific growth rate (μ) and substrate concentration (CS) of a single growth controlling substrate represented by the eqn (1).
 | (1) |
Powell25 revised the Monod equation by introducing the maintenance rate (m). But Powell and Monod models do not consider the effect of self-inhibition, which all were non-inhibition dynamics models.
 | (2) |
To account for deficiency of the above models, an improved model (Haldane) was proposed which contains the substrate inhibition effect. Owing to its importance and mathematical simplicity, the Haldane model26 was commonly accepted by researchers. The Model equation is shown in eqn (3), where K1 is the substrate inhibition constant (mg L−1).
 | (3) |
Based on the ideal growth state of microorganism, Levenspiel27 proposed a kinetic model of substrate inhibition as eqn (4). The model calculates the values of the critical inhibitor concentration (Sm). Above the value of Sm, the culture growth is completely inhibited.
 | (4) |
Considering the diffusion-controlled substrate, Teissier28 proposed an exponential kinetic model (eqn (5)).
 | (5) |
Aiba model29 (eqn (6)) which correlates the growth inhibition data with substrate degradation was also proposed.
 | (6) |
The above models are all inhibition kinetic models of the single substrate. To further analyze the synchronous effect of the non-growth substrate (cyanide) and growth substrate (sodium acetate) on microbial growth, the SKIP (Sum Kinetics with Interaction Parameters) model30 was adopted to simulate co-metabolism.
 | (7) |
In addition to the growth kinetics of substrate inhibition, the degradation of cyanide in co-metabolism MFC was modelled using zero order, pseudo-first, pseudo-second and three-half order equations,31,32 the equations of these models are given in Table 1.
Where k0, k1, k2, k3,1, and k3,2 are rate constants of zero-order, first-order, second-order, three-half order respective, X0 is the initial biomass concentration in MFC reactor, S0 is the initial substrate concentration (mg L−1) in MFC reactor.
3. Results and discussion
Biomass concentration, substrate concentration, and cell voltage were measured to study the process of cyanide degradation and electrogenesis change in MFC reactor. Moreover, the effect of substrate concentration on microbial growth was researched by kinetic fitting. Then, the degradation efficiency of cyanide in MFC reactor was analyzed, and the kinetics of cyanide degradation was modelled.3.1 Process research of MFC
In the field of cyanide bio-degradation, more than 50 strains of cyanide degrading microorganism have been obtained. All of these bacterial strains have high tolerance and degradability to cyanide, but there are few reports on whether they can produce electricity. The MC-1 is an effective cyanide-degrading and electricity-producing bacterial strain, which can achieve wastewater purification and energy recovery simultaneously in the running process of MFC. Firstly, the variation of substrate concentration and microbial concentration during the operation of MFC was studied.Fig. 2 shows the relationship between biomass and growth substrate (1640 mg L−1 sodium acetate) during operation of MFC. As can be know from Fig. 2, the consumption of substrate (sodium acetate) gradually increases with the growth of strain MC-1. In the lag phase (0–6 h) of strain MC-1, the consumption ratio of sodium acetate was low (1.19%), due to weak metabolic activity of strain MC-1. After 12 hours, the strain MC-1 reproduced rapidly and entered the logarithmic growth phase, with the increasing consumption ratio of sodium acetate. The highest cell density (OD600 0.965) was achieved at about 30 h when the strain entered in the stationary phase. Strain grew into the decline phase because of lacking nutrition and insufficient substrate as MFC operate 90 h. The degradation of sodium acetate was coupled with the growth of the strain MC-1. The removal ratio of sodium acetate reached 95.23% at 111 h, which was because of the biodegradation of the strain MC-1.
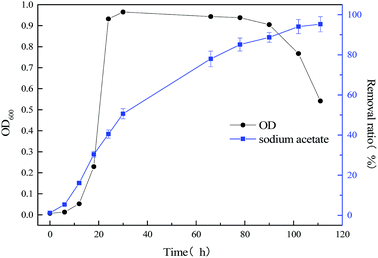 | ||
| Fig. 2 Relationship between bacterial concentration and substrate degradation of the single substrate (1640 mg L−1 sodium acetate) MFC. | ||
The relationship between biomass and growth substrate (60 mg L−1 sodium cyanide) during operation of MFC was shown in Fig. 3. By comparing Fig. 2 and 3, the microbial lag phase of the single substrate (60 mg L−1 sodium cyanide) MFC is longer, which last for 15 hours. And during the logarithmic growth phase (15–50 h), the growth rate of strain MC-1 was relatively slow. When the MFC operated 60 h and the strain entered in stationary phase, the highest cell density of strain MC-1 was only 0.067. By contrast, the stationary phase was short, which maintained only 12 h. The degradation efficiency of cyanide was lesser 63.12%, as the MFC operate ended at 78 h.
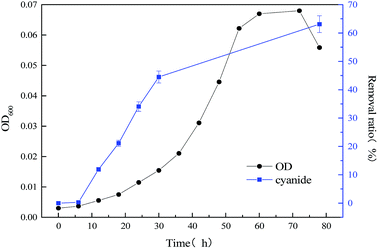 | ||
| Fig. 3 The relationship between bacterial concentration and substrate degradation of the single substrate (60 mg L−1 sodium cyanide) MFC. | ||
To improve the degradation efficiency of substrate cyanide, the co-metabolism process of mixed substrates by MFC was studied. The relationship between bacterial concentration and substrate degradation of mixed substrate, which components are 1640 mg L−1 sodium acetate +20 mg L−1 sodium cyanide and 1640 mg L−1 sodium acetate +60 mg L−1 sodium cyanide, were respectively shown in Fig. 4 and 5. By comparing with the data in Fig. 3 and 4, it is found that slight effect on strain growth and sodium acetate degradation was brought as adding 20 mg L−1 sodium cyanide into the single substrate (1640 mg L−1 sodium acetate) MFC. But, the degradation ratio of cyanide can be significantly improved from 63.12% to 98.76% in an operation cycle of MFC. With the non-growth substrate increased from 20 mg L−1 to 60 mg L−1, the maximum value of optical density decreased from 0.965 to 0.505, which indicate strain growth was inhibited. When the initial concentration of substrate sodium cyanide increased to 60 mg L−1, the final degradation ratio of mixed substrates was hardly affected, although the degradation cycle was longer (111 h at 20 mg L−1 vs. 228 h at 60 mg L−1 of cyanide). And meanwhile, the close removal trend of sodium acetate and cyanide indicated that MC-1 bacteria utilized mixed substrates simultaneously.
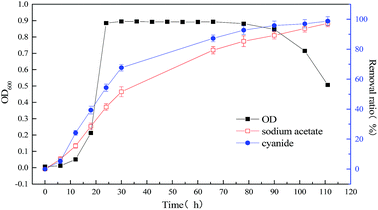 | ||
| Fig. 4 Relationship between bacterial concentration and substrate degradation of mixed substrate (1640 mg L−1 sodium acetate +20 mg L−1 sodium cyanide) MFC. | ||
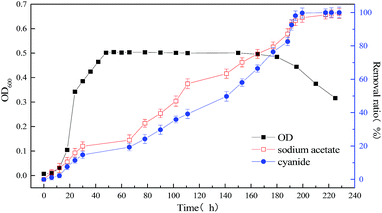 | ||
| Fig. 5 Relationship between bacterial concentration and substrate degradation of mixed substrate (1640 mg L−1 sodium acetate +60 mg L−1 sodium cyanide) MFC. | ||
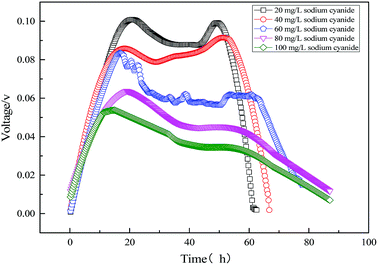
Fig. 6 shows the electricity voltage output obtained from the MFC using sodium acetate, sodium acetate-cyanide mixtures, and cyanide. It can be seen that the maximum voltage from MFC decreased with the increase of initial cyanide concentration. The maximum voltage of MFC was 526 mV with 1640 mg L−1 sodium acetate and 20 mg L−1 cyanide as mixed substrates, which is close to the maximum voltage using sodium acetate as substrate alone. It indicates that the low concentration of cyanide (<20 mg L−1) has little effect on electricity production in MFC. With the increase of cyanide concentration, the maximum output voltage of MFC gradually decreases, but the cycle of electricity production gradually prolongs. It is mainly because the toxicity of cyanide inhibits the growth of organisms, which leads to the slow metabolism of strain MC-1. When 60 mg L−1 cyanide was used as a single substrate, the maximum voltage of MFC only reached 83 mV at 15 hours. When 60 mg L−1 cyanide was used as a single substrate, the maximum voltage of MFC only reached 83 mV at 15 hours. Using sodium acetate and cyanide as mixed substrates, the maximum output voltage of MFC and the cyanide degradation efficiency were significantly higher than those of single cyanide substrate. It is the major reason that microbial metabolism will be promoted by easily biodegradable organic compounds (sodium acetate), despite the inhibition of cyanide.
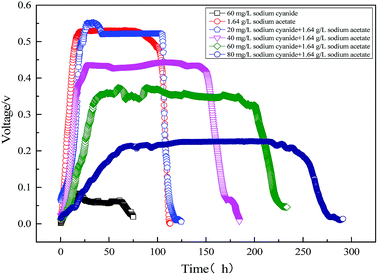 | ||
| Fig. 6 Electricity voltage output obtained from the MFC using sodium acetate, sodium acetate-cyanide mixtures and cyanide. | ||
3.2 Modeling the kinetics of the strain growth in MFC reactor
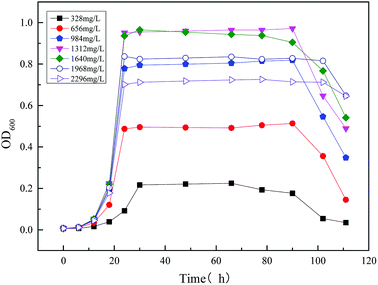
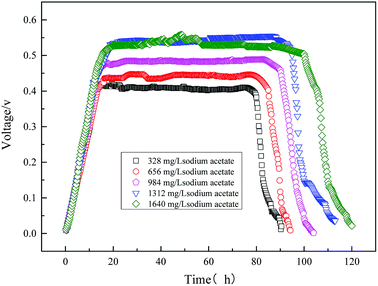
The initial concentration of the substrate directly affects the output voltage of the MFC. It is illustrated in Fig. 8 where the output voltage of the MFC is plotted against time for various sodium acetate concentrations. It can be seen that the trend of the output voltage is consistent with the microbial growth curve. Output voltage gradually increased during the logarithmic growth phase, and the voltage was output stable in the stationary phase. As the initial substrate sodium acetate was 1640 mg L−1, the maximum output voltage of MFC was highly 558 mV.
To study the strain growth kinetics in mono substrate (sodium acetate) system, deterministic substrate growth kinetic models were applied. The predicted values of kinetic parameters are summarized in Table 2. The suitability of growth kinetic models in calculating the specific growth rate of mono substrate (sodium acetate) system is represented in Fig. 9.
| Models | Model parameters | ||||||
|---|---|---|---|---|---|---|---|
| μmax | KS | K1 | m | n | Sm | R2 | |
| Monod | 0.274 | 257.925 | — | — | — | — | 0.842 |
| Powell | 0.261 | 0.871 | — | 45.088 | — | — | 0.893 |
| Haldane | 0.563 | 959.831 | 2184.504 | — | — | — | 0.995 |
| Levenspiel | 0.456 | 690.924 | — | — | 0.59 | 4374.906 | 0.993 |
| Teissie | 0.319 | 505.959 | 7143.681 | — | — | — | 0.994 |
| Aiba | 0.593 | 955.037 | 3747.526 | — | — | — | 0.995 |
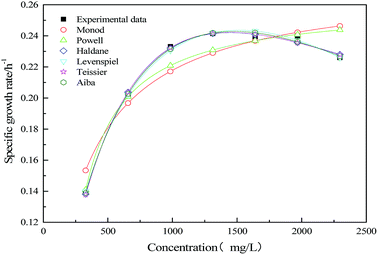 | ||
| Fig. 9 Comparison of experimental and predicted the specific growth rate of mono substrate (sodium acetate) system. | ||
The inhibitory effect of excessive substrate on specific growth rate was observed. Since Monod and Powell model did not consider the substrate inhibition effect, the growth of strain in MFC could not be better fitted appropriately. For Haldane, Aiba model, the obtained values of the correlation coefficient (R2 = 0.995) indicate that the model have a relatively good agreement with the experimental data. The maximum specific growth rates of MFC using the single substrate (sodium acetate) were obtained as alike 0.563 and 0.593. The value of critical substrate concentration (Sm = 4374.906 mg L−1) was obtained from Levenspiel model, which indicates that the strain growth would be completely inhibited in the MFC at the initial concentration of 4374.906 mg L−1.
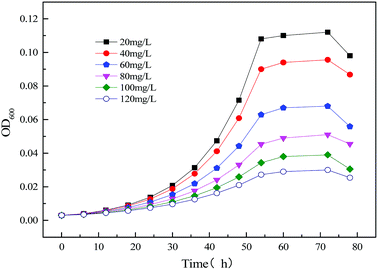
The electricity voltage output obtained from the MFC using varying sodium cyanide is shown in Fig. 11. As can be seen from Fig. 11, the output voltage of the single substrate (sodium cyanide) MFC is lower than that of the single substrate (sodium acetate) MFC. When the initial concentration of sodium cyanide is 20 mg L−1, the maximum output voltage is only 108 mV. Also with the increase of initial sodium cyanide, the maximum output voltage of MFC decreases. Excessive cyanide leads to the slowing microbial metabolism and cellular respiration, which reduces the electron transport rate of the anode and lowers the electricity production performance.
Fig. 12 shows the specific growth rate by measuring and model predicting. The kinetic parameters obtained from the models are shown in Table 3. From the figure and table, it could be obtained that the Haldane model was fit the data well. The value of the correlation coefficient was 0.986. According to the fitting results, with the increasing concentration of the initial substrate sodium cyanide, the specific growth rate of strain increased first and then decreased. When the initial concentration of sodium cyanide substrate was about 25 mg L−1, the growth of strain began to be inhibited. And as the initial concentration of sodium cyanide increased to 243.287 mg L−1, the growth of strain was completely inhibited.
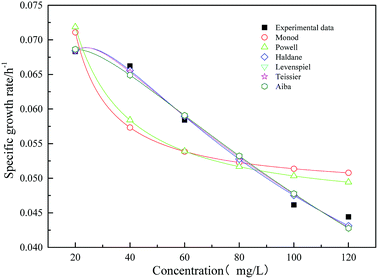 | ||
| Fig. 12 Comparison of experimental and predicted specific growth rate of mono substrate (sodium cyanide) system. | ||
| Models | Model parameters | ||||||
|---|---|---|---|---|---|---|---|
| μmax | KS | K1 | m | n | Sm | R2 | |
| Monod | 0.048 | −6.482 | — | — | — | — | 0.563 |
| Powell | 0.045 | −0.00092 | — | 58.459 | — | — | 0.542 |
| Haldane | 0.11 | 7.073 | 80.968 | — | — | — | 0.986 |
| Levenspiel | 0.075 | 0.28 | — | — | 0.83 | 243.287 | 0.956 |
| Teissie | 0.081 | 187.943 | 6.967 | — | — | — | 0.981 |
| Aiba | 0.087 | 174.547 | 2.577 | — | — | — | 0.974 |
Fig. 13 shows the time profiles of biomass output (OD600) using mixed substrates which are composed of 1640 mg L−1 sodium acetate and varying concentrate sodium cyanide. As can be seen from the diagram, the trend of electricity production is related to the growth cycle of microorganisms in MFC. The specific growth rate of microorganism was less affected at low concentration cyanide (<20 mg L−1), while the high initial concentration of cyanide will produce an inhibitory effect. Sodium cyanide will inhibit the metabolism of strain MC-1, resulting in the prolonged stationary phase and growth cycle.34
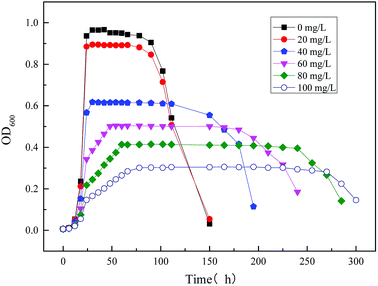 | ||
| Fig. 13 Time profiles of biomass output (OD600) at different initial concentrations of mixed substrates. | ||
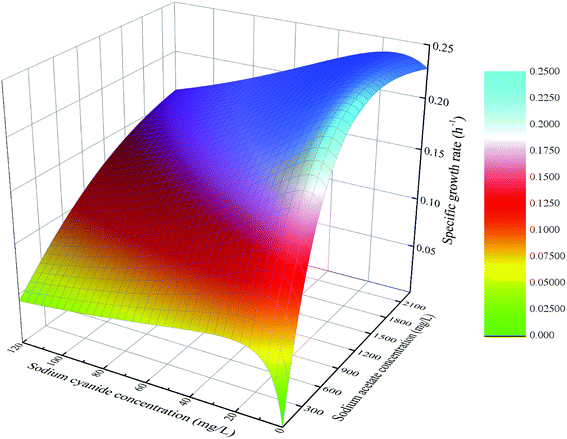
For the microbial growth in the MFC system using mixed substrates, SKIP model was used to obtain the model parameters (Table 4) and equation (formula (12)). The interaction parameters I2,1 and I1,2 (I2,1 = 42.735, I1,2 = 0.0109) indicate that sodium cyanide has a strong inhibitory effect on the degradation of sodium acetate, but sodium acetate does not have an obvious inhibitory effect on the degradation of sodium cyanide.
 | (12) |
| Model parameter | I2,1 | I1,2 | R2 |
|---|---|---|---|
| Value | 42.735 | 0.0109 | 0.995 |
The fitting function of eqn (12) was plotted, and the result was shown in Fig. 14. At the same initial concentration of substrate sodium acetate, the lower concentration of sodium cyanide (<25 mg L−1) could promote microbial specific growth rate, and the higher concentration of sodium cyanide could inhibit microbial growth. At the same initial concentration of substrate sodium cyanide, the specific growth rate of strain increased firstly and then decreased with the increasing concentration of sodium acetate. However, in the case of a higher initial concentration of sodium cyanide, the inhibition effect of the higher concentration of sodium acetate is not significant.
3.3 Modelling the removal kinetics of cyanide in MFC reactor
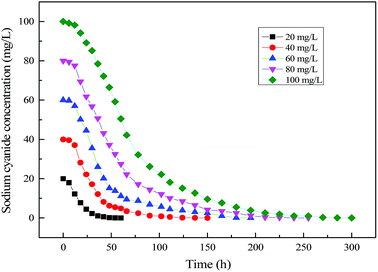
Fig. 15 shows the time profile of cyanide degradation using mixed substrates. It can be known from the figure that cyanide degradation was affected by its initial concentration in mixed substrate MFC. By calculating the rate of cyanide degradation, a maximum cyanide degradation rate could be achieved at 20 mg L−1 of Initial cyanide concentration in mixed substrates MFC. At the same time, with the increase of initial cyanide concentration, the degradation rate of cyanide decreased slightly due to the cyanide inhibition.The models include zero order, first order, second order, three-half order were applied to research degradation kinetics to understand process dynamics, and model parameters were listed in Table 5. By comparing with other models, the second order model was found to be most fitting for cyanide degradation with a high correlation coefficient (>0.99). But the first order and second order model have the shortcoming that they do not considerate the factors of bacterial growth. To overcome this limitation, Brunner35 proposed a three-half order model integrating the microbial growth and substrate degradation. Nevertheless, the correlation coefficient (0.977–0.998) of the three-half order model was slightly lower than the second order model. However, the three-half order model can also be used as a suitable model for prediction.
| Cyanide concentration (mg L−1) | Zero order model | First order model | Second order model | Three-half order model | ||||||
|---|---|---|---|---|---|---|---|---|---|---|
| K0 | R2 | K1 | R2 | K2 | KS | R2 | K3,1 | K3,2 | R2 | |
| 20 | 0.43 | 0.752 | 0.057 | 0.951 | 0.593 | −21.87 | 0.992 | 0.0124 | 0.0043 | 0.998 |
| 40 | 0.384 | 0.458 | 0.03 | 0.946 | 0.538 | −40.91 | 0.994 | 0.0102 | 0.0011 | 0.989 |
| 60 | 0.436 | 0.476 | 0.022 | 0.947 | 0.501 | −58.07 | 0.991 | 0.0058 | 0.0008 | 0.977 |
| 80 | 0.44 | 0.566 | 0.016 | 0.97 | 0.437 | −75.84 | 0.991 | 0.0096 | 0.0002 | 0.989 |
| 100 | 0.456 | 0.705 | 0.012 | 0.951 | 0.386 | −99.79 | 0.999 | 0.0034 | 0.0002 | 0.992 |
4. Conclusions
Growth kinetics and degradation kinetics of cyanide using strain MC-1 in MFC reactor were studied. By comparing the value of the correlation coefficient, Haldane and Aiba models suit the growth kinetics of single substrate (sodium acetate) MFC, the inhibitory constant of sodium acetate was 3747.526 mg L−1. Also, Haldane model was appropriate to describe the growth kinetics of single substrate (sodium cyanide) MFC, the inhibitory constant of sodium cyanide was 80.968 mg L−1. The SKIP model was discovered to explain the growth kinetics of mixed substrate MFC, and it can be concluded that sodium cyanide has a stronger inhibitory effect on the degradation of sodium acetate, rather than the other way around (I2,1 = 42.735, I1,2 = 0.0109). With the increase of cyanide concentration in mixed substrates, the growth rate of microorganisms and degradation rate of cyanide decreased in MFC, second order and three-half order models were found to suitably describe the cyanide degradation process. Meanwhile, excessive cyanide leads to a slowing of microbial metabolism and cellular respiration, which lowers electricity production performance and extends the electrogenesis cycle. Moreover, the trend of electricity production is related to the growth cycle of microorganisms in MFC. Compared with single cyanide substrate MFC, the maximum output voltage of MFC and the cyanide degradation efficiency were significantly enhanced by using sodium acetate and cyanide as mixed substrates. Co-metabolism MFC for cyanide degradation and electricity generation has broad prospects in the treatment of cyanide-containing wastewater.Conflicts of interest
There are no conflicts to declare.Acknowledgements
This research was supported by research grant from Deep-sea Biological Resources Program (project number DY135-B2-15);References
- A. D. Bas, E. Koc, E. Y. Yazici and H. Deveci, Trans. Nonferrous Met. Soc. China, 2015, 25, 597–607 CrossRef CAS.
- C. A. Johnson, Appl. Geochem., 2015, 57, 194–205 CrossRef CAS.
- C. A. Fleming, in Developments in Mineral Processing, ed. M. D. Adams and B. A. Wills, Elsevier, 2005, vol. 15, pp. 703–727 Search PubMed.
- P. A. Riveros, A. R. Molnar and F. Baša, Treatment of a high-cyanide waste solution for cyanide and metal recovery, 1996 Search PubMed.
- D. J. Wedl and R. J. Fulk, Cyanide destruction in plating sludges by hot alkaline chlorination, 1991 Search PubMed.
- L. A. C. Teixeira, M. T. C. Arellano, C. Marquez Sarmiento, L. Yokoyama and F. V. d. F. Araujo, Miner. Eng., 2013, 50–51, 57–63 CrossRef CAS.
- G. Robbins, CIM Bull., 1996, 89, 63–69 Search PubMed.
- D. Park, D. S. Lee, Y. M. Kim and J. M. Park, Bioresour. Technol., 2008, 99, 2092–2096 CrossRef CAS PubMed.
- C. Boucabeille, A. Bories, P. Ollivier and G. Michel, Environ. Pollut., 1994, 84, 59–67 CrossRef CAS PubMed.
- S. A. Raybuck, Biodegradation, 1992, 3, 3–18 CrossRef CAS PubMed.
- G. Karavaiko, T. Kondrat'eva, E. Savari, N. Grigor'eva and Z. Avakyan, Microbiology, 2000, 69, 167–173 CAS.
- X. Díaz and R. Caizaguano, in Process Metallurgy, ed. R. Amils and A. Ballester, Elsevier, 1999, vol. 9, pp. 595–605 Search PubMed.
- F. Gurbuz, H. Ciftci, A. Akcil and A. G. Karahan, Hydrometallurgy, 2004, 72, 167–176 CrossRef CAS.
- D. H. Park and J. G. Zeikus, Biotechnol. Bioeng., 2003, 81, 348–355 CrossRef CAS PubMed.
- X. Tang, K. Guo, H. Li, Z. Du and J. Tian, Bioresour. Technol., 2011, 102, 3558–3560 CrossRef CAS PubMed.
- A. Yi, Y. Feng, Z. Du and H. Li, Int. J. Electrochem. Sci., 2015, 10, 1459–1468 Search PubMed.
- Y. Luo, G. Liu, R. Zhang and C. Zhang, J. Power Sources, 2010, 195, 190–194 CrossRef CAS.
- S. Puig, M. Serra, M. Coma, M. Cabré, M. D. Balaguer and J. Colprim, J. Hazard. Mater., 2011, 185, 763–767 CrossRef CAS PubMed.
- Y. Feng, X. Wang, B. E. Logan and H. Lee, Appl. Microbiol. Biotechnol., 2008, 78, 873–880 CrossRef CAS PubMed.
- F. Ya-li, W. Wei-da, T. Xin-hua, L. Hao-ran, D. Zhuwei, Y. Zhi-chao and D. Yun-long, RSC Adv., 2014, 4, 36458–36463 RSC.
- C. T. Goudar, J. Biotechnol., 2012, 159, 56–60 CrossRef CAS PubMed.
- Q. Wang, Y. Li, J. Li, Y. Wang, C. Wang and P. Wang, Environ. Sci. Pollut. Res., 2015, 22, 565–573 CrossRef CAS PubMed.
- Y. Lv, L. Li, Y. Chen, Z. Tang and Y. Hu, Int. Biodeterior. Biodegrad., 2016, 108, 76–84 CrossRef CAS.
- J. Monod, Annu. Rev. Microbiol., 1949, 3, 371–394 CrossRef CAS.
- E. Powell, The growth rate of microorganisms as a function of substrate concentration, Her Majesty's Stationery Office, London, 1967 Search PubMed.
- J. F. Andrews, Biotechnol. Bioeng., 1968, 10, 707–723 CrossRef CAS.
- K. Han and O. Levenspiel, Biotechnol. Bioeng., 1988, 32, 430–447 CrossRef CAS PubMed.
- C. Marina, A. Kunz, M. Bortoli, L. A. Scussiato, A. Coldebella, M. Vanotti and H. M. Soares, Bioresour. Technol., 2016, 202, 33–41 CrossRef PubMed.
- S. Dey and S. Mukherjee, Int. J. Water Resour. Environ. Eng., 2010, 3, 40–49 Search PubMed.
- N. Singh and C. Balomajumder, Journal of Water Process Engineering, 2016, 11, 130–137 CrossRef.
- F. Costa, C. Quintelas and T. Tavares, Biodegradation, 2012, 23, 81–92 CrossRef CAS PubMed.
- P. Saravanan, K. Pakshirajan and P. Saha, J. Hazard. Mater., 2009, 162, 476–481 CrossRef CAS PubMed.
- K. I. Karamba, S. A. Ahmad, A. Zulkharnain, N. A. Yasid, S. Ibrahim and M. Y. Shukor, 3 Biotech, 2017, 8, 11 CrossRef PubMed.
- N. K. Sharma and L. Philip, Chem. Eng. J., 2014, 256, 255–267 CrossRef CAS.
- W. Brunner and D. D. Focht, Appl. Environ. Microbiol., 1984, 47, 167–172 CAS.
| This journal is © The Royal Society of Chemistry 2018 |

