 Open Access Article
The effect of a single injection of uniform-sized insulin-loaded PLGA microspheres on peri-implant bone formation
Xing Wang†
 *a,
Lu Wang†a,
Feng Qi
 b and
Jing Zhaoa
aShanxi Medical University School and Hospital of Stomatology, Taiyuan, 030001, China. E-mail: tt1984621@163.com; Fax: +86 03514690307
bDepartment of Mechanical and Aerospace Engineering, University of Missouri, Columbia, MO 65211, USA
First published on 4th December 2018
Abstract
Titanium implants are widely used treatment modalities, with a long list of clinical successes in orthopaedics, orthopedics and maxillofacial surgery. However, early implant loss occurs in 4.4% of patients, and to overcome this issue, bioactive factors have been generally used for improving peri-implant bone formation. Recently, the role of insulin in the improvement of bone development and physiology has attracted considerable attention. Nevertheless, one injection of insulin could not have a persistent effect in the site for bone formation because of its fast metabolism and instability, leading to limited efficacy. Moreover, the wider size distribution of microspheres frequently leads to uncontrollable insulin release, which affects preparation repeatability, drug efficacy and reliability. Herein, we developed uniform-sized insulin-loaded poly(DL-lactic-co-glycolic acid) (PLGA) microspheres for injection around the metal implant. The results demonstrated that the microspheres had narrow size distribution (Span < 0.7) and bioactive insulin was sustainedly released from the microspheres over 45 days. These insulin-loaded PLGA microspheres exhibit good bioactivity to facilitate the proliferation of human bone marrow mesenchymal stromal cells (BMSCs). Expressions of ALP, OCN and mineralized matrix formations in the insulin-loaded PLGA group were significantly higher than those in other groups. Furthermore, in rabbit mandible models, a single injection of insulin-loaded PLGA microspheres around the titanium implant showed higher peri-implant bone formation and better osseointegration, as observed by histological analysis, micro-CT and biomechanics.
1 Introduction
Titanium implants are widely used treatment modalities, with a long list of clinical success in orthopaedics, orthopedics and maxillofacial surgery.1 However, early implant loss occurs in 4.4% of patients, and to overcome this issue, bioactive factors have been generally used for improving new bone formation around implants.2,3Insulin is widely considered as a central regulator of energy homeostasis. Moreover, the broad expression of the insulin receptor suggests that the insulin function has not been fully developed.4,5 Recently, functional insulin receptors have been demonstrated to affect bone marrow mesenchymal stem cells (BMSCs) and osteoblasts.6,7 Exogenous insulin could accelerate osteogenesis through the up-regulation of PI3-K/Akt in cells.8,9 In current studies, whether exogenous insulin could enhance peri-implant bone formation remains unclear.
Given that the half-life of insulin in the human body is only 5–15 minutes,10 drug carrying microspheres are one of the possible modes to overcome this problem. The microspheres reduce injection frequency, which reduces the number of pain injections. However, very few studies have applied insulin-loaded microspheres injected around the metal implant to explore the influence of sustainedly released insulin on bone formation. This is possibly because the wide size distribution of the particles obtained by the traditional method could badly affect the preparation repeatability, drug efficacy and reliability of the study.11 Furthermore, excess insulin release may not be conducive to peri-implant bone formation and may result in adverse effects, such as hypoglycaemia or hyperinsulinemia.12
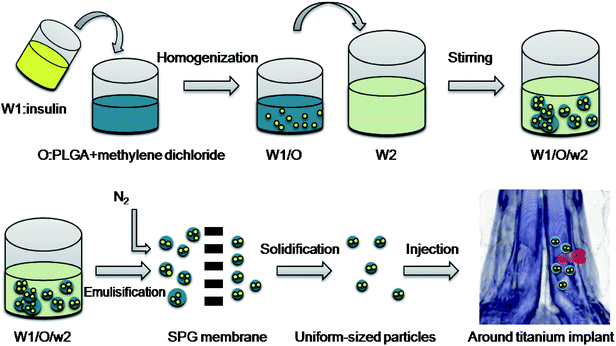
Hence, in this study, we developed uniform-sized insulin-loaded PLGA microspheres using the Shirasu porous glass (SPG) premix membrane method (Fig. 1). Then, we investigated the release behavior of insulin from the microspheres and tested the bioactivity of insulin using human BMSCs. Moreover, after a single injection of the microspheres around the titanium implants in rabbits, micro-CT, histological analysis and biomechanical assessment were performed to observe the peri-implant bone formation.
2 Materials and methods
2.1 Materials
Titanium implants (length 7 mm and diameter 3 mm) and titanium disks (diameter 10 mm and thickness 1 mm) containing grade 2 commercially pure titanium were prepared by machining (Fullerton Technology Co. Ltd., Beijing, China). Human recombinant insulin was purchased from Wako Pure Chemical Industries, Ltd (Osaka, Japan). PLGA with a molar ratio of D,L-lactide/glycolide as 75/25 (Mw 13 kDa) was provided by Lakeshore Biomaterials (Birmingham, AL, USA). Polyvinyl alcohol (PVA-217) with degree of polymerization of 1700 and degree of hydrolysis of 88.5% was obtained by Kuraray (Tokyo, Japan). SPG membranes were provided by SPG Technology Co. Ltd. (Miyazaki, Japan).2.2 Preparation of insulin-loaded PLGA microspheres
PLGA microspheres were prepared via W1/O/W2 double emulsion solvent evaporation using SPG premix membrane emulsification. Briefly, 1 mL of insulin solution (3%, w/v, W1) and 8 mL of methylene dichloride containing PLGA (10%, w/v) were mixed and homogenized (T18, IKA, Germany) at 18![[thin space (1/6-em)]](https://www.rsc.org/images/entities/char_2009.gif) 000 rpm for 60 s to form primary emulsions (W1/O). The coarse double emulsions (W1/O/W2) were formed by mixing the W1/O emulsions with an external aqueous phase (W2) containing PVA (2%, w/v) and NaCl (0.5%, w/v). Next, the W1/O/W2 emulsions were poured into a premix reservoir, and the uniform-sized droplets were obtained by extruding the coarse double emulsions through a 50.2 μm SPG membrane by N2 under 5 kPa. Then, the emulsion droplets were stirred for 12 h at room temperature to allow the solvent to evaporate. Finally, the microspheres were collected via centrifugation at 1000g and washed with distilled water 5 times. Blank PLGA microspheres were prepared using distilled water as the internal aqueous phase instead of insulin solution, and the procedure was the same as above.
000 rpm for 60 s to form primary emulsions (W1/O). The coarse double emulsions (W1/O/W2) were formed by mixing the W1/O emulsions with an external aqueous phase (W2) containing PVA (2%, w/v) and NaCl (0.5%, w/v). Next, the W1/O/W2 emulsions were poured into a premix reservoir, and the uniform-sized droplets were obtained by extruding the coarse double emulsions through a 50.2 μm SPG membrane by N2 under 5 kPa. Then, the emulsion droplets were stirred for 12 h at room temperature to allow the solvent to evaporate. Finally, the microspheres were collected via centrifugation at 1000g and washed with distilled water 5 times. Blank PLGA microspheres were prepared using distilled water as the internal aqueous phase instead of insulin solution, and the procedure was the same as above.
2.3 Measurement of particle size distribution
The particle size and particle size distribution of PLGA microspheres were measured by laser diffraction method (Mastersizer 2000, Malvern, UK). The Span value was calculated to assess the uniformity of the particle size, as follows:9where Dv,90%, Dv,50% and Dv,10% are the volume size diameters of particles at 90%, 50% and 10% of the cumulative volume, respectively.
2.4 Loading efficiency and encapsulation efficiency
Initially, 5 mg PLGA microspheres was dispersed in 10 mL NaOH solution (0.04 m) and gently shaken in an orbital shaker at 110 rpm at 37 °C for 12 hours. When the microspheres were completely degraded, the content of insulin in PLGA microspheres was determined by a Micro BCA protein assay kit (Fanbo Biochemicals, Beijing, China). The insulin loading efficiency (LE) and entrapment efficiency (EE) of the particles were calculated as follows:132.5 Surface morphology and drug distribution inside the microspheres
A scanning electron microscope (SEM, JSM-6700 F, JEOL, Tokyo, Japan) was used to observe the surface morphology of the microspheres. In order to observe the drug distribution, the insulin in PLGA microspheres was labeled with Super Fluor 488 SE (Fanbo Biochemicals, Beijing, China). Confocal laser scanning microscopy (CLSM, Leica, Germany) was used to observe the drug distribution of the PLGA microspheres.2.6 Release behavior of microspheres
Initially, 1 mg of insulin-loaded PLGA microspheres was incubated in 1 mL of phosphate buffered saline (PBS) medium and shaken at 30 rpm (pH 7.4, 37 °C). At each time point, the supernatant was collected by centrifugation (300g, 3 min) and replaced with an equal volume of fresh buffer. The concentration of insulin in the supernatant was determined using an insulin ELISA Kit (Mercodia, Uppsala, Sweden), and the supernatant was also used for cell culture. The measurements were performed in triplicate.2.7 In vitro bioactivity assessment of insulin-loaded microspheres
According to the previous protocol, human bone marrow mesenchymal stromal cells (BMSCs) were isolated from alveolar bone marrow specimens.14 The collection of human stem cell specimen was performed in accordance with the guidelines of the ethical review system of human stem cells in China and approved by the ethical review committee of Shanxi Medical University. Written informed consent was received from participants for the collection of their samples. In order to reduce the effects of other factors on BMSCs, criteria for exclusion were used.14 BMSCs were cultured in basic culture medium including minimum essential alpha medium (αMEM; Gibco, USA) with 15% fetal bovine serum (FBS, Gibco).P4 BMSCs were seeded dropwise onto each titanium disk at a density of 105 cells per cm2 and divided into four groups: blank, PLGA, Ins-PLGA and Ins. In the Ins-PLGA group, insulin released from the insulin-loaded PLGA microspheres was added to the basic culture medium. In the PLGA group, the liquid from blank PLGA microspheres was added to the basic culture medium. In the blank group, BMSCs were only cultured in the basic culture medium. In the Ins group, 0.05% insulin solution was added to the basic culture.
The effects of insulin released from the microspheres on cell proliferation were analyzed by 3-(4,5-dimethylthiazol-2-yl)-5-3-(carboxymethoxyphenyl)-2-(4-sulfophenyl)-2H-tetrazolium (MTS, Promega, WI, USA). On days 3, 7 and 14, samples were washed with PBS and transferred to 1 mL culture medium in a 4-well polystyrene culture plate. Then, 200 μL of MTS (5 mg mL−1, Sigma) was added, and the absorbance at the wavelength of 490 nm was measured using a microplate spectrophotometer (Model SPECTRA max PLUS 384).14
On days 3, 7 and 14, the supernatant was collected and replaced with an equivalent amount of corresponding fresh medium. The activity of alkaline phosphatase (ALP) was determined by a Roche diagnostic ALP Kit (Roche Diagnostics, Mannheim, Germany), following the manufacturer's instruction. Based on electrochemiluminescence immunoassay, the activity of osteocalcin (OCN) was detected by the N-MID Osteocalcin kits and analyzed on the Cobas 8000 platform (Roche Diagnostics).
After 21 days of culture, BMSCs were fixed with 2.5% glutaraldehyde, followed by Alizarin Red staining. The depositions were extracted using 10% (w/v) cetylpyridinium chloride in 10 mM sodium phosphate (pH 7.0) to quantify the amount of Alizarin Red at room temperature for 2 hours. The amount of Alizarin Red in the extraction buffer was measured by the optical density (OD) of the solution at 560 nm.15
2.8 In vivo animal experiment
2.9 Statistical analysis
The experimental data were assessed by analysis of variance and two-tailed Student's t-tests. The significance level was set at p < 0.05. All analyses were performed using SPSS 19.0 software (SPSS, Chicago, IL, USA).3 Results
3.1 Characterization of the insulin-loaded PLGA microspheres
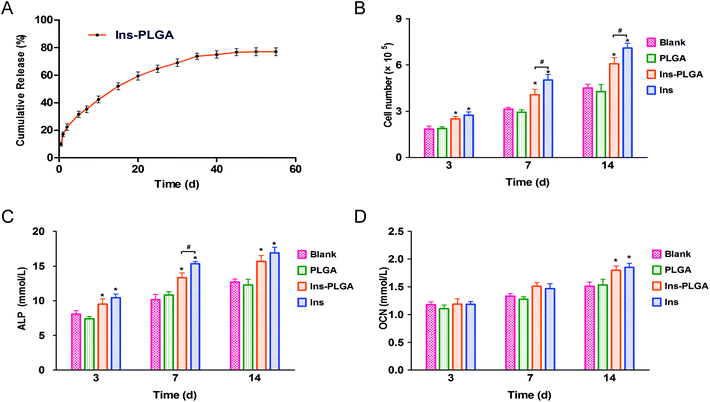
Insulin-loaded PLGA microspheres with narrow particle size distribution were successfully prepared. As shown in Fig. 2A, the PLGA microspheres have a spherical and smooth surface, and the average particle size of the PLGA microspheres was 21.53 ± 0.21 μm with a narrow size distribution (Span = 0.66) (Fig. 2B). As shown in Fig. 2C, labelled insulin (green) is uniformly distributed in the PLGA microspheres. The LE and EE are 3.3 ± 0.25% and 89.3 ± 2.32%, respectively. The insulin-loaded microspheres exhibit a low initial burst release (approximately 17% within 24 h), followed by a sustained release and reached a plateau over the next 45 days (Fig. 3A).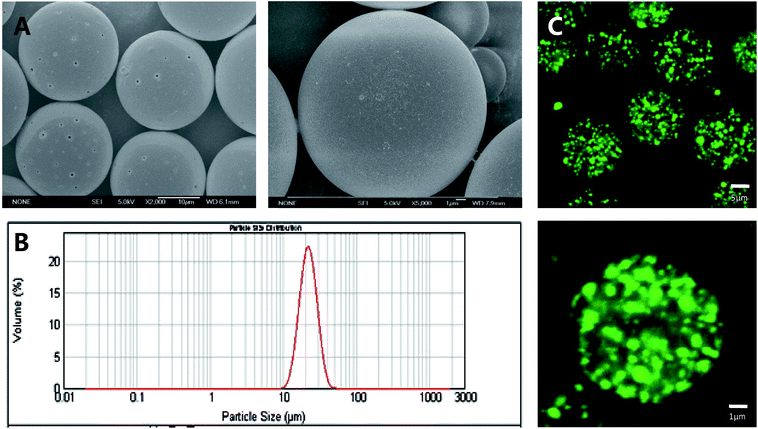 | ||
| Fig. 2 SEM images (A), size distribution (B) and CLSM images (C) of insulin-loaded PLGA microspheres. | ||
3.2 In vitro bioactivity of insulin in microspheres
The proliferation results of human BMSCs showed that the number of cells in all groups increased slowly, but after day 3, the number of cells in the Ins and Ins-PLGA groups was significantly higher than that in the blank and PLGA groups (Fig. 3B). At day 7 and 14, the number of cells in the Ins-PLGA group was significantly higher than those in the blank and PLGA groups, but lower than that in the Ins group. There was no significant difference between the blank group and the PLGA group.At day 3, the ALP concentrations in the Ins and Ins-PLGA groups were significantly higher than those in the blank and PLGA groups (Fig. 3C). At day 7, the ALP concentration in the Ins-PLGA group was significantly higher than those in the blank and PLGA groups, but was significantly lower than those in the Ins group. At day 14, the ALP concentrations in the Ins and Ins-PLGA groups were significantly higher than those in other groups, and there was no significant difference in the ALP concentrations between the Ins and Ins-PLGA groups. There were no significant differences in OCN expression among the different groups at day 3 and 7. At day 14, OCN expression levels in the Ins and Ins-PLGA groups were significantly higher than those in the blank and PLGA groups (Fig. 3D).
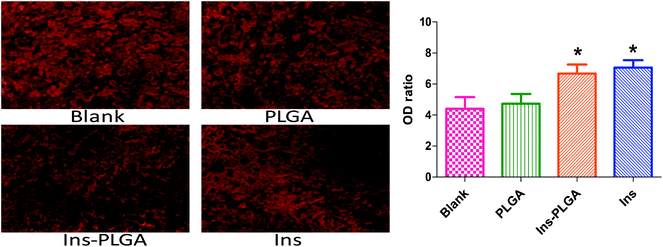
On day 21, Alizarin Red staining was used to evaluate calcium accumulation and mineralized matrix formation (Fig. 4). The optical density (OD) ratios of the four groups were distinguishable (blank: 4.46 ± 2.35, PLGA: 4.73 ± 1.90, Ins-PLGA: 6.67 ± 1.81 and Ins: 7.05 ± 1.56). The optical densities in the blank and PLGA groups were significantly lower than those in the Ins and Ins-PLGA groups. There was no significant difference between the blank and PLGA groups.
3.3 Morphometric findings in micro-CT
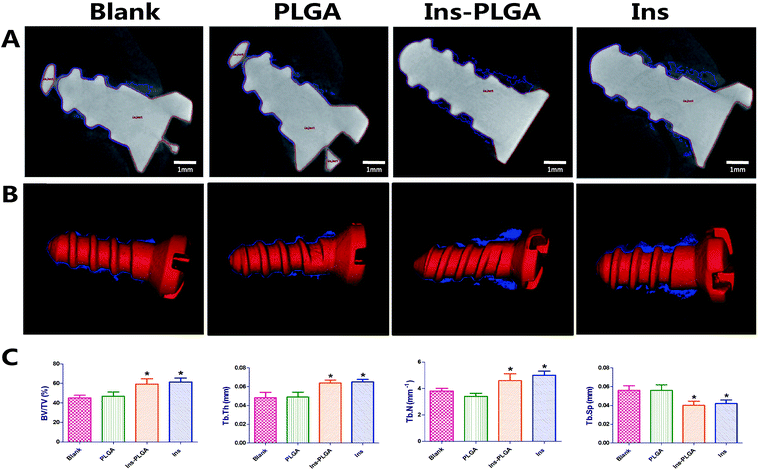
Micro-CT scanning was used to evaluate the peri-implant bone formation (Fig. 5). In the Ins and Ins-PLGA groups, massive bones surrounding the implants were identified at week 4 of post-surgery. In the blank and PLGA groups, a small amount of newly formed bone was in direct contact with the implants in the marrow space. In the 3-dimensional volume reconstruction of the images, a continuous and thicker layer of newly formed bone was observed in the Ins-PLGA group. Moreover, the implant surface was covered with thin and discontinuous bone in the blank and PLGA groups.The BV/TV values in the blank, PLGA, Ins-PLGA and Ins groups were 45.3 ± 4.5%, 46.3 ± 6.3%, 59.7 ± 7.5%, and 61.2 ± 7.0%, respectively. In the Ins and Ins-PLGA groups, newly formed bone had significantly higher values in many parameters (BV/TV, Tb.Th and Tb.N) than in the blank and PLGA groups. Moreover, the values of trabecular separation (Tb.Sp) in the Ins-PLGA and Ins groups were significantly lower than those in the blank and PLGA groups. There were no significant differences among the blank and PLGA groups.
3.4 Histological analysis and histomorphometry
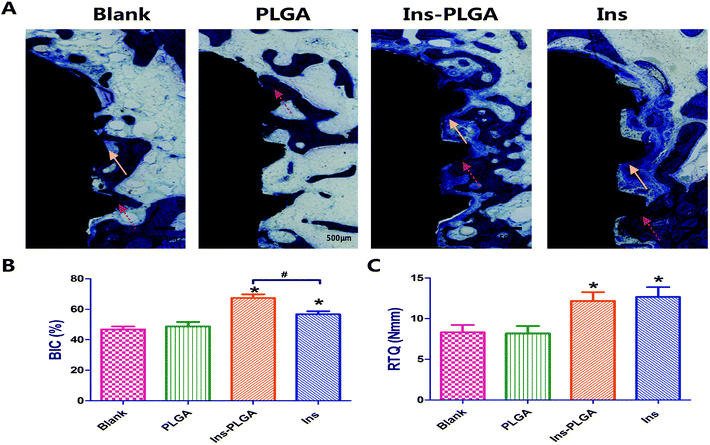
At week 4 of post-surgery, histological images were stained using toluidine blue, which distinguished the titanium implant (black staining), bone (dark blue staining) and osteoid (blue staining) distinctly (Fig. 6A). In the Ins-PLGA group, a large area of newly formed bone and osteoid was in direct contact with the surface of the implant. In the Ins group, continuous osteoid and bone covered the entire surface of the implant. In the blank and PLGA groups, a discontinuous and thinner woven bone network was observed in the blank and PLGA groups. In the histomorphometric analysis, the ratios of bone-to-implant contact (BIC) in the blank, PLGA, Ins-PLGA and Ins groups were 47.3 ± 3.5%, 48.7 ± 4.4%, 67.3 ± 4.1% and 56.6 ± 3.4%, respectively (Fig. 6B). The ratio of BIC in the Ins group was significantly higher than those in the blank and PLGA groups but was significantly lower than that in the Ins-PLGA group. There was no significant difference in BIC between the blank and PLGA groups.3.5 Biomechanical assessment
As illustrated in Fig. 6C, RTQ was observed in the blank, PLGA, Ins-PLGA and Ins groups. The results indicated that the mean RTQ values in the Ins-PLGA and Ins groups were significantly higher than those in the blank and PLGA groups. There was no statistical difference in the mean RTQ values between the Ins-PLGA and Ins groups. There was also no statistical difference in the mean RTQ values between the blank and PLGA Ins groups.4 Discussion
Titanium implants are increasingly becoming major treatment modalities for the rehabilitation of missing teeth, fractures and damaged joints. To avoid the early loosening and failure of metal implants, there is an urgent need to stimulate peri-implant bone formation to cover the entire implant at an early stage.20In this study, we introduced uniform-size PLGA microspheres as a drug delivery system to sustainedly release insulin at the targeted site. As noted in previous studies, patients with insulin deficiency (such as type 1 diabetes) usually suffer from osteoporosis, delayed fracture healing and bone abnormalities.21 In diabetic animal models, insulin therapy was shown to partially restore bone abnormalities.22 We have demonstrated that insulin facilitates osteoblast differentiation in a dose-dependent manner. The effective concentration of insulin in osteogenesis differentiation has been demonstrated as being dose-dependent in the range of 0–100 μg mL−1.8,9,23 However, the half-life of insulin in the human body is only 5–15 minutes, so repeated injections are always needed in the new bone formation phase (probably a few months).
In previous studies, insulin-loaded PLGA microspheres were developed using the double emulsification method. Because double emulsion frequently used mechanical dispersion, the size distribution and the release behavior of the insulin-loaded microspheres were difficult to control.24 To overcome these limitations, uniform-sized insulin-loaded PLGA microspheres were developed using the SPG premix membrane method in this study. The PLGA microspheres had narrow size distribution (Span < 0.7), which reached a plateau over a period of 45 days. To investigate the influence of the insulin released from microspheres on the cells around implants, human BMSCs were cultured on a titanium disk with different media. The expression of ALP and OCN in the Ins-PLGA group was significantly higher than those in the blank and PLGA groups. After 21 days of culture, calcium accumulation in the Ins-PLGA and Ins groups was significantly higher than that in other groups, indicating that insulin could stimulate BMSCs differentiation along the osteogenic lineage. These results were consistent with those of Fulzele et al., demonstrating that insulin improved osteogenic differentiation by relieving the suppression of Runx2 by Twist2.5
In this study, insulin-loaded PLGA microspheres were injected into cancellous bone to enhance peri-implant bone formation. At week 4 of post-surgery, the histological images demonstrated different levels of osseointegration among the groups. Massive connective mineralized bones in direct contact with the implants were observed in the Ins-PLGA group. The ratio of BIC in the Ins group was significantly higher than that in the blank and PLGA groups but significantly lower than that in the Ins-PLGA group. Given that insulin could induce the differentiation of BMSCs in a dose-dependent manner, this discrepancy may be a consequence of the sustained-release profile of insulin-loaded PLGA. There was no significant difference in BIC between the blank and PLGA groups, indicating that these PLGA microspheres did not significantly change the osseointegration of titanium implant.
The results of micro-CT also confirmed such differences in peri-implant bone formation. In the Ins and Ins-PLGA groups, newly formed bone had significantly higher values in many parameters (BV/TV, Tb.Th. and Tb.N.) than in the blank and PLGA groups. Moreover, the values of trabecular separation (Tb.Sp.) in the Ins-PLGA and Ins groups were significantly lower than that in the blank and PLGA groups. These results confirmed that the local insulin within a certain concentration range could enhance peri-implant bone formation in the rabbit mandible model.25 Moreover, these results demonstrated that a single injection of the insulin-loaded PLGA microspheres around the titanium implant could improve peri-implant bone formation. In order to further study the effect of insulin-loaded PLGA microspheres on the clinical survival rate of implants, biomechanical testing was conducted. The mean RTQ value in the Ins-PLGA and Ins groups were significantly higher than that in the other groups. This result confirmed that the local sustained release of insulin could improve the biomechanical retention of titanium implants, which was related to a larger area of peri-implant bone formation.
5 Conclusions
Bioactive insulin was controlled and sustainedly released from uniform-sized insulin-loaded PLGA microspheres, which facilitated BMSCs proliferation and differentiation into osteoblasts in vitro. In rabbit mandible models, a single injection of insulin-loaded PLGA microspheres around a titanium implant showed higher peri-implant bone formation and better osseointegration.Conflicts of interest
There are no conflicts to declare.Acknowledgements
This study was supported by the Beijing Natural Science Foundation (7184247), the National Natural Science Foundation of China (81801004 and 81271144), the Shanxi Applied Basic Research Program Science (201701D221160), and the Startup Foundation for Doctors of Shanxi Medical University (BS03201639).References
- Y. Huang, X. Shen, H. Qiao, H. Yang, X. Zhang, Y. Liu and H. Yang, Biofunctional Sr- and Si-loaded titania nanotube coating of Ti surfaces by anodization-hydrothermal process, Int. J. Nanomed., 2018, 13, 633–640 CrossRef CAS PubMed.
- J. Derks, J. Håkansson, J. L. Wennström, C. Tomasi, M. Larsson and T. Berglundh, Effectiveness of Implant Therapy Analyzed in a Swedish Population: Early and Late Implant Loss, J. Dent. Res., 2016, 94, 43–49 CrossRef PubMed.
- Y. Wang, Z. Jiang, K. Yu, Y. Feng, Y. Xi, K. Lai, T. Huang, H. Wang and G. Yang, Improved osseointegrating functionality of cell sheets on anatase TiO2 nanoparticle surfaces, RSC Adv., 2017, 7, 35845–35853 RSC.
- A. C. Shin, N. Filatova, C. Lindtner, T. Chi, S. Degann, D. Oberlin and C. Buettner, Insulin Receptor Signaling in Pomc, but not Agrp, Neurons Controls Adipose Tissue Insulin Action, Diabetes, 2017, 66, 1560–1571 CrossRef CAS PubMed.
- K. Fulzele, R. C. Riddle, D. J. DiGirolamo, X. Cao, C. Wan, D. Chen, M. C. Faugere, S. Aja, M. A. Hussain, J. C. Brüning and T. L. Clemens, Insulin Receptor Signaling in Osteoblasts Regulates Postnatal Bone Acquisition and Body Composition, Cell, 2010, 142, 309–319 CrossRef CAS PubMed.
- C. Contaldo, T. J. Myers, C. Zucchini, M. C. Manara, C. Chiodoni, M. P. Colombo, G. Nicoletti, P. L. Lollini, T. Li, L. Longobardi, K. Scotlandi and A. Spagnoli, Expression Levels of Insulin Receptor Substrate-1 Modulate the Osteoblastic Differentiation of Mesenchymal Stem Cells and Osteosarcoma Cells, Growth Factors, 2014, 32, 41–52 CrossRef CAS PubMed.
- K. Fulzele and T. L. Clemens, Novel Functions for Insulin in Bone, Bone, 2012, 50, 452–456 CrossRef CAS PubMed.
- H. Li, D. Liu, C. Zhao, L. Jiang and L. Dai, Insulin potentiates the proliferation and bone morphogenetic protein-2-induced osteogenic differentiation of rat spinal ligament cells via extracellular signal-regulated kinase and phosphatidylinositol 3-kinase, Spine, 2008, 33, 2394–2402 CrossRef PubMed.
- X. Wang, X. Wu, H. Xing, G. Zhang, Q. Shi, Lingling E., N. Liu, T. Yang, D. Wang, F. Qi, L. Wang and H. Liu, Porous Nanohydroxyapatite/Collagen Scaffolds Loading Insulin PLGA Particles for Restoration of Critical Size Bone Defect, ACS Appl. Mater. Interfaces, 2017, 9, 11380–11391 CrossRef CAS PubMed.
- B. Malekzadeh, P. Tengvall, L. Ohrnel, A. Wennerberg and A. Westerlund, Effects of locally administered insulin on bone formation in non-diabetic rats, J. Biomed. Mater. Res., Part A, 2013, 101, 132–137 CrossRef CAS PubMed.
- F. Qi, J. Wu, Q. Fan, F. He, G. Tian, T. Yang, G. Ma and Z. Su, Preparation of uniform-sized exenatide-loaded PLGA microspheres as long-effective release system with high encapsulation efficiency and bio-stability, Colloids Surf. B, 2013, 112, 492–498 CrossRef CAS.
- S. V. Hope, B. A. Knight, B. M. Shields, A. V. Hill, P. Choudhary, W. D. Strain, T. J. McDonald and A. G. Jones, Random non-fasting C-peptide testing can identify patients with insulin-treated type 2 diabetes at high risk of hypoglycaemia, Diabetologia, 2018, 1, 66–74 CrossRef.
- F. Qi, J. Wu, T. Yang, G. Ma and Z. Su, Mechanistic studies for monodisperse exenatide-loaded PLGA microspheres prepared by different methods based on SPG membrane emulsification, Acta Biomater., 2014, 10, 4247–4256 CrossRef CAS PubMed.
- X. Wang, X. Zou, J. Zhao, X. Wu, Lingling E., L. Feng, D. Wang, G. Zhang, H. Xing and H. Liu, Site-specific characteristics of bone marrow mesenchymal stromal cells modify the effect of aging on the skeleton, Rejuvenation Res., 2016, 5, 351–361 CrossRef PubMed.
- L. Xu, W. Zhang, K. Lv, W. Yu, X. Jiang and F. Zhang, Peri-implant bone regeneration using rhPDGF-BB, BMSCs, and β-TCP in a canine model, Clin. Implant Dent. Relat. Res., 2016, 18, 241–252 CrossRef PubMed.
- N. Ravald, S. Dahlgren, A. Teiwik and K. Gröndahl, Long-term evaluation of Astra Tech and Branemark implants in patients treated with full-arch bridges. Results after 12–15 years, Clin. Implant Dent. Relat. Res., 2016, 18, 241–252 CrossRef PubMed.
- A. Parsa, N. Ibrahim, B. Hassan, P. van der Stelt and D. Wismeijer, Bone quality evaluation at dental implant site using multislice CT, micro-CT, and cone beam CT, Clin. Oral Implants Res., 2015, 26, e1–e7 CrossRef.
- X. Wang, G. Zhang, F. Qi, Y. Cheng, X. Lu, L. Wang, J. Zhao and B. Zhao, Enhanced bone regeneration using an insulin-loaded nano-hydroxyapatite/collagen/PLGA composite scaffold, Int. J. Nanomed., 2017, 13, 117–127 CrossRef PubMed.
- J. Abtahi, F. Agholme, O. Sandberg and P. Aspenberg, Effect of local vs. systemic bisphosphonate delivery on dental implant fixation in a model of osteonecrosis of the jaw, J. Dent. Res., 2013, 92, 279–283 CrossRef CAS.
- V. Goriainov, R. Cook, J. M Latham, D. G. Dunlop and R. O. Oreffo, Bone and metal: an orthopaedic perspective on osseointegration of metals, Acta Biomater., 2014, 10, 4043–4057 CrossRef CAS.
- K. Maratova, O. Soucek, J. Matyskova, Z. Hlavka, L. Petruzelkova, B. Obermannova, S. Pruhova, S. Kolouskova and Z. Sumnik, Muscle functions and bone strength are impaired in adolescents with type 1 diabetes, Bone, 2017, 38, 1365–1371 Search PubMed.
- M. L. Graham and H. J. Schuurman, Validity of animal models of type 1 diabetes, and strategies to enhance their utility in translational research, Eur. J. Pharmacol., 2015, 759, 221–230 CrossRef CAS PubMed.
- M. B. Mueller, T. Blunk, B. Appel, A. Maschke and A. Goepferich, Insulin is essential for in vitro chondrogenesis of mesenchymal progenitor cells and influences chondrogenesis in a dose-dependent manner, Int. Orthop., 2013, 37, 153–158 CrossRef PubMed.
- B. Wang, Y. Song, F. Wang, D. Li, H. Zhang, A. Ma and N. Huang, Effects of Local Infiltration of Insulin Around Titanium Implants in Diabetic Rats, Br. J. Oral Maxillofac. Surg., 2011, 49, 225–229 CrossRef PubMed.
- M. Ferron, J. Wei, T. Yoshizawa, A. Del Fattore, R. A. DePinho, A. Teti, P. Ducy and G. Karsenty, Insulin signaling in osteoblasts integrates bone remodeling and energy metabolism, Cell, 2010, 142, 296–308 CrossRef CAS PubMed.
Footnote |
| † These authors contributed equally to this paper. |
| This journal is © The Royal Society of Chemistry 2018 |

