 Open Access Article
A novel highly fluorescent S, N, O co-doped carbon dots for biosensing and bioimaging of copper ions in live cells†
Yanyu Dai‡
a,
Zhichao Liu‡c,
Yunfeng Bai*b,
Zezhong Chenb,
Jun Qinb and
Feng Feng *ab
*ab
aCollege of Chemistry and Chemical Engineering, Shanxi University, Taiyuan 030006, P. R. China. E-mail: feng-feng64@263.net; Fax: +86-352-6100028; Tel: +86-352-7158662
bCollege of Chemistry and Environmental Engineering, Shanxi Datong University, Datong 037009, P. R. China
cInstitute for Advanced Study and Department of Chemistry, Nanchang University, Nanchang 330031, P. R. China
First published on 18th December 2018
Abstract
In this study, novel highly fluorescent sulfur, nitrogen, and oxygen co-doped carbon dots (S, N, O-CDs) were prepared from m-phenylenediamine and sulfamide by using the hydrothermal method. The prepared S, N, O-CDs show high doping rate and fluorescence yield as well as long-term fluorescence stability. In addition, S, N, O-CDs show good fluorescence response towards Cu2+ over a concentration range of 2–60 μM with a detection limit of 0.29 μM. Taking advantages of the properties of S, N, O-CDs including high selectivity and low cytotoxicity, S, N, O-CDs were successfully applied for Cu2+ sensing and imaging in the cells and O2˙−-induced Cu2+ increase in the cells was observed. Furthermore, on account of strong complexation between Cu2+ and pyrophosphate ion (PPi) as well as specific hydrolysis ability of alkaline phosphatase (ALP) towards PPi, PPi and ALP were further detected with high selectivity based on S, N, O-CDs/Cu2+ system. The prepared S, N, O-CDs showed good detection results for PPi and ALP with detection limits of 0.44 μM and 1.03 U L−1, respectively. Moreover, the developed method also realized PPi and ALP detection in real samples.
1. Introduction
Copper ion (Cu2+), as one of the essential trace elements present in the living body, plays a vital role in physiological and pathological processes, including maintaining normal hematopoietic function and neurological health as well as participating in enzyme catalysed reactions and managing oxidative stress.1,2 Disruption of Cu2+ homeostasis is closely related to different diseases such as Alzheimer's, Menke's, Parkinson's and Wilson's diseases.3,4 Thus, the development of analytical methods for determination of Cu2+ levels in biological systems is helpful for understanding the functions of Cu2+ in physiological metabolism and disease monitoring.Several effective methods have been developed for the detection of Cu2+, including inductively coupled plasma mass spectrometry (ICP-MS),5 atomic absorption spectroscopy (AAS),6 electrochemical methods,7 colorimetry, fluorescence spectroscopy,8–10 and so on. Among these methods, fluorescent probes have attracted great attention due to their noninvasive nature and real-time sensing and imaging capabilities. Several fluorescent probes have been developed for Cu2+ sensing and imaging, including small organic molecules,11 semiconductor quantum dots12 and fluorescent nanomaterial-based probes.10,13,14 Carbon dots (CDs) as typical fluorescent nanomaterials have received extensive attention due to their excellent properties, such as resistance to photobleaching, low toxicity, good biocompatibility and long-term stability, which have been extensively applied in biosensing and bioimaging.15,16 Several CDs-based fluorescent probes have been developed for Cu2+ determination. However, it is still challenging to develop CDs-based biosensor because of poor selectivity of fluorescent CDs. CDs-based inorganic–organic composite probes can effectively improve the selectivity of CDs,11,15 but these probes require high ability for organic synthesis and complex modification processes. Moreover, the low fluorescence quantum yield of CDs further limits their applications. Heteroatom doping has received extensive attention, which can improve the fluorescence quantum yield of CDs by introducing new energy bands.17 Furthermore, introducing heteroatoms into the CDs improves the selectivity of CDs due to the interaction between the heteroatoms and the targets.
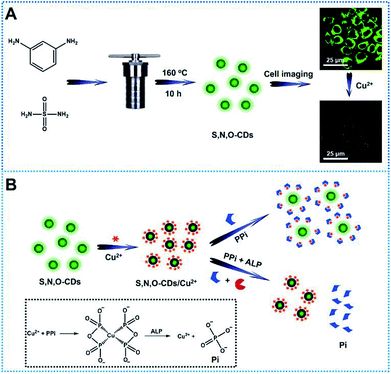
In this study, novel sulfur, nitrogen, oxygen co-doped carbon dots (S, N, O-CDs) were synthesized through hydrothermal method by using sulfamide and m-phenylenediamine as raw materials (Scheme 1A). The synthesized S, N, O-CDs showed high fluorescence quantum yield and long-term fluorescence stability. Taking advantages of the properties of S, N, O-CDs including high selectivity and rapid response dynamics towards Cu2+, the prepared S, N, O-CDs were successfully applied for Cu2+ sensing and imaging in living cells. In addition, we found that the prepared S, N, O-CDs were primarily located in the cytoplasm and O2˙−-induced the increase in the intracellular Cu2+. Furthermore, by using the strong complexing ability of pyrophosphate ion (PPi) towards Cu2+ and specific hydrolysis ability of alkaline phosphatase (ALP) towards PPi, a label-free method was developed for the detection of PPi and ALP activity based on the S, N, O-CDs/Cu2+ system (Scheme 1B).
2. Experimental
2.1 Materials and reagents
Sulfamide and m-phenylenediamine (m-PD) were obtained from J&K Scientific Ltd. (Beijing, China). Sodium pyrophosphate and amino acids were obtained from Sangon Biotechnology Co., Ltd. (Shanghai, China). Alkaline phosphatase (ALP, EC 3.1.3.1, 2 kU) was purchased from Sigma (USA). Glucose oxidase (GOX), thrombin, trypsin, pepsin, lysozyme, cysteine and bull serum albumin (BSA) were purchased from Solarbio (Beijing, China). Other reagents were purchased from Tianjing Chemical Reagents Company (Tianjing, China). All chemicals were used as received without further purification. HEPES buffer (10 mM, pH 7.4) was used throughout the experiments. Ultrapure water was obtained from a Milli-Q Plus system (Millipore, Bedford, MA, USA) and used in all experiments.2.2 Instruments
UV-vis absorption spectra were obtained by a Lambda 35 UV-vis spectrometer (PerkinElmer, USA) and a F-2500 fluorescence spectrophotometer (Hitachi, Japan) was used to record the fluorescence spectra. All spectral measurements were conducted under moderate conditions. Transmission electron microscopy (TEM) images were collected from a JEM-2100F transmission electron microscope (JEOL, Japan). Atomic force microscopy (AFM) images were obtained from BioScope Resolve (Bruker, Germany) in the ScanAsyst mode under ambient conditions. Fourier transform infrared spectrometer (Thermo Fisher Scientific, USA) was used to record Fourier transform infrared (FT-IR) spectra of the samples. X-ray photoelectron spectra (XPS) were obtained on an Escalab 250Xi XPS system (Thermo Fisher Scientific, USA) with Al Kα radiation. Fluorescence lifetime analysis was conducted on a TCSPC module SyPhotime-64 (Becker & Hickl, Germany). Fluorescence confocal imaging was performed with a Leica TCS-SP8 confocal scanning microscope using a 63× oil objective and a numerical aperture of 1.40 (Leica, Germany).2.3 Synthesis of N-CDs and S, N, O-CDs
N-CDs and S, N, O-CDs were synthesized by a facile one-step solvothermal method. For preparing N-CDs, 0.1 g m-phenylenediamine was added to 25 mL ultrapure water with vigorous stirring. Then, the solution was transferred into a 30 mL Teflon-sealed autoclave reactor and heated at 160 °C for 10 h. After that, the product was cooled down to room temperature and purified by dialysis (molecular weight cutoff: 500 Da) for 24 h to obtain N-CDs. The synthetic processes for the preparation of S, N, O-CDs were similar with that for the preparation of N-CDs, and the raw materials were replaced with a mixture of sulfamide (0.1 g) and m-phenylenediamine (0.1 g). Both the N-CDs and S, N, O-CDs were stored at 4 °C away from light until further use.2.4 Fluorescence sensing of Cu2+, PPi and ALP
The stock solutions of Cu2+ (10 mM) were prepared by dissolving CuCl2 in deionized water at room temperature. In a typical detection procedure, different concentrations of Cu2+ were added to 400 μL S, N, O-CDs solution and diluted with HEPES to a final volume of 2 mL. The fluorescence spectra were recorded after the mixtures were blended for different time periods.In order to realize PPi detection, 20 μL Cu2+ (10 mM) was mixed with 400 μL S, N, O-CDs solution. Then, different amounts of PPi was added to the mixture and further diluted with HEPES to a final volume of 2 mL. Fluorescence spectra were obtained after the mixtures were blended for different time periods.
In order to detect ALP activity, ALP was first incubated with 40 μL PPi (10 mM) for different time periods in HEPES buffer at 37 °C. Then, the obtained solutions were deactivated at 90 °C for 10 min to terminate the hydrolysis reaction. Subsequently, the deactivated solutions were added to a mixture of 20 μL Cu2+ (10 mM) and 400 μL S, N, O-CDs solution and further blended for 15 minutes. The fluorescence spectra were obtained after the above system was diluted with HEPES to a final volume of 2 mL.
2.5 HeLa cells culture and MTT assay
HeLa cells were cultured in a 5% CO2 incubator at 37 °C with saturated humidity and grown in high glucose Dulbecco's Modified Eagle's Medium (DMEM) supplemented with fetal bovine serum (10%) and penicillin/streptomycin solution (1%). HeLa cells were transferred to 96-well microliter plates and incubated for at least 24 h before using. Then, different concentrations of S, N, O-CDs solution were co-incubated with cells for 24 and 48 h. Subsequently, 20 μL 3-(4,5-dimethyl-2-thiazolyl)-2,5-diphenyl-2-H-tetrazolium bromide (MTT) was added to each well in the dark. After the mixtures reacted for 4 h, the mixed solution was removed, and 80 μL DMSO was added. Next, the mixtures were shaken for 5 min, and then the absorbance was measured at 490 nm. Cell viability was determined according to the following formula: cell viability (%) = absorbance of the experimental group/absorbance of the blank control group × 100%.2.6 Fluorescence confocal imaging and fluorescence analysis of practical samples
Before Cu2+ imaging, HeLa cells were transferred to 35 mm Petri dishes with 20 mm bottom wells and incubated for at least 24 h before using. Then, S, N, O-CDs solution was added and co-incubated with the cells for 1 h. After that, the adherent cells were washed by PBS twice to remove any S, N, O-CDs that were not taken up by the cells. Next, different concentrations of Cu2+ were added and co-incubated with the cells for another 30 min, the fluorescence images were then collected between 500–650 nm with an excitation wavelength of 488 nm. For O2˙−-stimulated cell imaging, exogenous O2˙− was generated by the enzymatic reaction of the xanthine/xanthine oxidase system and was introduced directly into the Petri dish.For fluorescence analysis of PPi and ALP activity in practical samples, human urine and serum samples were collected from the affiliated hospital of Shanxi Datong University. The collected urine samples were first centrifuged at 5000 rpm for 10 min. Then, the supernatant was collected and diluted with ultrapure water three-fold before using. Meanwhile, the collected serum samples were first centrifuged at 3000 rpm for 10 min. Then, the supernatant was collected and diluted to 1% with ultrapure water. PPi and ALP were detected according to the above detection procedures. In order to evaluate the accuracy of the proposed method, quantities of standard PPi and ALP solutions were added to the sample solutions for recovery tests.
3. Results and discussion
3.1 Synthesis and characterization of S, N, O co-doped CDs
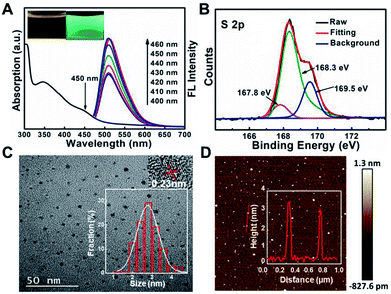
It has been reported that sulfur, nitrogen as well as oxygen have strong coordination with Cu2+.11,18–22 In order to detect Cu2+ with high selectivity, sulfur, nitrogen, oxygen co-doped CDs (S, N, O-CDs) were prepared by hydrothermal method using m-phenylenediamine (m-PD) and sulfamide as raw materials. m-PD was chosen as a carbon and nitrogen source while sulfamide was selected as a sulfur, nitrogen, and oxygen source. UV-vis absorption spectra show that the prepared S, N, O-CDs have a broad absorption band around 450 nm. Meanwhile, the S, N, O-CDs showed green fluorescence with distinct emission peak around 520 nm, which was independent of fluorescence excitation. The fluorescence intensity of the S, N, O-CDs increased with the increase in excitation wavelength from 400 to 460 nm (Fig. 1A). The fluorescence quantum yield of the S, N, O-CDs was measured to be 78.6% using rhodamine 6G as a reference chromophore, which was ∼14 times higher than that of the N-CDs prepared from m-phenylenediamine (5.6%) (Fig. S1, ESI†). Moreover, the fluorescence quantum yield of the S, N, O-CDs was also higher than that of previously reported heteroatom co-doped CDs (Table S1, ESI†). This high fluorescence quantum yield can be attributed to the co-doping of heteroatoms in the CDs.In addition, XPS data confirmed that the as-prepared S, N, O-CDs consisted of different chemical elements including C, N, O, and S. The contents of C, N, O, S in the prepared S, N, O-CDs were 67.3%, 5.6%, 23.6% and 3.5%, respectively (Fig. S2A, ESI†). The content of the doped S was higher than those in the previously reported literatures.23,24 In addition, high resolution XPS spectrum of S 2p shows three peaks at 167.8, 168.3 and 169.5 eV, which arise from –C–SO2–, –C–SO3– and –C–SO4–, respectively (Fig. 1B).25,26 XPS spectrum of C 1s (Fig. S2B, ESI†) exhibits five peaks at 284.57 eV (C–C/C![[double bond, length as m-dash]](https://www.rsc.org/images/entities/char_e001.gif) C), 285.37 eV (C–N), 286.3 eV (C–O), 288.5 eV (C
C), 285.37 eV (C–N), 286.3 eV (C–O), 288.5 eV (C![[double bond, length as m-dash]](https://www.rsc.org/images/entities/char_e001.gif) O/C
O/C![[double bond, length as m-dash]](https://www.rsc.org/images/entities/char_e001.gif) N) and 289.0 eV (COOH). Meanwhile, XPS spectrum of N 1s indicates that the prepared S, N, O-CDs contain pyridinic N, pyrrolic N and amino N (Fig. S2C, ESI†), and XPS spectrum of O 1s shows two typical peaks at 531.8 eV (C
N) and 289.0 eV (COOH). Meanwhile, XPS spectrum of N 1s indicates that the prepared S, N, O-CDs contain pyridinic N, pyrrolic N and amino N (Fig. S2C, ESI†), and XPS spectrum of O 1s shows two typical peaks at 531.8 eV (C![[double bond, length as m-dash]](https://www.rsc.org/images/entities/char_e001.gif) O) and 533.2 eV (C–O) (Fig. S2D, ESI†). XPS results were further confirmed by FT-IR spectra (Fig. S3, ESI†). In addition, an FT-IR spectrum of S, N, O-CDs shows significant peaks at 3218 cm−1 and 1448 cm−1, which correspond to the ν (N–H). Meanwhile, the peaks around 3453 cm−1 and 1632 cm−1 correspond to the ν (C–OH) and ν (C
O) and 533.2 eV (C–O) (Fig. S2D, ESI†). XPS results were further confirmed by FT-IR spectra (Fig. S3, ESI†). In addition, an FT-IR spectrum of S, N, O-CDs shows significant peaks at 3218 cm−1 and 1448 cm−1, which correspond to the ν (N–H). Meanwhile, the peaks around 3453 cm−1 and 1632 cm−1 correspond to the ν (C–OH) and ν (C![[double bond, length as m-dash]](https://www.rsc.org/images/entities/char_e001.gif) O), respectively.15,27 All these results suggest the presence of –COOH, –NH2 and/or –OH groups in the S, N, O-CDs, which improves the water solubility of the S, N, O-CDs as well as the complexing ability of S, N, O-CDs towards Cu2+.
O), respectively.15,27 All these results suggest the presence of –COOH, –NH2 and/or –OH groups in the S, N, O-CDs, which improves the water solubility of the S, N, O-CDs as well as the complexing ability of S, N, O-CDs towards Cu2+.
TEM and AFM were further used to characterize the morphology of S, N, O-CDs. As shown in Fig. 1C, TEM image shows that the as-prepared S, N, O-CDs were monodispersed with a size of 2.7 ± 0.9 nm. Besides, HR-TEM image shows that the apparent lattice spacing of S, N, O-CDs was 0.23 nm, which is consistent with the diffraction lattice of graphene (100).28 The typical AFM image shows the topographic morphology of S, N, O-CDs with a height of ∼3 nm (Fig. 1D), indicating that the prepared S, N, O-CDs consist of several atomic layers, which is comparable to our TEM data.
3.2 Stability of as-prepared S, N, O-CDs
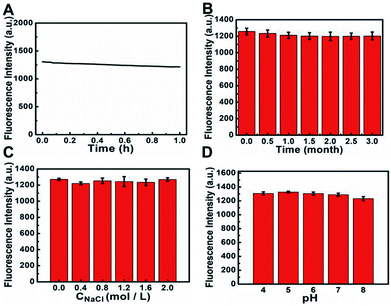
In order to realize good applications of S, N, O-CDs, a series of experiments was further conducted to investigate the stability of the prepared S, N, O-CDs. As shown in Fig. 2A, the fluorescence intensity of S, N, O-CDs showed no significant decrease (<7%) after exposure to a 20 W Xe lamp for 1 h, indicating the excellent resistance to photobleaching. In addition, the fluorescence intensity of the prepared S, N, O-CDs remained stable (<4%) even after the S, N, O-CDs were stored at 4 °C for three months (Fig. 2B). Moreover, considering the high salt concentration in living cells, the effect of different concentrations of NaCl on the fluorescence of S, N, O-CDs was further researched. No significant difference was observed after S, N, O-CDs were added to various concentrations of NaCl at pH 7.4, even in 2 M NaCl solution (Fig. 2C), proving that the as-prepared S, N, O-CDs were quite stable toward highly ionic conditions. The high stability of the prepared S, N, O-CDs under various conditions endow them with promising applications. Furthermore, different pH solutions (4–8) had no apparent influence on the fluorescence of S, N, O-CDs (Fig. 2D).3.3 Fluorescence sensing of Cu2+ by using S, N, O-CDs
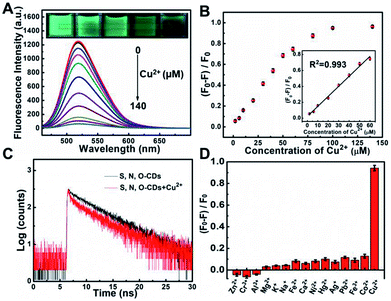
Taking advantages of the prepared S, N, O-CDs with high fluorescence intensity and good stability, this probe was further used for Cu2+ sensing. As shown in Fig. 3A, the fluorescence intensity of S, N, O-CDs decreased with the increase in the concentration of Cu2+, and the fluorescence of S, N, O-CDs was almost quenched completely in the presence of 140 μM Cu2+. Meanwhile, the fluorescence images of the S, N, O-CDs solution revealed a gradual quenching with the increase in Cu2+ concentration (insets of Fig. 3A). The fluorescence quenching efficiency displayed good linearity over a Cu2+ concentration range of 2 μM to 60 μM (Fig. 3B). The detection limit was estimated to be 0.29 μM (S/N = 3), which is comparable with the previously reported CDs-based probes (Table S2, ESI†). The response time of the Cu2+-induced fluorescence quenching of the S, N, O-CDs was less than 1 min (Fig. S4, ESI†), suggesting rapid response dynamics of S, N, O-CDs towards Cu2+.In order to understand the mechanism of the Cu2+-induced fluorescence quenching of the S, N, O-CDs, UV-vis absorption spectra of S, N, O-CDs were measured before and after the addition of Cu2+. After S, N, O-CDs complexed with Cu2+, a new absorption peak appeared at 425 nm (Fig. S5, ESI†). No significant absorption peak was observed for m-PD or Cu2+. As a result, this new peak can be attributed to the complex nanocomposite formed between the S, N, O-CDs and Cu2+. Moreover, after Cu2+ complexed with the S, N, O-CDs, the fluorescence lifetime of the S, N, O-CDs shortened from 5.68 ns to 4.85 ns, implying that Cu2+-induced fluorescence quenching of S, N, O-CDs obeys a dynamic quenching mechanism (Fig. 3C). It has been reported that Cu2+ is a paramagnetic ion with an unfilled d shell; the fluorescence of the S, N, O-CDs could be quenched through electron or energy transfer.10,21
In addition, the selectivity of S, N, O-CDs towards Cu2+ was estimated. Potential interferences including Fe2+, Fe3+, Co2+, Ni+, Pb2+, Hg2+, Zn2+, Cr3+, Al3+, K+, Na+, Ca2+ and Mg2+ had no significant influence on the fluorescence of S, N, O-CDs (Fig. 3D). Furthermore, anions including Cl−, CO32−, HCO3−, PO43−, HPO42−, H2PO4−, SO42−, F−, Br−, I− and common amino acids also showed no significant effect on the fluorescence of the S, N, O-CDs (Fig. S6 and S7, ESI†). All of these results prove the high selectivity of S, N, O-CDs towards Cu2+.
3.4 Fluorescence sensing and imaging of Cu2+ in cells
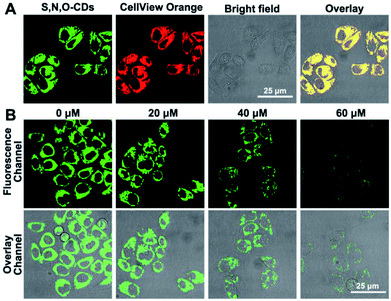
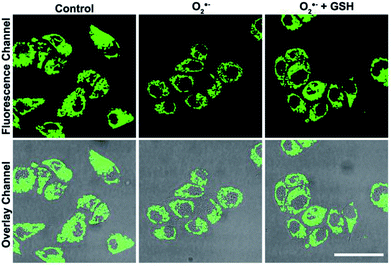
Based on the good detection results and high selectivity of S, N, O-CDs towards Cu2+, we further applied S, N, O-CDs for Cu2+ sensing in living cells. The cytotoxicity of the S, N, O-CDs was first estimated. The cell viability was higher than 85% even at S, N, O-CD concentrations of 3 mg mL−1 (Fig. S8, ESI†). This concentration was 3 times higher than the concentration used in cell imaging, demonstrating the low cytotoxicity of the prepared S, N, O-CDs. Then, co-localization imaging experiments were carried out. As shown in Fig. 4A, the fluorescence of the prepared S, N, O-CDs merged well with the fluorescence of the CellView Orange CMTMR (a commercial cytoplasm-targeted probe), the Pearson's correlation coefficient was calculated as 0.95. This result suggested that our prepared S, N, O-CDs were mostly located in the cytoplasm. Next, the prepared S, N, O-CDs were used for Cu2+ imaging in cells. As shown in Fig. 4B, with the increase in Cu2+ concentration, the fluorescence of S, N, O-CDs gradually decreased, proving that our prepared S, N, O-CDs can be used for Cu2+ sensing and imaging in cells.It has been reported that Cu2+ has close relationship with oxidative stress, which also participate in the transformation of reactive oxygen species (ROS) in living cells.29–31 Since the superoxide anion (O2˙−) is the primary ROS in cells,32–34 the effect of O2˙− on intracellular Cu2+ was further investigated. As shown in Fig. 5, after the cells were stimulated by O2˙− for 30 min, the fluorescence of the S, N, O-CDs distinctly decreased, suggesting the increase in the Cu2+ concentration in the cells. More importantly, after the cells were stimulated by O2˙− in the presence of glutathione (GSH), a scavenger of O2˙−, no marked variations were observed in the fluorescence of S, N, O-CDs. This result further confirmed that the increase in intracellular Cu2+ was induced by O2˙−.
3.5 Fluorescence sensing of PPi and ALP by the S, N, O-CDs/Cu2+ system
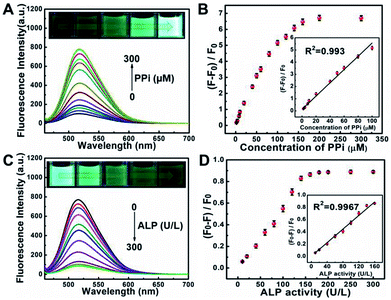
Pyrophosphate ions (PPi) and alkaline phosphatase (ALP) play an indispensable role in various metabolic processes. The concentration of PPi in living bodies implies the process of cellular physiological changes, enzyme-related reactions and even the occurrence of diseases such as arthritis and chondrocalcinosis.35 Alkaline phosphatase (ALP) is a vital hydrolase enzyme in the process of human phosphate metabolism, participates in cell signaling, cell growth and apoptosis.36,37 The level of ALP is closely related to many diseases, such as diabetes, liver dysfunction, dynamic bone disease as well as breast and prostate cancer.38–40 Thus, it is quite important to monitor the level of PPi and ALP in living bodies.Taking advantages of the good selectivity of the S, N, O-CDs towards Cu2+ and the strong complexing ability of PPi with Cu2+, we then conducted an assay for PPi based on the S, N, O-CDs/Cu2+ system. As shown in Fig. 6A, with the increasing concentration of PPi, the fluorescence of the S, N, O-CDs/Cu2+ system gradually recovered. Meanwhile, the green fluorescence in the images gradually became brighter. This PPi-induced fluorescence recovery of the S, N, O-CDs can be attributed to the complexing of PPi with Cu2+, which disturbed the electron transfer or energy transfer between S, N, O-CDs and Cu2+. The fluorescence recovery rate displays a good linearity with PPi concentration in the range of 2–100 μM (Fig. 6B). The detection limit for PPi was calculated as 0.44 μM (S/N = 3), which is comparable with that of the previously reported literatures.41,42
Meanwhile, the response time of the S, N, O-CDs/Cu2+ system towards PPi was also measured. The fluorescence intensity of S, N, O-CDs/Cu2+ system gradually increased with the prolongation of the incubation time, and the fluorescence intensity of the solution reached a maximum after 10 min (Fig. S9, ESI†). Then, the selectivity of the S, N, O-CDs/Cu2+ system towards PPi was further investigated. No significant interferences were observed from the potential interferences, including HPO42−, H2PO4−, CO32−, HCO3−, F−, and Cl− (Fig. S10, ESI†). However, ATP and PO43− resulted in partial fluorescence recovery because of the similar structure of ATP or PO43− as that of PPi. However, the fluorescence recovery rate of the S, N, O-CDs/Cu2+ system induced by PPi was 3.5 times higher than that induced by ATP and 7 times higher than that induced by PO43−. Thus, the effect of ATP and PO43− can be ignored.
By using the specific hydrolysis ability of ALP towards PPi, we further conducted experiments for the detection of ALP activity based on S, N, O-CDs/Cu2+ system in the presence of 200 μM PPi. Considering that the enzymatic hydrolysis process usually takes a long time, thus, the reaction time for the detection of ALP activity was first optimized. The fluorescence intensity of S, N, O-CDs/Cu2+ system gradually decreased with the prolongation of reaction time in the presence of PPi (200 μM) and ALP (160 U L−1) at 37 °C (Fig. S11, ESI†). After the solution reacted for 60 min, the fluorescence of the S, N, O-CDs/Cu2+ system was almost completely quenched; thus, a reaction time of 60 min was chosen in the following experiments. As shown in Fig. 6C, the fluorescence of the S, N, O-CDs/Cu2+ system evidently decreased with the increasing concentration of ALP. The fluorescence quenching efficiency displayed good linearity with the ALP concentration in the range of 10–160 U L−1 (Fig. 6D), and the detection limit for ALP was calculated as 1.03 U L−1 (S/N = 3). This result was comparable with the previously reported works.14,41,42 It should be noted that the normal level of ALP in human blood is about 30–120 U L−1.43 Therefore, the developed probe can be used for ALP detection in practical samples. Furthermore, the developed probe also showed high selectivity, and no significant influence was observed from potential interferences such as GOX, BSA, trypsin, Cys, pepsin, thrombin, lysozyme, Tyr, Glu and GSH (Fig. S12, ESI†).
3.6 Detection of PPi and ALP in human urine or serum samples
Based on the excellent specificity combined with high sensitivity of S, N, O-CDs/Cu2+ system to PPi and ALP activity, we further applied our method for the detection of PPi and ALP in real samples. Human urine was used as the real sample for the detection of PPi while human serum was selected as the real sample for the detection of ALP activity. A standard addition method was used in the experiments. Three different concentrations of the PPi (20, 40 and 80 μM) were spiked into the diluted human urine samples. The recovery values were 107.84%, 97.28% and 104.54%, respectively (Table S3, ESI†). Meanwhile, four different concentrations of ALP (20, 60, 100 and 140 U L−1) were added to the diluted human serum samples. The recovery values were 94.73%, 104.02%, 104.72% and 105.40%, respectively. All these results indicated that our proposed method could potentially be applied in complex realistic samples.4. Conclusion
In this study, highly fluorescent sulfur, nitrogen, oxygen co-doped carbon dots (S, N, O-CDs) were prepared with high doping rate and fluorescence quantum yield as well as long-term fluorescence stability. In addition, the prepared S, N, O-CDs probe shows good fluorescence response and high selectivity towards Cu2+. Taking advantages of the properties of S, N, O-CDs like low cytotoxicity, Cu2+ sensing and imaging in living cells were realized and O2˙−-induced Cu2+ increase in the cells was observed. Furthermore, by using the strong interaction between Cu2+ and PPi as well as hydrolysis of ALP towards PPi, a label-free method was successfully developed for the determination of PPi and ALP with high selectivity based on the fluorescence quenching system of S, N, O-CDs/Cu2+. This study expands the application of CDs and provides new insights for the development of CDs-based biosensors.Conflicts of interest
There are no conflicts of interest to declare.Acknowledgements
This study was supported by the National Natural Science Foundation of China (21375083), Key Industrial Research and Development Projects of Datong City (2018014), Scientific and Technological Innovation Programs of Higher Education Institutions in Shanxi (2015179), Key Scientific and Technological Projects of Datong City (2015023), and Doctoral Scientific Research Projects of Shanxi Datong University (2014-B-03).Notes and references
- M. C. Linder and M. Hazegh-Azam, Am. J. Clin. Nutr., 1996, 63, 797S–811S CAS.
- R. Uauy, M. Olivares and M. Gonzalez, Am. J. Clin. Nutr., 1998, 67, 952S–959S CrossRef CAS PubMed.
- D. Strausak, J. F. B. Mercer, H. H. Dieter, W. Stremmel and G. Multhaup, Brain Res. Bull., 2001, 55, 175–185 CrossRef CAS PubMed.
- P. S. Donnelly, Z. G. Xiao and A. G. Wedd, Curr. Opin. Chem. Biol., 2007, 11, 128–133 CrossRef CAS PubMed.
- J. Hu, R. E. Sturgeon, K. Nadeau, X. D. Hou, C. B. Zheng and L. Yang, Anal. Chem., 2018, 90, 4112–4118 CrossRef CAS PubMed.
- J. F. Wu and E. A. Boyle, Anal. Chem., 1997, 69, 2464–2470 CrossRef CAS PubMed.
- B. K. Jena and C. R. Raj, Anal. Chem., 2008, 80, 5671 CrossRef CAS.
- C. C. Chang, G. Q. Wang, T. Takarada and M. Maeda, ACS Appl. Mater. Interfaces, 2017, 9, 34518–34525 CrossRef CAS PubMed.
- D. Udhayakumari, S. Naha and S. Velmathi, Anal. Methods, 2017, 9, 552–578 RSC.
- Z. C. Liu, J. W. Qi, C. Hu, L. Zhang, W. Song, R. P. Liang and J. D. Qiu, Anal. Chim. Acta, 2015, 895, 95–103 CrossRef CAS PubMed.
- A. W. Zhu, Q. Qu, X. L. Shao, B. Kong and Y. Tian, Angew. Chem., 2012, 124, 7297–7301 CrossRef.
- L. H. Jin and C. S. Han, Anal. Chem., 2014, 86, 7209–7213 CrossRef CAS PubMed.
- B. B. Zhang, J. J. Meng, X. H. Mi, C. J. Zhang, Z. L. Zhang and H. R. Zheng, RSC Adv., 2018, 8, 37618–37622 RSC.
- F. Wang, C. Zhang, Q. Xue, H. Li and Y. Xian, Biosens. Bioelectron., 2017, 95, 21–26 CrossRef CAS PubMed.
- B. Kong, A. W. Zhu, C. Q. Ding, X. M. Zhao, B. Li and Y. Tian, Adv. Mater., 2012, 24, 5844–5848 CrossRef CAS PubMed.
- J. Lan, C. F. Liu, M. X. Gao and C. Z. Huang, Talanta, 2015, 144, 93–97 CrossRef CAS PubMed.
- H. Huang, J. J. Lv, D. L. Zhou, N. Bao, Y. Xu, A. J. Wang and J. J. Feng, RSC Adv., 2013, 3, 21691–21696 RSC.
- Q. Qu, A. W. Zhu, X. L. Shao, G. Y. Shi and Y. Tian, Chem. Commun., 2012, 48, 5473–5475 RSC.
- R. R. Conry, Encycl. Inorg. Chem., Wiley, 2006 Search PubMed.
- Q. L. Yue, Y. N. Hou, S. Z. Yue, K. M. Du, T. S. Fei, L. Wang, S. L. Xu, H. B. Li and J. F. Liu, J. Fluoresc., 2015, 25, 585–594 CrossRef CAS PubMed.
- J. Wang, L. R. Sheng, Z. H. Zhi, N. Wang, Z. Zhang and C. Z. Huang, Biosens. Bioelectron., 2017, 97, 157–163 CrossRef CAS PubMed.
- Y. Q. Dong, R. X. Wang, G. L. Li, C. Q. Chen, Y. W. Chi and G. N. Chen, Anal. Chem., 2012, 84, 6220–6224 CrossRef CAS PubMed.
- H. Ding, J. S. Wei and H. M. Xiong, Nanoscale, 2014, 6, 13817–13823 RSC.
- T. Chatzimitakos, A. Kasouni, L. Sygellou, I. Leonardos, A. Troganis and C. Stalikas, Sens. Actuators, B, 2018, 267, 494–501 CrossRef CAS.
- W. Wang, Y. C. Lu, H. Huang, A. J. Wang, J. R. Chen and J. J. Feng, Biosens. Bioelectron., 2015, 64, 517–522 CrossRef CAS PubMed.
- W. Lu, X. Gong, M. Nan, Y. Liu, S. Shuang and C. Dong, Anal. Chim. Acta, 2015, 898, 116–127 CrossRef CAS PubMed.
- H. Ding, S. B. Yu, J. S. Wei and H. M. Xiong, ACS Nano, 2016, 10, 484–491 CrossRef CAS PubMed.
- H. Huang, Y. C. Lu, A. J. Wang, J. H. Liu, J. R. Chen and J. J. Feng, RSC Adv., 2014, 4, 11872–11875 RSC.
- H. L. Karlsson, P. Cronholm, J. Gustafsson and L. Moller, Chem. Res. Toxicol., 2008, 21, 1726–1732 Search PubMed.
- B. Fahmy and S. A. Cormier, Toxicol. in Vitro, 2009, 23, 1365–1371 CrossRef CAS PubMed.
- M. Shi, H. S. Kwon, Z. M. Peng, A. Elder and H. Yang, ACS Nano, 2012, 6, 2157–2164 CrossRef CAS PubMed.
- G. Y. Liou and P. Storz, Free Radic. Res., 2010, 44, 479–496 CrossRef CAS PubMed.
- I. Fridovich, Annu. Rev. Biochem., 1995, 64, 97–112 CrossRef CAS PubMed.
- P. Li, W. Zhang, K. X. Li, X. Liu, H. B. Xiao, W. Zhang and B. Tang, Anal. Chem., 2013, 85, 9877–9881 CrossRef CAS PubMed.
- F. W. Tsui, Curr. Rheumatol. Rep., 2012, 14, 155–160 CrossRef CAS PubMed.
- H. N. Fernley, Enzymes, 1971, 4, 417–447 CAS.
- M. B. Yaffe, Nat. Rev. Mol. Cell Biol., 2002, 3, 177–186 CrossRef CAS PubMed.
- M. M. Couttenye, P. C. D'Haese, V. O. Van Hoof, E. Lemoniatou, W. Goodman, G. A. Verpooten and M. E. De Broe, Nephrol., Dial., Transplant., 1996, 11, 1065–1072 CrossRef CAS.
- P. Colombatto, A. Randone, G. Civitico, J. M. Gorin, L. Dolci, N. Medaina, F. Oliveri, G. Verme, G. Marchiaro, R. Pagni, P. Karayiannis, H. C. Thomas, G. Hess, F. Bonino and M. R. Brunetto, J. Viral Hepatitis, 1996, 3, 301–306 CrossRef CAS.
- J. A. Lorente, H. Valenzuela, J. Morote and A. Gelabert, Eur. J. Nucl. Med., 1999, 26, 625–632 CrossRef CAS.
- J. L. Ma, B. C. Yin, X. Wu and B. C. Ye, Anal. Chem., 2016, 88, 9219–9225 CrossRef CAS PubMed.
- F. Niu, Y. L. Ying, X. Hua, Y. Niu, Y. Xu and Y. T. Long, Carbon, 2018, 127, 340–348 CrossRef CAS.
- S. J. Vella, P. Beattie, R. Cademartiri, A. Laromaine, A. W. Martinez, S. T. Phillips, K. A. Mirica and G. M. Whitesides, Anal. Chem., 2012, 84, 2883–2891 CrossRef CAS PubMed.
Footnotes |
| † Electronic supplementary information (ESI) available. See DOI: 10.1039/c8ra09298b |
| ‡ These authors contributed equally to this work. |
| This journal is © The Royal Society of Chemistry 2018 |

