DOI:
10.1039/C8RA09383K
(Paper)
RSC Adv., 2018,
8, 41575-41586
A first-principles calculation of structural, mechanical, thermodynamic and electronic properties of binary Ni–Y compounds
Received
14th November 2018
, Accepted 30th November 2018
First published on 12th December 2018
Abstract
The intermetallic compounds between rare earth (RE) elements and transition metal elements have been comprehensively researched due to their appealing magnetic, electronic, optical and thermal properties, in which Ni–Y alloys are one kind of important system. In this work, a systematic investigation concerned with structures, elastic, and thermodynamic properties of Ni17Y2, Ni5Y, Ni7Y2, Ni3Y, Ni2Y, NiY, Ni2Y3 and NiY3 in Ni–Y systems is implemented by means of first-principles calculations. NiY has the lowest formation enthalpy within −0.49 kJ per mol per atom. Ni5Y has the largest bulk modulus, shear modulus and Young's modulus of 181.71 GPa, 79.75 GPa and 208.70 GPa, respectively. Furthermore, the effects of different concentrations of yttrium on the mechanical and thermal properties of Ni–Y compounds are estimated by using the Voigt–Reuss method. The electronic density of states and chemical bonding between Ni and Y are key factors that determine mechanical and thermodynamic properties of these compounds. What's more, results indicate that all compounds are dynamically stable as shown by the calculated phonon dispersions.
1. Introduction
In the past few decades, the intermetallic compounds between transition metal elements and rare earth (RE) elements have been extensively researched due to their appealing magnetic, electronic, optical and thermal properties. Among Ni–RE systems, the Ni–Y system may be of particular interest for its extensive applications in magnetic, amorphous, catalytic materials and hydrogen storage materials.1–7 The magnetic properties of Ni–Y compounds have attracted significant attention and been discussed by M. Shimizu et al.3 and J. Beille et al.8 Ni3Y showed very low ferromagnetism while Ni7Y2 demonstrated thermal spontaneous magnetization in their results. The thermodynamic stability of the Ni–Y system and Co–Ni–Y system have been researched by Z. M. Du et al.9,10 who discussed Ni–Y binary and Co–Ni–Y ternary phase diagrams. Moreover, Al–Ni–Y and Mg–Ni–Y alloys, as amorphous materials, indicating great forming abilities of metallic glass and excellent mechanical properties, have been reported by X. Y. Jiang et al.6 and Y. M. Soifer et al.7 Moreover, Ni and Y have been used as component elements for catalytic materials. The order of catalytic efficiency toward the hydrogenation reaction was PtY < NiY < CoY < PtNiY < PtCoY in El-Bahy's research.11
Furthermore, Ni is a candidate device component which is used in thermoelectric (TE) devices due to its eminent electrical and thermal characteristics.12 It is well known that nickel-based superalloy is a commonly used superalloy, which is widely used in manufacturing aerospace engines, industrial gas turbine blades and other hot end components. M. A. Shevchenko et al.13 have researched thermodynamic properties of binary alloys including Ni–Sc and Ni–Y systems, they predicted the similar parameters of multicomponent systems and studied the amorphous tendency of alloys. S. Kardellass et al.14 had been assessed the thermodynamically in Ni–Sc system using the CALPHAD approach. They calculated the Ni–Sc phase diagram using Kaptay model, which showed that the formation enthalpy of Ni–Sc compounds would be welcome to improve thermodynamic evaluation. The thermodynamic modeling of binary compounds, such as rare earth element Yb and transition element Ni, was studied using the CALPHAD method in combination with first-principles calculations based on density functional theory (DFT) by Hu et al.15 Although the density of state of Ni3Y, Ni5Y, and Ni7Y2 have been calculated by M. Shimizu et al.3 and thermodynamics of Ni–Y alloys have been researched by M. A. Shevchenko et al.13 the electronic, mechanical and thermodynamics of Ni–Y alloys have not been systematically calculated in previous reports. In the present work, the formation enthalpy, electronic, mechanical and thermodynamic properties of the Ni–Y compounds are predicted from first-principles calculations based on the density functional theory (DFT), to guide the experiments in the future.
2. Computational method and details
According to the Ni–Y binary phase diagram16 in Fig. 1, the structures of Ni–Y compounds with different stoichiometry can be acquired: Ni17Y2 with a hexagonal structure (P63/mmc, no. 194); Ni5Y with a hexagonal structure (P6/mmm, no. 191); Ni7Y2 with a rhombohedral structure (R![[3 with combining macron]](https://www.rsc.org/images/entities/char_0033_0304.gif) mH, no. 166); Ni3Y with a rhombohedral structure (R
mH, no. 166); Ni3Y with a rhombohedral structure (R![[3 with combining macron]](https://www.rsc.org/images/entities/char_0033_0304.gif) mH, no. 166); Ni2Y with a cubic structure (Fd
mH, no. 166); Ni2Y with a cubic structure (Fd![[3 with combining macron]](https://www.rsc.org/images/entities/char_0033_0304.gif) mS, no. 227); NiY with a orthorhombic structure (Pnma, no. 62); Ni2Y3 with a tetragonal structure (P41212, no. 92); and the NiY3 with an orthorhombic structure (Pnma, no. 62).
mS, no. 227); NiY with a orthorhombic structure (Pnma, no. 62); Ni2Y3 with a tetragonal structure (P41212, no. 92); and the NiY3 with an orthorhombic structure (Pnma, no. 62).
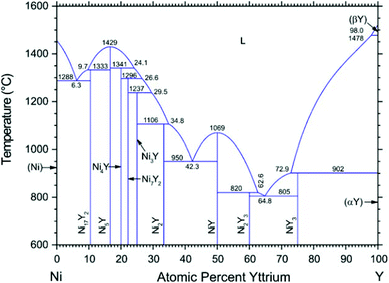 |
| | Fig. 1 The Ni–Y Phase diagram by Mattern N., Zinkevich M., Löser W., et al. in ref. 16. | |
In this paper, all the calculations including total energy, elastic properties, electronic structures and thermodynamic properties carried by using a first-principles calculation based on the density functional theory (DTF), as implemented in the Cambridge Serial Total Energy Package (CASTEP) code.17 To estimate the calculated, the generalized gradient approximation (GGA) in Perdew–Burke–Ernzerhof for surfaces and solids (PBEsol) is employed as the exchange-correlation function.18 Plane wave cutoff energy is chosen as 500 eV to convergence for all the calculations. The Brillouin zone (BZ) is performed by using the k-point meshes with 5 × 5 × 5 grids according to the Monkhorst–Pack method. To describe the electronic function, the ultra-soft pseudopotentials (USPPs)19 of Vanderbilt-type are carried out and the valence electron configurations for Ni and Y atoms are 3d84s2 and 4d15s2, respectively. During the structural optimization, Broydene Fletchere Goldarde Shanno (BFGS) method is used until the total energy changes are converged to 1 × 10⁻⁹ eV per atom, self-consistent field convergence to 2 × 10⁻⁶ eV per atom, maximum force 0.03 eV Å−1, respectively. Elastic constants of a solid are calculated by an efficient strain–stress method through a linear least-square fit of first-principles calculation results. And the phonon dispersion curves of Ni–Y compounds are calculated according to the finite displace method implanted in CASTEP. This method is to construct a supercell, move the atom, and calculate the force of all the atoms in the cell. A force constant matrix was constructed based on this force. What's more, this method determines the dynamical matrix starting from following equation: fs = −Φstut, where fs, Φst and ut represent force, force constant matrix and the displacement, respectively. The cut-off radius of the finite displace method is 5.0 Å.
The negative values of formation enthalpy20,21 indicate that the thermodynamically stability of compounds which can be estimated by the following expressions:
| |
 | (1) |
where Δ
Hr(Ni
xY
y) is the formation enthalpy of Ni
xY
y per atom,
Etot(Ni
xY
y) is the total energy of Ni
xY
y phase;
Ebin is the cohesive energy of pure Ni and Y crystals, respectively. The optimized crystal structures are illustrated in
Fig. 2.
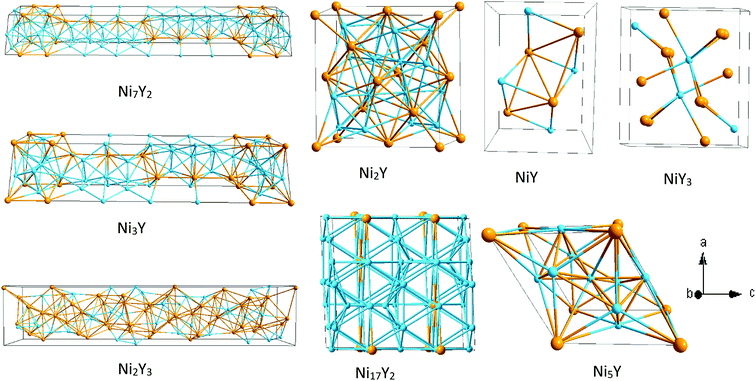 |
| | Fig. 2 The crystal structure of Ni–Y compounds. Sky blue and light orange spheres represent the Ni and Y atoms, respectively. | |
3. Result and discussion
3.1 Equilibrium lattice constants and phonon
The calculated crystal structures of the Ni–Y compounds are listed in Table 1, which are compared with the experimental results from other references.1,2,4,5 From Table 1, we can clearly see that the calculated values are in good agreement with the other theoretical values. The error range of the lattice parameter is within 2%. What's more, the error of Ni3Y between calculated lattice constants and the experimental lattice constants is very small. It is important to note that the effect of temperature on crystal structure and lattice defects can lead to small discrepancies. In our work, the calculated lattice parameters via using PBEsol functional are a little different from the results obtained from other methods.22 On the other hand, the obtained density of Ni–Y compounds decreases with increasing Y concentration because the density of the Y atom is larger than that of the Ni atom. Ni17Y2 has the largest density with the value of 7.97 g cm−3, while the NiY3 has the minimum values of 4.93 g cm−3.
Table 1 Lattice constant, volume, formation enthalpy (ΔHr) of Ni–Y compounds accompanied with the available theoretical (DFT calculations) and experimental values
| Species |
Structure |
Personal symbol |
Spaces groups |
Lattice constants(Å) |
ρ (g cm−3) |
V (Å3) |
Formation enthalpy (kJ per mol per atom) |
| a |
b |
c |
| Exp. in ref. 1. Exp. in ref. 4. Exp. in ref. 3. Exp. in ref. 2. |
| Ni17Y2 |
Hexagonal |
hP38 |
P63/mmc |
8.36 |
8.36 |
8.10 |
7.97 |
490.16 |
−0.31 |
| Ni5Y |
Hexagonal |
hP6 |
P6/mmm |
4.97 |
4.97 |
3.94 |
7.52 |
84.41 |
−0.42 |
| 4.883b |
4.883b |
3.976b |
| Ni7Y2 |
Trigonal |
hR18 |
R![[3 with combining macron]](https://www.rsc.org/images/entities/char_0033_0304.gif) mH mH |
5.04 |
5.04 |
36.28 |
7.36 |
797.02 |
−0.47 |
| 4.94a |
4.94a |
36.12a |
| Ni3Y |
Trigonal |
hR12 |
R![[3 with combining macron]](https://www.rsc.org/images/entities/char_0033_0304.gif) mH mH |
5.06 |
5.06 |
24.54 |
7.27 |
544.72 |
−0.48 |
| 4.97a |
4.97a |
24.37a |
| 4.9779c |
4.9779c |
24.449c |
| Ni2Y |
Cubic |
cF24 |
Fd![[3 with combining macron]](https://www.rsc.org/images/entities/char_0033_0304.gif) mS mS |
7.31 |
7.31 |
7.31 |
7.01 |
390.76 |
−0.48 |
| 7.181d |
7.181d |
7.181d |
| NiY |
Orthorhombic |
oP8 |
Pnma |
7.42 |
4.11 |
5.59 |
5.75 |
170.57 |
−0.49 |
| 7.12d |
4.1d |
5.51d |
| Ni2Y3 |
Tetragonal |
tP80 |
P41212 |
7.22 |
7.22 |
36.96 |
5.31 |
1924.38 |
−0.41 |
| 7.104d |
7.104d |
36.59d |
| NiY3 |
Orthorhombic |
mP8 |
Pnma |
6.99 |
9.70 |
6.46 |
4.93 |
438.25 |
−0.30 |
The calculated phonon dispersion curves of Ni–Y compounds are shown in Fig. 3. In these Ni–Y compounds, the long range of the Coulomb interactions should lead to the frequencies of longitudinal optical (LO) modes above those of transversal optical (TO) modes. The calculated phonon dispersion curves show no soft modes at any high-symmetry dispersion, suggesting that those compounds are dynamic stable.23 Moreover, the phonon density of state for Ni–Y compounds are shown in Fig. 3, which demonstrates the frequency vibrations are lower than 0.5 THz due to the motion of yttrium element.
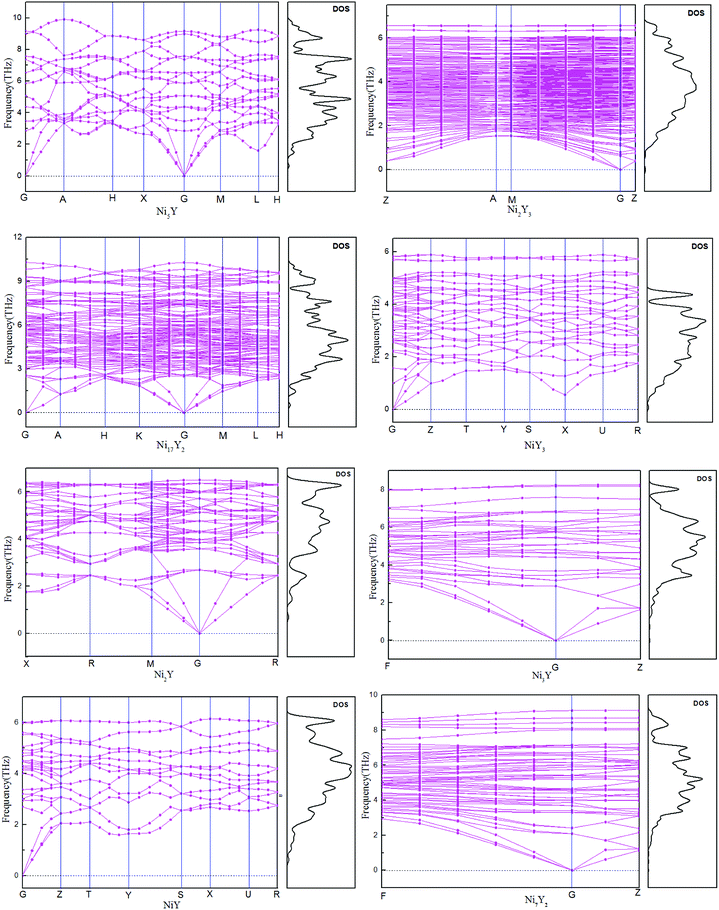 |
| | Fig. 3 The calculated phonon dispersion curves and phonon density of states of Ni–Y compounds. | |
3.2 Thermodynamic stability
The calculated lattice parameters, density, volume, and formation enthalpy of Ni–Y compounds are shown in Table 1. As we know that the structural stability of a material is dominated by many factors that including the chemical bonding, structural type and localized hybridization. The stability of the Ni–Y compounds can be estimated by their formation enthalpies. What's more, the lower the enthalpy is, the more stable the material is. From Fig. 4, the calculated formation enthalpy of Ni–Y compounds is negative values. All compounds are lying on the convex hull, implying that these structures are thermodynamically stable at the ground state. It is noted that, in the Ni–Y compounds, the NiY has the lowest formation enthalpy is −0.494 eV per atom. The stability order of Ni–Y compounds forms the following this sequence: NiY > Ni2Y > Ni3Y > Ni7Y2> Ni5Y > Ni2Y3 > Ni17Y2 > NiY3.
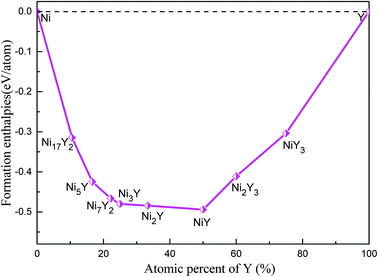 |
| | Fig. 4 The calculated formation enthalpy of Ni–Y compounds as a function of Y concentration. | |
According to the phonon properties calculated within Density-Functional Perturbation Theory (DFPT), the associated thermodynamic properties of Ni–Y systems can be got by the following formula.24 The free energy of the system (F(T)) can be used following expression:
| |
 | (2) |
where
Etotal,
kB,
h, and
ω represent the static total energy, the Boltzmann constant, the reduced Plank constant and the phonon frequency, respectively;
Ezero-point is the zero-point vibrational energy, which is expressed as:
| |
 | (3) |
where
F(
ω) is the phonon density of states. Furthermore, the formation enthalpy depends on temperature, which can be calculated by the formation enthalpy at 0 K and phonon contribution to the formation enthalpy as follows:
| |
 | (4) |
Furthermore, the vibrational entropy and isochoric heat capacity can be calculated by:
| |
 | (5) |
| |
 | (6) |
Fig. 5 shows the predicted thermodynamics of Ni–Y compounds as a function of temperature: (a) enthalpy; (b) Gibbs free energy; (c) entropy; (d) Debye temperature; (e) the isochoric heat capacity of Ni–Y compounds. It can be clearly seen that the enthalpy and entropy increase with the increasing temperature, while the Gibbs free energy decreases in the Ni–Y system. In Fig. 5, the thermodynamic stability of NiY3 is increased with the S value becomes higher. The formation enthalpy increases linearly when the temperature is in the range from 200 K up to 1500 K. From Fig. 5, we know that the heat capacity increases very rapidly when the temperature is below 500 K, and then approaches to a constant based on Dulong–Petit's law: 3nR, where n and R are the total number of atoms per formula and the gas constant, respectively. The heat capacity of Ni3Y and Ni7Y2 is lower than other compounds in Ni–Y system. What's more, at low temperature, the specific heat capacity of Ni–Y compounds forms the following sequence: Ni5Y < Ni7Y2 < Ni3Y < Ni17Y2 < Ni2Y < NiY < Ni2Y3 < NiY3.
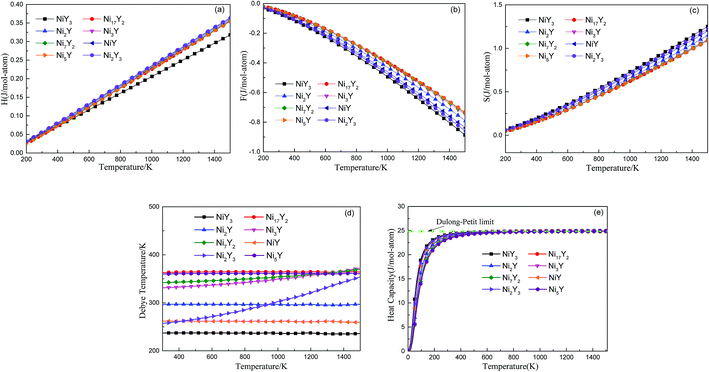 |
| | Fig. 5 The predicted vibration contribution to thermodynamics of Ni–Y compounds from phonon as a function of temperature: (a) enthalpy; (b) Helmholtz free energy; (c) entropy; (d) Debye temperature; (e) the isochoric heat capacity of Ni–Y compounds. | |
In Fig. 5, the Gibbs free energy is calculated by using the temperature-dependent formation enthalpy and entropy at 0 K. As we know that the lattice stability can be described by the Debye temperature. The higher the Debye temperature is, the stronger the lattice stability is.25 The calculated Debye temperatures of Ni–Y compounds are shown in Fig. 5, the similar trend can be seen for the Debye temperature of Ni–Y compounds except for Ni2Y3 which increases with the varied temperature from 300 K to 1500 K. What's more, the Ni17Y2 has the highest Debye temperature while NiY3 has the smallest Debye temperature due to different crystal structure and stoichiometric.
3.3 Elastic constants and polycrystalline modulus
The elastic stiffness tensor elements Cij of the Ni–Y compounds are calculated via first principle calculations with the stress–strain method based on the Hook's law.26 These results are summarized in Table 2. The elastic stiffness tensor is the fundamental mechanical property, which is very beneficial to understand the mechanical properties of the Ni–Y phases.
Table 2 The calculated independent elastic constants (Cij) of Ni–Y compounds and the units are GPa
| Species |
C11 |
C22 |
C33 |
C44 |
C55 |
C66 |
C12 |
C13 |
C14 |
C15 |
C16 |
C23 |
C24 |
C25 |
C26 |
C34 |
C35 |
C36 |
C46 |
| Ni |
248.63 |
|
|
114.24 |
|
|
171.59 |
|
|
|
|
|
|
|
|
|
|
|
|
| Y |
31.07 |
|
|
13.50 |
|
|
47.18 |
|
|
|
|
|
|
|
|
|
|
|
|
| Ni17Y2 |
284.85 |
|
303.91 |
69.16 |
|
|
121.16 |
108.31 |
|
|
|
|
|
|
|
|
|
|
|
| Ni5Y |
298.92 |
|
294.31 |
79.85 |
|
|
158.37 |
107.85 |
|
|
|
|
|
|
|
|
|
|
|
| Ni7Y2 |
226.83 |
213.27 |
229.38 |
64.74 |
64.64 |
60.28 |
100.05 |
97.55 |
8.09 |
−2.06 |
−0.34 |
93.73 |
8.09 |
−10.46 |
−0.9 |
7.95 |
−5.98 |
−1.68 |
−4.26 |
| Ni3Y |
232.91 |
225.83 |
233.76 |
63.72 |
63.72 |
64.81 |
99.72 |
94.51 |
0.24 |
7.62 |
4.68 |
90.51 |
0.23 |
−3.99 |
4.64 |
0.16 |
2.11 |
5.09 |
−5.79 |
| Ni2Y |
205.58 |
|
|
63.74 |
|
|
113.33 |
|
|
|
|
|
|
|
|
|
|
|
|
| NiY |
141.21 |
141.83 |
81.01 |
39.94 |
34.92 |
40.12 |
83.8 |
62.61 |
|
|
|
52.11 |
|
|
|
|
|
|
|
| Ni2Y3 |
120.48 |
|
67.99 |
27.35 |
|
33.25 |
71.21 |
68.17 |
|
|
|
|
|
|
|
|
|
|
|
| NiY3 |
105.70 |
71.15 |
96.90 |
21.18 |
29.65 |
31.66 |
34.54 |
45.99 |
|
|
|
32.51 |
|
|
|
|
|
|
|
The C11, C22, and C33 of cubic Ni2Y are similar due to the symmetry of the crystal structure. C11, C22, and C33 represent the uniaxial stress along the [100], [010], [001] direction, respectively. While C44, C55, and C66 indicate the shearing strength at (100), (010) and (001) crystal plane, respectively. C12 represents resist shear deformation at (100) crystal plane along the [110] direction. In Table 2, the value of Ni5Y is 298.92 GPa which is larger than other Ni–Y compounds, indicating that Ni5Y is hard to be compressed under the external uniaxial stress along [100] direction. It has the largest C44 value is 79.85 GPa at (100) plane. While NiY3 has the smallest values of C12 that indicate a strong shear deformation. The values of C11 change from 105 GPa up to 298 GPa.
There are eight crystal structure types of the Ni–Y compounds which including cubic, tetragonal, rhombohedral, hexagonal, and orthorhombic. As shown in Tables 1 and 2, NiY and NiY3 are the orthorhombic types, which has 9 independent elastic stiffness tensor elements. Ni2Y has a cubic structure with 3 independent elastic stiffness tensor elements. Ni7Y2 and Ni3Y are the rhombohedral structure, Ni2Y3 is the tetragonal type with 6 independent elastic stiffness tensor elements. As for Ni5Y and Ni17Y2, there are 5 independent elastic stiffness tensor elements.
Based on these calculated elastic stiffness tensor of Ni–Y compounds and according to the mechanical stability criteria.27 The formulas of elastic moduli and mechanical stability criteria for the considered crystal systems are introduced. The condition C12 < B < C11 is used in order to study the hardness of a material. The elastic constants obey the mechanical stability conditions based on the Born Standard28 for a different structure.
The bulk modulus and shear modulus of Ni–Y compounds are computed according to the Voigt–Reuss–Hill (VRH) approximation.29 Therefore, Young's modulus and Poisson's ratios are obtained by the relationships between bulk modulus and shear modulus.30,31
| | |
ν = (3B − 2G)/(6B + 2G)
| (8) |
The results of B, G, E and ν of Ni–Y compounds are listed in Table 3. What's more, from Fig. 6(a), with the Y concentration increasing, the trend of shear modulus of Ni–Y compounds is similar to Young's modulus and Bulk modulus. The calculated shear modulus of Ni–Y compounds decreases with the increase of Y concentration except for Ni3Y and NiY3. Therefore, the variation of shear modulus is related to the Y concentration and chemical bonds which includes the bonding type and orientation of bond. The values of bulk modulus and Young's modulus are changed from 60 GPa up to 200 GPa. The obtained bulk modulus, shear modulus and Young's modulus of Ni5Y are 181.71 GPa, 79.75 GPa, and 208.7 GPa, respectively, which are larger than that of other Ni–Y compounds. The ductile or brittle of materials can be determined by the B/G ratio and Poisson's ratio. Furthermore, the degree of orientation of chemical bonds is controlled by the Poisson's ratio.32 The Poisson's ratio of Ni–Y compounds as a function of Y concentration is shown in Fig. 6(b). For this purpose, Pugh's criteria33 is used. According to this criteria, a compound is ductile when B/G > 1.75, otherwise brittle if B/G < 1.75. From Table 3 analysis, the value B/G > 1.75 in Ni–Y systems, so all the Ni–Y compounds show ductile behavior. The calculated elastic constants Cij of Ni–Y compounds are summarized in Table 2. The mechanical stability of a crystal implies that the strain energy must be positive, then the determinants of the matrices of the principal minors of Cij matrix should be all positive.34 We can analyze the mechanical stability of those compounds in Table 3. The B/G value of all Ni–Y compounds being larger than 1.75 indicates the ductility of these phases. Among them, Ni2Y3 bears the largest B/G value of 3.48, revealing the excellent ductility of this compounds. While the B/G value of others compounds is bigger than 1.75, but no more than 3. Most of the Ni–Y compounds have a high bulk modulus, indicating that they are not easy to be compressed. What's more, the calculated Poisson's ratio of Ni–Y compounds is close to 0.3, suggesting they have stronger metallic bonding. We all know that the value of the bulk modulus is not only related to the atomic radius, but also to the crystal structure.
Table 3 The calculated bulk modulus (B), shear modulus (G), Young's modulus (E), B/G, and Poisson's ratio (ν) and Vickers hardness (GPa) of Ni–Y compounds and the units are GPa
| species |
B |
G |
E |
ν |
B/G |
Hv |
AU |
AB |
AG |
| Ni17Y2 |
172.12 |
79.13 |
205.85 |
0.30 |
2.18 |
7.39 |
0.079 |
0 |
0.008 |
| Ni5Y |
181.71 |
79.75 |
208.70 |
0.31 |
2.27 |
6.89 |
0.106 |
0.003 |
0.010 |
| Ni7Y2 |
138.23 |
62.89 |
163.83 |
0.30 |
2.20 |
5.98 |
0.535 |
0.006 |
0.004 |
| Ni3Y |
139.99 |
65.34 |
169.63 |
0.30 |
2.14 |
6.46 |
0.049 |
0.002 |
0.004 |
| Ni2Y |
144.08 |
55.99 |
148.71 |
0.33 |
2.57 |
3.97 |
0.127 |
0 |
0.013 |
| NiY |
79.01 |
32.82 |
86.49 |
0.32 |
2.41 |
2.52 |
0.534 |
0.070 |
0.037 |
| Ni2Y3 |
74.22 |
21.33 |
58.41 |
0.37 |
3.48 |
0.21 |
1.829 |
0.083 |
0.141 |
| NiY3 |
54.20 |
26.82 |
69.06 |
0.29 |
2.02 |
3.01 |
0.201 |
2.248 |
0.015 |
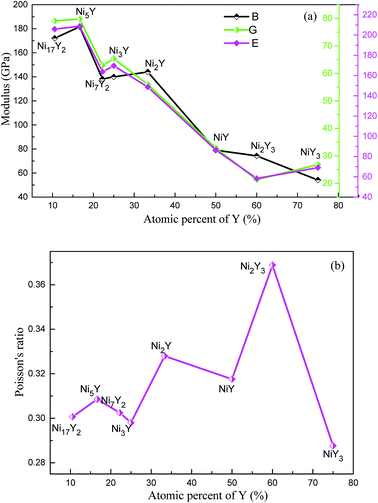 |
| | Fig. 6 (a) The calculated bulk modulus (B), shear modulus (G) and Young's modulus (E) of Ni–Y compounds as a function of Y concentration, (b) the Poisson's ratio (ν) of Ni–Y compounds as a function of Y concentration. | |
The anisotropy of Ni–Y compounds can be described through the universal anisotropic index (AU) and percent anisotropic index (AB and AG) according to following formula:35
| |
 | (9) |
| |
 | (10) |
| |
 | (11) |
where
BV,
BR,
GV and
GR represent the bulk modulus and share modulus estimation within Voigt and Reuss approximations, respectively.
The value of the anisotropy index is close to zero, and the greater the deviation from zero indicates the more anisotropy of the material. The results are listed in Table 3. Ni2Y3 has the highest values of the AU, indicating that the elastic properties of Ni2Y3 in Ni–Y compounds have the strongest anisotropy. Similarly, the value of AG, AB also confirmed the results. Ni2Y3 has the largest values 0.141 of the AG, representing that the anisotropy of bulk modulus is weak. What's more, the three-dimensional (3D) surface contour offers a more detailed and visual elastic anisotropy. For the hexagonal structure in any directions was given by ref. 36.
| |
 | (12) |
For monoclinic structure:
| |
 | (13) |
For orthorhombic structure:
| |
 | (14) |
Eqn (14) can be applied in the tetragonal and cubic structure. Where Sij is the usual elastic compliance constant, which is obtained from the inverse of the matrix of the elastic constants, and l1, l2, l3 are the direction cosines. The result surface contours of Young's modulus for Ni–Y compounds are illustrated in Fig. 7. We can see that Young's modulus of Ni–Y compounds have different surface construction due to they have a different crystal structure, the shape of planar contours and size of Ni–Y compounds are also different. The 3D directional dependence of a solid with a spherical shape suggests isotropic. While the deviation degree of spherical shape has a certain response to the degree of anisotropy, and more deviation means more elastic anisotropy. The strong anisotropy of Young's modulus for Ni–Y compounds are shown by deviating from the normal ellipse at (001) and (110) plane. We can see that all compounds possess anisotropy from Fig. 7. It is obvious that the planar contours of the Ni5Y have the maximum Young's modulus along the axes on (001) and (110) plane. NiY and Ni2Y have the same planar contours on (001) and (110) plane while the value is different.
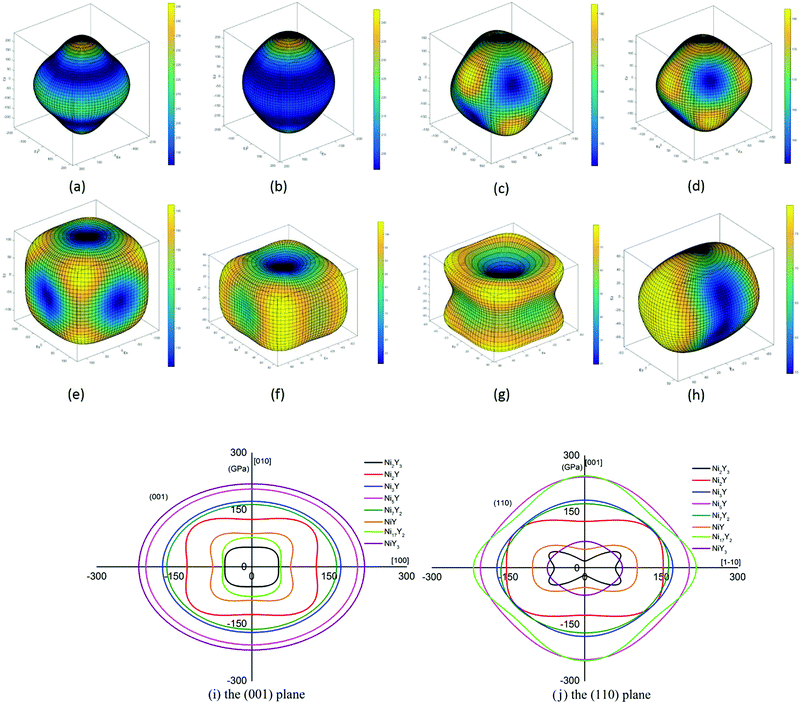 |
| | Fig. 7 (a–h) (a) Ni17Y2, (b) Ni5Y, (c) Ni7Y2, (d) Ni3Y, (e) Ni2Y, (f) NiY, (g) Ni2Y3, (h) NiY3. The surface contours of the Young's modulus of Ni–Y compounds. (i and j) The (001) and (110) plane projections of Ni–Y compounds. | |
In addition, the theoretical hardness of Ni–Y compounds can be calculated according to the semiempirical hard model.
| | |
Hv = 2 × (k2 × G)0.585 − 3
| (15) |
where
k represents the
B/
G ratio and
G is the shear modulus. The results Ni–Y compounds are shown in
Table 3. The hardness of Ni–Y compound gradually decreases with the increase of Y element concentration except for the Ni
2Y
3 and NiY
3. The Ni
5Y has the largest hardness as 6.89 GPa while Ni
2Y
3 has the smallest value with 0.21 GPa due to different atomic constitute and disparate crystal types. The similar phenomenon can be observed between shear modulus and bulk modulus in those compounds. From the above discussion, we can get a result that these compounds are not potential superhard materials.
3.4 Electronic structure
To our knowledge, a density of states can be used as a visual result of band structure. A lot of analysis has common ground with energy band analysis, and many terms of density of states are interlinked with band analysis. It's much broader in the outcome discussion than the band analysis because it's more intuitive. Electron charge density shows the bonding nature of the compound whether it is ionic or covalent. The total density of state (TDOS) and partial density of state (PDOS) for Ni–Y compounds are shown as Fig. 8, and the dashed line represents the Fermi level (EF). It is clear that some bands are across the EF, indicating that those Ni–Y compounds exhibit metallic behavior. It is noted that the DOS profiles of those Ni–Y compounds are contributed by the Ni-4d state, Ni-5s state, Y-3d state and Y-4s state. The strong hybridization between the Ni atom and the Y atom forms the strong Ni–Y bonds along the d–d directions.
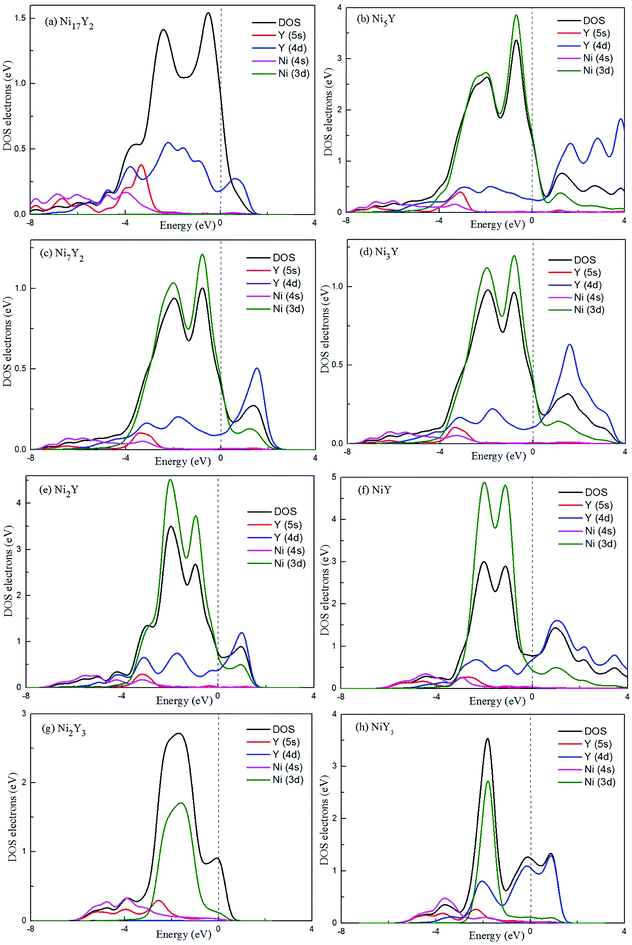 |
| | Fig. 8 The total density of state (TDOS) and partial density of state (PDOS) for Ni–Y compounds, the dashed line represents the Fermi energy. | |
In Fig. 8, the low-energy part of the DOS consists mainly of NNi(ε) and the high-energy part consists of NY(ε). Because of the 3d–4d hybridization, it is not zero even in the high-energy region. These facts are seen in the calculated DOS by M. Shimizu et al.3 Obviously, the bandwidth of Ni5Y is the range from −8 up to 12, which is larger than that of other Ni–Y compounds. These results are attributed to the overlap of the wave functions between the Y atoms increases. It is clear that Ni–Y compounds are the metallic character due to the finite value of the DOS at Fermi level (EF). According to the lower the N(EF) is, the better the stability of the DOS at the Fermi level.37 The value of Ni2Y3 near Fermi energy level is higher than other compounds, indicating that Ni2Y3 is less stable, which accords with analysis on the formation enthalpy in Fig. 4. What's more, the different concentration of Y affects the localized hybridization and chemical bonding between Ni atoms and Y atoms. To further gain some insight into the correlation between the mechanical properties and chemical bonding, Fig. 9 shows the contours of electron density difference of Ni–Y compounds. The blue region represents the accumulation of electronic charge. The red region is consistent with the depletion of electronic charge. It further indicates that Ni–Y metallic bonds are observed in these compounds, which accords with analysis on the TDOS and PDOS in Fig. 8. For Ni–Y compounds, the depletion of electronic charge is obvious between Ni–Ni and Y–Y, while is weaker among Ni atoms and Y atoms. All of the valence electron density show symmetry except for the NiY and Ni2Y. The strong electron delocalization occurs in the Ni–Y lattice, and the electron is distributed through the matrix map, indicating the metal bond interaction between the metal atoms.
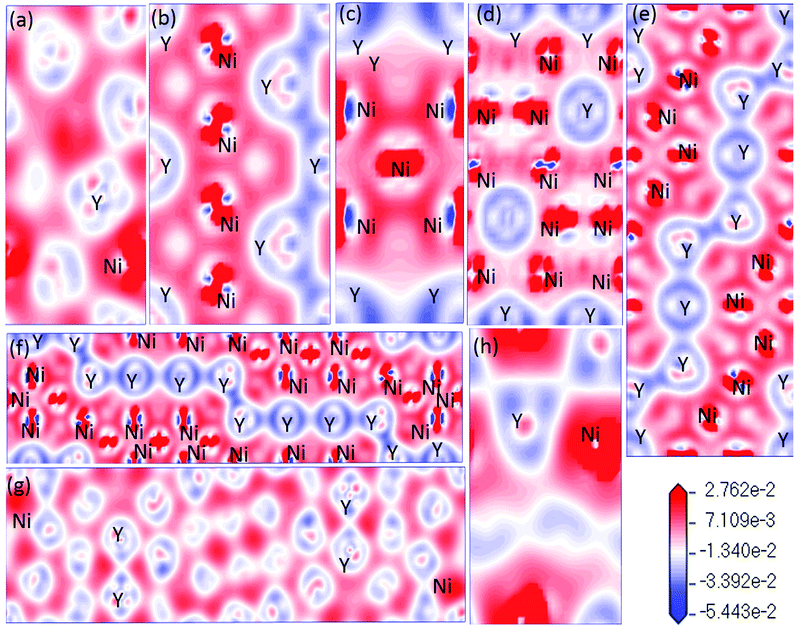 |
| | Fig. 9 (a–h) (a) NiY3, (b) Ni2Y, (c) Ni5Y, (d) Ni17Y2, (e) Ni3Y, (f) Ni7Y2, (g) Ni2Y3, (h) NiY. The differences of charge density distribution for stable Ni–Y compounds in the (110) plane. | |
What's more, some quantitative information for the transferred charge of the Ni–Y compounds are shown in Table 4. The bond length and the population value of the chemical bond are calculated, according to following equation,38 we can get the average bond length and the average bond population.
| |
 | (16) |
| |
 | (17) |
where
![[L with combining macron]](https://www.rsc.org/images/entities/i_char_004c_0304.gif)
(AB) and
![[n with combining macron]](https://www.rsc.org/images/entities/i_char_006e_0304.gif)
(AB) express the average bond length and the mean bond population, respectively. In the cell,
Ni is the total number of i bond and
Li is the bond length of i type. From the
Table 4 and
Fig. 10(a), the positive charges carried by Ni atoms vary from 0.01 to 0.36 electrons, while the negative charges is from −0.01 to −0.11 electrons. But for Y atoms, the positive charges is in the range 0.01 to 0.1 electrons, and the negative charges are in the range −0.01 to −0.75 electrons. In
Fig. 10(b), we can know that the value of an average length of Ni–Y is about 2.9 Å, so their ionicity is roughly the same. However, the ionicity of Ni
2Y
3 is slightly stronger than the other compounds, while the shortest Ni–Y is Ni
5Y, as 2.87 Å, the similar trend can be obtained from
Fig. 7. From
Fig. 10(b), it is clear that the Ni–Ni bonding is shorter than the Ni–Y bonding. As everyone knows the bond population is proportional to the strength of the bonding. The bond population of Ni
7Y
2 is larger than the other compounds in Ni–Y alloys. So, it is the stronger chemical bonding. From
Table 4, Ni
7Y
2 and Ni
3Y have not only the Ni–Y strong metallic character but also the covalent as the bond population is greater than 0.35.
Table 4 Population analysis of Ni–Y compounds, the calculated average bond length (![[L with combining macron]](https://www.rsc.org/images/entities/i_char_004c_0304.gif) (AB) (Å)) and the mean bond population (
(AB) (Å)) and the mean bond population (![[n with combining macron]](https://www.rsc.org/images/entities/i_char_006e_0304.gif) (AB) (e)) are shown
(AB) (e)) are shown
| Species |
Atom |
s |
p |
d |
Total |
Charge (e) |
Band |
![[L with combining macron]](https://www.rsc.org/images/entities/i_char_004c_0304.gif) (AB) (Å) (AB) (Å) |
![[n with combining macron]](https://www.rsc.org/images/entities/i_char_006e_0304.gif) (AB) (e) (AB) (e) |
| Ni17Y2 |
Ni1 |
0.68 |
0.53 |
8.72 |
9.92 |
0.08 |
Ni–Y |
2.91 |
0.22 |
| Ni2 |
0.61 |
0.45 |
8.72 |
9.78 |
0.22 |
Ni–Ni |
2.39 |
0.11 |
| Ni3 |
0.67 |
0.56 |
8.69 |
9.93 |
0.07 |
|
|
|
| Ni4 |
0.49 |
0.36 |
8.73 |
9.59 |
0.41 |
|
|
|
| Y1 |
0.58 |
2.15 |
1.85 |
4.59 |
−1.59 |
|
|
|
| Y2 |
0.57 |
1.85 |
1.81 |
4.23 |
−1.23 |
|
|
|
| Ni5Y |
Ni1 |
0.64 |
0.31 |
8.74 |
9.69 |
0.31 |
Ni–Y |
2.87 |
−0.19 |
| Ni2 |
0.77 |
0.48 |
8.71 |
9.96 |
0.04 |
Ni–Ni |
2.61 |
0.22 |
| Y |
0.54 |
1.37 |
1.84 |
3.75 |
−0.75 |
|
|
|
| Ni7Y2 |
Ni1 |
0.63 |
0.27 |
8.74 |
9.64 |
0.36 |
Ni–Y |
2.92 |
0.45 |
| Ni2 |
0.64 |
0.27 |
8.75 |
9.65 |
0.35 |
Ni–Ni |
2.55 |
0.12 |
| Ni3 |
0.79 |
0.54 |
8.77 |
10.11 |
−0.11 |
|
|
|
| Ni4 |
0.75 |
0.46 |
8.72 |
9.93 |
0.07 |
|
|
|
| Ni5 |
0.76 |
0.50 |
8.74 |
10.00 |
0 |
|
|
|
| Y1 |
0.49 |
1.22 |
1.82 |
6.54 |
−0.54 |
|
|
|
| Y2 |
0.38 |
0.86 |
1.98 |
3.22 |
−0.22 |
|
|
|
| Ni3Y |
Ni1 |
0.79 |
0.54 |
8.77 |
10.10 |
−0.10 |
Ni–Y |
2.94 |
0.39 |
| Ni2 |
0.61 |
0.24 |
8.75 |
9.60 |
0.40 |
Ni–Ni |
2.62 |
0.14 |
| Ni3 |
0.75 |
0.50 |
8.74 |
9.99 |
0.01 |
|
|
|
| Y1 |
0.38 |
0.82 |
1.97 |
3.18 |
−0.18 |
|
|
|
| Y2 |
0.45 |
1.12 |
1.81 |
3.38 |
−0.38 |
|
|
|
| Ni2Y |
Ni |
0.74 |
0.54 |
8.77 |
10.05 |
−0.05 |
Ni–Ni |
2.59 |
0.14 |
| Y |
0.3 |
0.63 |
1.97 |
2.9 |
0.1 |
| NiY |
Ni |
0.86 |
0.27 |
8.83 |
9.96 |
0.04 |
Ni–Y |
2.96 |
0.28 |
| Y |
0.64 |
0.54 |
1.86 |
3.04 |
−0.04 |
Ni–Ni |
2.48 |
0.22 |
| Ni2Y3 |
Ni1 |
0.85 |
0.25 |
8.84 |
9.94 |
0.06 |
Ni–Y |
2.95 |
0.29 |
| Ni2 |
0.83 |
0.33 |
8.85 |
10.01 |
−0.01 |
Ni–Ni |
2.53 |
0.11 |
| Ni3 |
0.84 |
0.36 |
8.85 |
10.05 |
−0.05 |
|
|
|
| Ni4 |
0.84 |
0.22 |
8.84 |
9.91 |
0.09 |
|
|
|
| Y1 |
0.66 |
0.49 |
1.86 |
3.01 |
−0.01 |
|
|
|
| Y2 |
0.66 |
0.50 |
1.86 |
3.01 |
−0.01 |
|
|
|
| Y3 |
0.63 |
0.50 |
1.90 |
3.03 |
−0.03 |
|
|
|
| Y4 |
0.65 |
0.49 |
1.85 |
2.99 |
0.01 |
|
|
|
| Y5 |
0.63 |
0.47 |
1.85 |
2.96 |
0.04 |
|
|
|
| Y6 |
0.64 |
0.50 |
1.89 |
3.03 |
−0.03 |
|
|
|
| Y7 |
0.66 |
0.58 |
1.90 |
3.14 |
−0.14 |
|
|
|
| NiY3 |
Ni1 |
0.83 |
0.41 |
8.84 |
10.08 |
−0.08 |
Ni–Y |
2.85 |
0.30 |
| Y1 |
0.60 |
0.43 |
1.93 |
2.96 |
0.04 |
|
|
|
| Y2 |
0.61 |
0.47 |
1.91 |
3.00 |
0.00 |
|
|
|
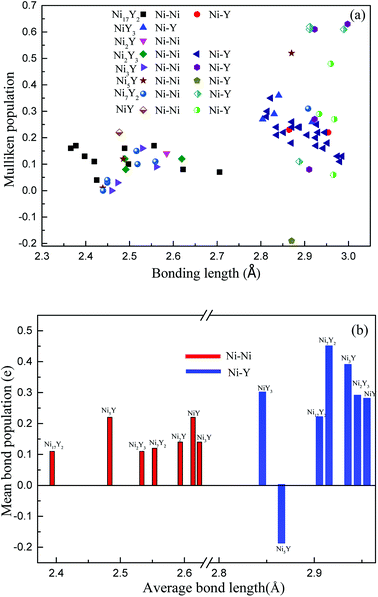 |
| | Fig. 10 (a) The calculated Mulliken's overlap population of Ni–Y compounds; (b) the mean bond population of Ni–Y compounds. | |
4. Conclusion
In summary, the stability, elastic properties, mechanical properties and electronic structures of the Ni17Y2, Ni5Y, Ni7Y2, Ni3Y, Ni2Y, NiY, Ni2Y3 and NiY3 in the Ni–Y system are assessed in detail via first principle calculations in the present work. Firstly, we discuss the thermodynamic properties of Ni–Y compounds in detail. The calculated phonon distribution curves of Ni–Y compounds have no soft mode, indicating that all compounds are thermodynamic stability. The elastic stiffness tensors and properties of these Ni–Y compounds including bulk modulus, shear modulus, Young's modulus, and Poisson's ratio are calculated. With the lower the enthalpy of formation is, the more stable the compounds are. The stability of these compounds forms the following sequence: NiY > Ni2Y > Ni3Y > Ni7Y2> Ni5Y > Ni2Y3 > Ni17Y2 > NiY3 in the Ni–Y compounds. All Ni–Y compounds have a high bulk modulus, indicating that they are difficult to be compressed. Ni5Y has the largest bulk modulus which the value is 181.71 GPa. We also analyze the different bulk modulus value of Ni–Y compounds due to the different Y content and various crystal structures. Based on the analysis of the electronic structure, Ni7Y2 and Ni3Y have not only the Ni–Y strong metallic character but also the covalent as the bond population is greater than 0.35, thus showing very strong mechanical properties. And this work would be significant for understanding the further application of Ni–Y compounds in the future.
Conflicts of interest
There are no conflicts to declare.
Acknowledgements
This work was supported by Key Project of Science & Technology in Yunnan Province, (No. 2018ZE019) and Yunnan Education Department Scientific Research Fund Project, (No. 2017ZZX134) and Kunming University of Science and Technology Natural Science Research Fund Project (Provincial People Training Project) (No. KKSY201651036).
References
- B. J. Beaudry and A. H. Daane, Trans. Metall. Soc. AIME, 1960, 218, 854 CAS.
- A. G. Kuchin, V. P. Glazkov, D. P. Kozlenko and B. N. Savenko, Binary ordered alloys and intermetallic compounds, Springer-Verlag, Berlin Heidelberg, 2014, vol. 162, pp. 138–139 Search PubMed.
- M. Shimizu, J. Inoue and S. Nagasawat, J. Phys. F: Met. Phys., 1984, 2673–2687 CrossRef CAS.
- P. Villars and K. Cenzual, Pearson's crystal data – crystal structure database for inorganic compounds (on CD-ROM), ASM International, Materials Park, OH, 2009, pp. 681–682 Search PubMed.
- R. Lemaire and D. Paccard, Bull. Soc. Fr. Mineral. Cristallogr., 1969, 92, 9 CAS.
- X. Y. Jiang, Z. C. Zhong and A. L. Greer, Mater. Sci. Eng., A, 1997, 226–228, 789–793 CrossRef.
- Y. M. Soifer, N. P. Kobelev, L. G. Brodova, A. N. Mannkhin and E. Korin, Nanostruct. Mater., 1999, 12, 875–878 CrossRef.
- J. Beille, D. Gifnoux, R. Lemaire, M. Shimizu and J. Voiron, Phys., 1983, 119B, 133–141 Search PubMed.
- Z. M. Du and D. X. Lu, Intermetallics, 2005, 13, 586–595 CrossRef CAS.
- Z. M. Du and W. J. Zhang, J. Alloys Compd., 1996, 245, 164–167 CrossRef CAS.
- Z. M. El-Bahy, Appl. Catal., A, 2013, 468, 175–183 CrossRef CAS.
- H. Xia, F. Drymiotis, C. L. Chen, A. Wu and G. J. Snyder, J. Mater. Sci., 2014, 1716–1723 CrossRef CAS.
- M. A. Shevchenko, M. I. Ivanov, V. V. Berezutskii, V. G. Kudin and V. S. Sudavtsova, Russ. J. Phys. Chem. A, 2014, 88, 897–902 CrossRef CAS.
- S. Kardellass, C. Servan, N. Selhaoui, A. Iddaoudi, M. AitAmar and L. Bouirden, Calphad, 2013, 42, 59–65 CrossRef CAS.
- Y. J. Hu, Y. Wang, S. A. Firdosy, K. E. Star, J. P. Fleurial, V. A. Ravi and Z. K. Liu, Calphad, 2017, 59, 207–217 CrossRef CAS.
- N. Mattern, M. Zinkevich, W. Löser, G. Behr and J. Acker, J. Phase Equilib. Diffus., 2008, 29, 141–155 CrossRef CAS.
- M. D. Segall, P. J. D. Lindan, M. J. Probert, C. J. Pickard, P. J. Hasnip, S. J. Clark and M. C. Payne, J. Phys.: Condens. Matter, 2002, 14, 2717–2744 CrossRef CAS.
- J. P. Perdew, K. Burke and M. Ernzerhof, Phys. Rev. Lett., 1996, 77, 3865–3868 CrossRef CAS PubMed.
- D. Vanderbilt, Phys. Rev. B: Condens. Matter Mater. Phys., 1990, 41, 7892–7895 CrossRef.
- M. Zhang, H. Wang, H. Wang, T. Cui and Y. Ma, J. Phys. Chem. C, 2010, 114, 6722–6725 CrossRef CAS.
- Q. Li, D. Zhou, W. Zheng, Y. Ma and C. Chen, Phys. Rev. Lett., 2013, 110, 136403 CrossRef PubMed.
- J. D. Head and M. C. Zerner, Chem. Phys. Lett., 1985, 122, 264–270 CrossRef CAS.
- X. Y. Chong, Y. H. Jiang, R. Zhou and J. Feng, Ceram. Int., 2016, 42, 2117–2132 CrossRef CAS.
- S. Baroni, S. D. Gironcoli, A. D. Corso and P. Giannozzi, Rev. Mod. Phys., 2001, 73, 515–562 CrossRef CAS.
- X. Y. Chong, Y. H. Jiang, R. Zhou, H. Zhu and J. Feng, Comput. Mater. Sci., 2015, 108, 205–211 CrossRef CAS.
- J. J. Han, C. P. Wang, X. J. Liu, Y. Wang and Z. K. Liu, J. Phys.: Condens. Matter, 2012, 24, 505503 CrossRef CAS PubMed.
- G. Grimvall, Thermo physical properties of materials, Elsevier, 1999, vol. 39, pp. 273–297 Search PubMed.
- M. Born and K. Huang, Dynamical theory of crystal lattices, Clarendon Press, Oxford, 1954, vol. 141, p. 141 Search PubMed.
- R. W. Hill, Proc. Phys. Soc., 1952, 65, 349 CrossRef.
- B. Xiao, J. Feng, C. T. Zhou, Y. H. Jiang and R. Zhou, J. Appl. Phys., 2011, 109, 083521 CrossRef.
- X. L. Yuan, D. Q. Wei, X. R. Chen, Q. M. Zhang and Z. Z. Gong, J. Alloys Compd., 2011, 509, 769–774 CrossRef CAS.
- N. Korozlu, K. Colakoglu, E. Deligoz and S. Aydin, J. Alloys Compd., 2013, 546, 157–164 CrossRef CAS.
- S. F. Pugh, Philos. Mag., 1954, 45, 823–843 CAS.
- F. Milstein, Phys. Rev. B: Condens. Matter Mater. Phys., 1971, 3, 1130 CrossRef.
- S. I. Ranganathan and M. Ostojastarzewski, Phys. Rev. Lett., 2008, 101, 055504 CrossRef PubMed.
- J. F. Nye, Hysical properties of crystals, Oxford University Press, Oxford, 1985 Search PubMed.
- W. Huang and Y. A. Chang, Intermetallics, 1998, 6, 487–498 CrossRef CAS.
- B. Xiao, J. D. Xing, J. Feng, C. T. Zhou, Y. F. Li, W. Su, X. J. Xie and Y. H. Cheng, J. Phys. D: Appl. Phys., 2009, 42, 115415 CrossRef.
|
| This journal is © The Royal Society of Chemistry 2018 |
Click here to see how this site uses Cookies. View our privacy policy here.  Open Access Article
 a,
MingYu Hu
 a,
Pei Yana,
Xiaoli Shia,
XiaoYu Chong*b and
Jing Feng*a
![[3 with combining macron]](https://www.rsc.org/images/entities/char_0033_0304.gif) mH, no. 166); Ni3Y with a rhombohedral structure (R
mH, no. 166); Ni3Y with a rhombohedral structure (R![[3 with combining macron]](https://www.rsc.org/images/entities/char_0033_0304.gif) mH, no. 166); Ni2Y with a cubic structure (Fd
mH, no. 166); Ni2Y with a cubic structure (Fd![[3 with combining macron]](https://www.rsc.org/images/entities/char_0033_0304.gif) mS, no. 227); NiY with a orthorhombic structure (Pnma, no. 62); Ni2Y3 with a tetragonal structure (P41212, no. 92); and the NiY3 with an orthorhombic structure (Pnma, no. 62).
mS, no. 227); NiY with a orthorhombic structure (Pnma, no. 62); Ni2Y3 with a tetragonal structure (P41212, no. 92); and the NiY3 with an orthorhombic structure (Pnma, no. 62).


![[3 with combining macron]](https://www.rsc.org/images/entities/char_0033_0304.gif) mH
mH![[3 with combining macron]](https://www.rsc.org/images/entities/char_0033_0304.gif) mH
mH![[3 with combining macron]](https://www.rsc.org/images/entities/char_0033_0304.gif) mS
mS


![[L with combining macron]](https://www.rsc.org/images/entities/i_char_004c_0304.gif) (AB) and
(AB) and ![[n with combining macron]](https://www.rsc.org/images/entities/i_char_006e_0304.gif) (AB) express the average bond length and the mean bond population, respectively. In the cell, Ni is the total number of i bond and Li is the bond length of i type. From the Table 4 and Fig. 10(a), the positive charges carried by Ni atoms vary from 0.01 to 0.36 electrons, while the negative charges is from −0.01 to −0.11 electrons. But for Y atoms, the positive charges is in the range 0.01 to 0.1 electrons, and the negative charges are in the range −0.01 to −0.75 electrons. In Fig. 10(b), we can know that the value of an average length of Ni–Y is about 2.9 Å, so their ionicity is roughly the same. However, the ionicity of Ni2Y3 is slightly stronger than the other compounds, while the shortest Ni–Y is Ni5Y, as 2.87 Å, the similar trend can be obtained from Fig. 7. From Fig. 10(b), it is clear that the Ni–Ni bonding is shorter than the Ni–Y bonding. As everyone knows the bond population is proportional to the strength of the bonding. The bond population of Ni7Y2 is larger than the other compounds in Ni–Y alloys. So, it is the stronger chemical bonding. From Table 4, Ni7Y2 and Ni3Y have not only the Ni–Y strong metallic character but also the covalent as the bond population is greater than 0.35.
(AB) express the average bond length and the mean bond population, respectively. In the cell, Ni is the total number of i bond and Li is the bond length of i type. From the Table 4 and Fig. 10(a), the positive charges carried by Ni atoms vary from 0.01 to 0.36 electrons, while the negative charges is from −0.01 to −0.11 electrons. But for Y atoms, the positive charges is in the range 0.01 to 0.1 electrons, and the negative charges are in the range −0.01 to −0.75 electrons. In Fig. 10(b), we can know that the value of an average length of Ni–Y is about 2.9 Å, so their ionicity is roughly the same. However, the ionicity of Ni2Y3 is slightly stronger than the other compounds, while the shortest Ni–Y is Ni5Y, as 2.87 Å, the similar trend can be obtained from Fig. 7. From Fig. 10(b), it is clear that the Ni–Ni bonding is shorter than the Ni–Y bonding. As everyone knows the bond population is proportional to the strength of the bonding. The bond population of Ni7Y2 is larger than the other compounds in Ni–Y alloys. So, it is the stronger chemical bonding. From Table 4, Ni7Y2 and Ni3Y have not only the Ni–Y strong metallic character but also the covalent as the bond population is greater than 0.35.
![[L with combining macron]](https://www.rsc.org/images/entities/i_char_004c_0304.gif) (AB) (Å)) and the mean bond population (
(AB) (Å)) and the mean bond population (![[n with combining macron]](https://www.rsc.org/images/entities/i_char_006e_0304.gif) (AB) (e)) are shown
(AB) (e)) are shown
![[L with combining macron]](https://www.rsc.org/images/entities/i_char_004c_0304.gif) (AB) (Å)
(AB) (Å)![[n with combining macron]](https://www.rsc.org/images/entities/i_char_006e_0304.gif) (AB) (e)
(AB) (e)


