Mercury-free nitrogen-doped activated carbon catalyst: an efficient catalyst for the catalytic coupling reaction of acetylene and ethylene dichloride to synthesize the vinyl chloride monomer
Zhaobing
Shen
a,
Hong
Zhao
a,
Yue
Liu
a,
Zeyuan
Kan
a,
Ping
Xing
b,
Jinguang
Zhong
a and
Biao
Jiang
 *ab
*ab
aGreen Chemical Engineering Research Centre, Shanghai Advanced Research Institute, Chinese Academy of Sciences, No. 99 Haike Road, Zhangjiang Hi-Tech Park, Pudong Shanghai, P. R. China
bShanghai Green Chemical Engineering Research Centre, Shanghai Institute of Organic Chemistry, No. 345 Lingling Road, Shanghai, P. R. China. E-mail: jiangb@sioc.ac.cn
First published on 11th January 2018
Abstract
The global “Minamata Convention on Mercury” came into effect in 2017 exerting huge environmental pressure on acetylene-based polyvinyl chloride (PVC) processes. Research and development of mercury-free catalytic synthesis technologies for the entire PVC industry and even the sustainable development of the chlor-alkali industry are of great significance. Here, we report the catalyzed coupling reaction of acetylene and ethylene dichloride to synthesize vinyl chloride over a mercury-free, nitrogen-doped activated carbon catalyst (N@AC). The catalyst delivered stable performance with an ethylene dichloride conversion over 95%, acetylene conversion at ∼90%, and selectivity for vinyl chloride over 98% at 260 °C. Both X-ray photoelectron spectroscopy data and catalytic activity of the catalysts revealed pyridinic N to be the active site. The results of this study show that the catalytic coupling reaction of acetylene and ethylene dichloride to synthesize vinyl chloride over a N@AC catalyst has a very attractive prospect in the PVC industry.
1. Introduction
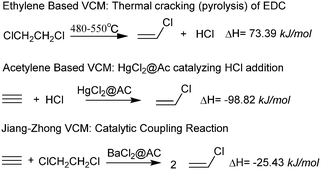
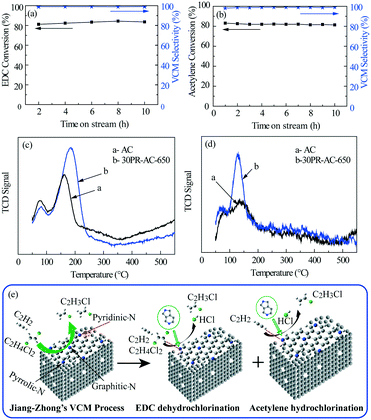
Mercury is a potent toxin that causes cell death, brain damage, and birth defects.1–3 More than 140 nations agreed to a legally binding treaty related to the reduction of mercury release and human use which was signed in October 2013.4,5 The vinyl chloride monomer (VCM) is one of the leading chemicals used, mainly for manufacturing polyvinyl chloride (PVC). PVC has proven to be one of the most versatile commercial thermoplastics, having a broad range of applications from rigid pipes used in construction to thin crystal-clear films for consumer packaging, depending on the formulation. The PVC worldwide production capacity in 2016 was ∼41 million tons, with an annual growth expected at 5%. Currently, commercial VCM capacity can be categorized based on the feedstocks: acetylene and ethylene. Ethylene is the dominant feed source for producing VCMs outside China. Since PVC was first synthesized over 100 years ago, the oldest and simplest commercial route to acetylene-based VCMs6 is via the vapor-phase addition of acetylene (derived from coal/coke) in the presence of anhydrous hydrogen chloride over a 10.5–12.5% mercuric chloride7 catalyst supported on activated carbon (AC). The majority of VCMs in China are produced from coal as a result of oil shortages and the abundance of coal in the country. China is the largest PVC producer in the world (∼25 million tons in 2015), with an annual growth of over 10%. The acetylene-based PVC production capacity has accounted for more than 80% of the total PVC capacity in China, and concomitantly, mercury usage has increased from 800 tons in 2010 to more than 1000 tons in 2015. The global “Minamata Convention on Mercury”8 came into effect on August 16, 2017 and has exerted huge environmental pressure on acetylene-based PVC production. Research and development of mercury-free catalytic synthesis technologies for the entire PVC industry and even the sustainable development of the chlor-alkali industry are major topics of scientific interest.Catalytic reaction coupling technology is an attractive prospect, although such research is relatively under-reported. In fact, the catalytic coupling reaction has several advantages: a) in situ use of by-products from reaction products which are reacted to significantly increase the yield of the main product; b) improve production economics by reducing or eliminating by-product pollution safely; c) reduce extreme reactions (e.g. strong exothermic reactions and heat of absorption reactions) and facilitate ease of operation. Catalytic reaction coupling technology has shown improvements to reactor temperature distribution and the selectivity for the main product leading to enhanced product quality.9 Based on thermal cracking, the elimination of hydrogen chloride from ethylene dichloride (EDC) is a strong endothermic process at temperatures between 480–550 °C with 50% conversion,10 while addition of hydrogen chloride to acetylene is a strong exothermic reaction. We have reported a new process (referred to as the Jiang–Zhong VCM process11) for the catalytic coupling reaction of acetylene and EDC to synthesize vinyl chloride. Indeed, the catalytic coupling reaction of acetylene and EDC over a BaCl2@AC catalyst can occur at temperatures of 200–230 °C with a 70% conversion rate (based on acetylene) and 98% selectivity toward vinyl chloride (Fig. 1).12,13 The elimination of HCI from EDC and the addition of HCl to acetylene occur in situ. The heat of reaction between the endothermic and exothermic reactions in the same reactor achieves the internal balance of the chemical energy. This reaction is highly efficient having low energy consumption and is an example of green chemistry with favorable economics. The new process circumvents mercury pollution and is in the process of commercialization in China.
There is a demand to search for a more environmentally friendly and efficient catalyst for the Jiang–Zhong VCM process, and herein, we report a new metal-free nitrogen-doped AC (N@AC) catalyst, which catalyzes the coupling reaction of acetylene and EDC to synthesize vinyl chloride. The N@AC catalyst exhibits superior performance, with an acetylene conversion to VCM at ∼90% and a selectivity of 98%. Furthermore, the metal-free N@AC catalyst is more environmentally friendly and cost effective than our first generation BaCl2@AC catalyst.
2. Results and discussion
2.1 N@AC catalyst performance
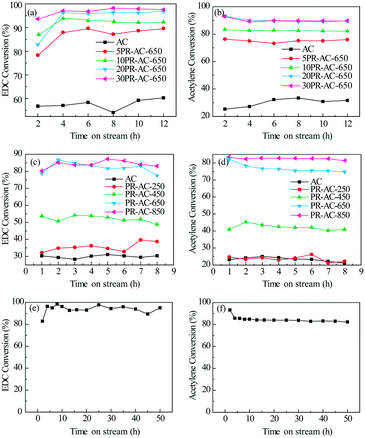
To optimize the performance of the N@AC catalyst, N doping levels and carbonization temperature were varied. The catalytic performance of the N@AC catalysts having different N/AC ratios is shown in Fig. 2a and b and Table 1. AC displayed good selectivity (98.5%) but poor activity (XEDC = 60.1%, XAcetylene (A) = 30.9%), as shown in Table 1, line 1. Compared with AC, the 5PR-AC-650 catalyst dramatically enhanced catalytic activity with EDC and acetylene conversion reaching 89.0% and 74.9%, respectively. EDC and acetylene conversion increased as a function of N doping levels before plateauing between 20% and 30% N content. The conversion of EDC and acetylene exceeded 95% and 89% over the 30PR-AC-650 catalyst with no display of deactivation over a 12 h test period. The addition of nitrogen had a negligible effect on selectivity, however, catalytic activity was significantly enhanced, with catalytic activity decreasing in the order: 30PR-AC-650 > 20PR-AC-650 > 10PR-AC-650 > 5PR-AC-650 > AC.| Catalysts | N precursor content (%) | X EDC (%) | X Acetylene (%) | S VCM (%) | |
|---|---|---|---|---|---|
| a Conditions: temperature = 260 °C, C2H2 gas hourly space velocity (GHSV) = 16 h−1, feed mole ratio EDC/C2H2 = 1.15, reaction time (t) = 12 h. | |||||
| 1 | AC | 0 | 60.1 | 30.9 | 98.5 |
| 2 | 5PR-AC-650 | 5 | 89.0 | 74.9 | 98.2 |
| 3 | 10PR-AC-650 | 10 | 93.1 | 82.1 | 98.4 |
| 4 | 20PR-AC-650 | 20 | 96.5 | 89.5 | 98.6 |
| 5 | 30PR-AC-650 | 30 | 96.8 | 89.9 | 98.5 |
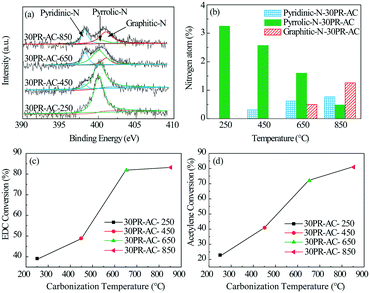
In a further set of experiments, the 30PR-AC catalyst was calcined in a tube furnace under a nitrogen atmosphere at 250, 450, 650, and 850 °C for 4 h. As shown in Fig. 2c and d, a higher conversion rate of EDC and acetylene was obtained at higher calcination temperatures, which implies that the degree of thermal treatment influences active site formation of the N@AC catalysts. The EDC and acetylene conversion results indicate that almost no active sites were produced at 250 °C, while the number of active sites increased dramatically from 450 to 650 °C, before plateauing at 850 °C.
The N@AC catalysts exhibited good stability over a 50 h time-on-stream (Fig. 2e and f), whereas, g-C3N4/AC catalysts, previously reported,14 had obviously deactivated within 7 h. Comparing the strong exothermic reaction of acetylene hydrochlorination in the presence of hydrogen chloride, the catalytic coupling reaction is micro-exothermic for the endothermic reaction of EDC dehydrochlorination. Dehydrochlorination of EDC could transfer and utilize the reaction heat from the acetylene hydrochlorination in the coupling reaction, which is favorable for the equilibrium of acetylene hydrochlorination to move in the positive direction. Besides, it is favorable for low carbon deposition on the catalyst and improvement of the catalyst stability due to the reaction heat transfer of the acetylene hydrochlorination. So, it is reasonable for the coupling reaction to improve catalyst activation in comparison with the acetylene hydrochlorination.
2.2 Catalyst characterization
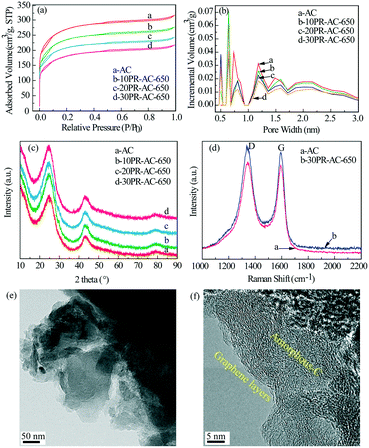
To determine the nature of the N@AC catalysts, detailed structural and chemical studies were performed using a series of characterization methods.| Sample | S BET (m2 g−1) | S micro (m2 g−1) | V total (cm3 g−1) | V micro (cm3 g−1) | D average (nm) | |
|---|---|---|---|---|---|---|
| a S BET: BET surface area. b S micro: BET surface area of micropores. c V total: Single point adsorption total pore volume of pores. d V micro: Single point adsorption pore volume of micropores. e D average: Adsorption average pore width (4V/A by BET). | ||||||
| 1 | AC | 997 | 919 | 0.49 | 0.40 | 1.95 |
| 2 | 10PR-AC | 864 | 795 | 0.43 | 0.35 | 1.97 |
| 3 | 20PR-AC | 764 | 710 | 0.37 | 0.31 | 1.96 |
| 4 | 30PR-AC | 660 | 594 | 0.34 | 0.26 | 2.03 |
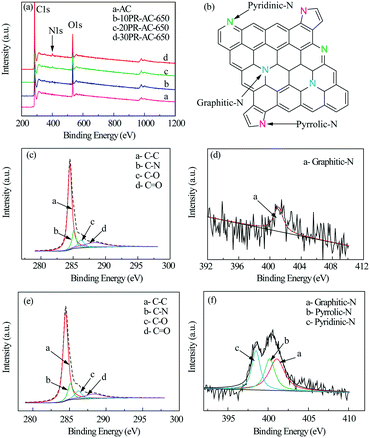
The high resolution XPS C1s spectra of AC and 30PR-AC-650 (Fig. 4c and e) can be deconvoluted into four individual peaks corresponding to C–C (284.5 eV), C–N (285.2 eV), C–O (286.3 eV) and C![[double bond, length as m-dash]](https://www.rsc.org/images/entities/char_e001.gif) O (288.3 eV), proving the successful doping of nitrogen into the carbon framework.18 This is consistent with the results shown in Fig. 4a. The high resolution N1s spectra of both AC and 30PR-AC-650 were collected to gain further insight into nitrogen doping (Fig. 4d and f). As shown in Fig. 4f, the deconvolution of the high resolution N1s spectrum of 30PR-AC-650 shows peaks corresponding to three chemical states attributed to pyridinic-N (398.5 eV), pyrrolic-N (400.2 eV) and graphitic-N (401.1 eV). At the elevated carbonization temperature, pyrrolic-N is thought to be partially converted into pyridinic- and graphitic-N. The high resolution N1s spectrum of AC (Fig. 4d) corresponds to only one N chemical state attributed to graphitic-N (401.1 eV). A schematic representation of the N@AC catalysts is shown in Fig. 4b. The composition for each nitrogen component is shown in Table 3. Nitrogen doping yields graphitic-N only for AC. For graphitic-N, pyridinic-N and pyrrolic-N, their respective content, observed on the N@AC catalysts, increases as a function of increasing nitrogen doping.
O (288.3 eV), proving the successful doping of nitrogen into the carbon framework.18 This is consistent with the results shown in Fig. 4a. The high resolution N1s spectra of both AC and 30PR-AC-650 were collected to gain further insight into nitrogen doping (Fig. 4d and f). As shown in Fig. 4f, the deconvolution of the high resolution N1s spectrum of 30PR-AC-650 shows peaks corresponding to three chemical states attributed to pyridinic-N (398.5 eV), pyrrolic-N (400.2 eV) and graphitic-N (401.1 eV). At the elevated carbonization temperature, pyrrolic-N is thought to be partially converted into pyridinic- and graphitic-N. The high resolution N1s spectrum of AC (Fig. 4d) corresponds to only one N chemical state attributed to graphitic-N (401.1 eV). A schematic representation of the N@AC catalysts is shown in Fig. 4b. The composition for each nitrogen component is shown in Table 3. Nitrogen doping yields graphitic-N only for AC. For graphitic-N, pyridinic-N and pyrrolic-N, their respective content, observed on the N@AC catalysts, increases as a function of increasing nitrogen doping.
| Sample | Composition (atom%) | ||||
|---|---|---|---|---|---|
| N | Graphitic-N | Pyrrolic-N | Pyridinic-N | ||
| 1 | AC | 0.42 | 0.42 | — | — |
| 2 | 10PR-AC | 1.20 | 0.55 | 0.26 | 0.39 |
| 3 | 20PR-AC | 1.86 | 0.75 | 0.57 | 0.54 |
| 4 | 30PR-AC | 2.32 | 1.00 | 0.66 | 0.66 |
2.3 N@AC active sites and the Jiang–Zhong VCM process mechanism
3. Conclusions
The Jiang–Zhong VCM process was further developed by studying a bifunctional N@AC nanocomposite catalyst based on the EDC dehydrochlorination and acetylene hydrochlorination reaction. The N@AC nanocomposite exhibited excellent activity and selectivity toward vinyl chloride. Both XPS analysis and the catalytic activity data revealed pyridinic-N as the active site. The characteristic attributes of the green, non-toxic, low-cost catalyst opens the future potential of the Jiang–Zhong VCM process—through the use of N@ACs—to substitute ethylene-based and acetylene-based VCMs. Furthermore, this finding will encourage further experimental and theoretical studies to elucidate the mechanism of EDC and acetylene activation via the carbon–pyridinic N bond. This process provides a new pathway for further optimization, that is, by increasing the amount of pyridinic-N sites to achieve higher conversions of EDC and acetylene. Additionally, the process also opens intriguing routes for N@AC catalysts to be applied in the chemical industry.4. Experimental
4.1 Materials
AC (neutral, coal-based carbon) was purchased from Ningxia Guanghua Activated Carbon Co., Ltd. The reagents including EDC (AR, general-reagent), pyrrole (AR, general-reagent) and ethanol (>99.7%, AR, general-reagent) were purchased from Taitan Technology Co., Ltd. The gases including acetylene (99.99%) and nitrogen (99.99%) were purchased from Shanghai Lvming Gas Co., Ltd.4.2 Catalyst preparation
The N@AC catalysts were prepared by an incipient wetness impregnation technique using AC as the carrier and pyrrole as the N precursor. Briefly, 50.0 g AC was added to 2.5 g pyrrole in 70.0 mL of an ethanol and water solution (volume ratio = 1![[thin space (1/6-em)]](https://www.rsc.org/images/entities/char_2009.gif) :
:![[thin space (1/6-em)]](https://www.rsc.org/images/entities/char_2009.gif) 1). After stirring for 12 h, the mixture was dried at 60 °C for 12 h. The dried mixture was then calcined at 650 °C for 4 h under a nitrogen atmosphere with a heating rate of 2.6 °C min−1.14,22 The pyrrole loading varied from 2.5 to 15.0 g at a constant AC content, and the obtained samples were labelled 5PR-AC-650, 10PR-AC-650, 20PR-AC-650 and 30PR-AC-650, respectively. Additionally, the carbonization temperature was varied from 250 to 850 °C at a constant pyrrole content, and the obtained samples were labelled 30PR-AC-250, 30PR-AC-450, 30PR-AC-650 and 30PR-AC-850, respectively.
1). After stirring for 12 h, the mixture was dried at 60 °C for 12 h. The dried mixture was then calcined at 650 °C for 4 h under a nitrogen atmosphere with a heating rate of 2.6 °C min−1.14,22 The pyrrole loading varied from 2.5 to 15.0 g at a constant AC content, and the obtained samples were labelled 5PR-AC-650, 10PR-AC-650, 20PR-AC-650 and 30PR-AC-650, respectively. Additionally, the carbonization temperature was varied from 250 to 850 °C at a constant pyrrole content, and the obtained samples were labelled 30PR-AC-250, 30PR-AC-450, 30PR-AC-650 and 30PR-AC-850, respectively.
4.3 Catalyst characterization
Brunauer–Emmett–Teller (BET) surface area data were collected by obtaining nitrogen adsorption isotherms at 77 K using a Micromeritics ASAP 2020 analyzer. XRD patterns at wide angles (10–90 over 2 h) were collected using a Bruker D8 Advanced X-ray diffractometer with Cu Kα radiation (k = 1.5406 Å) at 40 kV and 40 mA. TEM was performed using a JEM 2010 electron microscope at an accelerating voltage of 200 kV to examine the sample morphologies. XPS was performed using an Axis Ultra spectrometer with monochromatized Al Kα X-ray radiation as the excitation source (225 W). Raman microspectroscopy was performed using a Renishaw inVia unit having an Ar ion laser. Thermogravimetric analyses (TGA) of the samples were performed using a TA instrument under air atmosphere at a flow rate of 100 mL min−1. The temperature increased from 30 to 800 °C at a heating rate of 10 °C min−1.Catalytic performance was evaluated in a fixed-bed reactor (i.d. 17 mm). The temperature of the reactor was regulated using a temperature controller (Y-Feng, Shanghai, China). The EDC flow rate was regulated using a 2ZB-1L10 piston pump (Weixin, Beijing, China). Nitrogen was used to purge the reactor containing the catalyst (15.0 g) of water and air before starting the reaction. Thereafter, EDC and acetylene were fed into the heated reactor at a flow rate of 2.0 mL h−1 and 8.0 mL min−1, respectively (at a gas hourly space velocity of 32 h−1) at 260 °C. The gas and liquid products were analyzed by gas chromatography (Shimadzu GC-2014).
The conversion of acetylene was calculated as:
| XA(%) = [1 − (F2 × ∅a/F1)] × 100%. | (1) |
The conversion of EDC was calculated as:
| XEDC(%) = [(FEDC × t × ρ − m2)/(FEDC × t × ρ)] × 100%. | (2) |
The selectivity of VCM was calculated as:
 | (3) |
In eqn (1), F2 is defined as the flow rate of the reforming gas (mL min−1); F1 is the flow rate of acetylene (mL min−1); ∅a is the proportion of the remaining acetylene. In eqn (2), FEDC is defined as the flow rate of EDC (mL h−1); t is the reaction time (h); ρ is the density of EDC (g mL−1); m2 is residual EDC (g). In eqn (3), ∅VC is the proportion of vinyl chloride; M is the average molecular weight of EDC; “22.4” is the standard gas molar volume (L mol−1); “60” is the unit conversion (min h−1).
Conflicts of interest
There are no conflicts to declare.Acknowledgements
The work was supported by the National Natural Science Foundation of China (21372234) and the Key Research Program of the Chinese Academy of Sciences (ZDRW-CN-2016-1).References
- D. P. Krabbenhoft and E. M. Sunderland, Science, 2013, 341, 1457–1458 CrossRef CAS PubMed
.
- A. J. Poulain and T. Barkay, Science, 2013, 339, 1280–1281 CrossRef CAS PubMed
.
- J. M. Parks, A. Johs, M. Podar, R. Bridou, R. A. Hurt Jr, S. D. Smith, S. J. Tomanicek, Y. Qian, S. D. Brown, C. C. Brandt, A. V. Palumbo, J. C. Smith, J. D. Wall, D. A. Elias and L. Liang, Science, 2013, 339, 1332–1335 CrossRef CAS PubMed
.
- D. Normile, Science, 2013, 341, 1446–1447 CrossRef CAS PubMed
.
- J. Qiu, Nature, 2013, 493, 144–145 CrossRef CAS PubMed
.
- P. Johnston, N. Carthey and G. J. Hutchings, J. Am. Chem. Soc., 2015, 137, 14548–14557 CrossRef CAS PubMed
.
-
S. G. Patrick, Practical Guide to Polyvinyl Chloride, Rapra Technology Limited: Shtophere, 2005, p. 2 Search PubMed
.
- U. N. E. Programme, http://www.mercuryconvention.org/
.
- X. Gao, Y. P. Zhu and Z. H. Luo, Chem. Eng. Sci., 2011, 66, 6028–6038 CrossRef CAS
.
-
A. C. D. a. C. S. Bildea, Vinyl Chloride Monomer Process, Wiley-VCH Verlag GmbH & Co. KGaA, Weinheim, 2008 Search PubMed
.
- Z. H. Jiang, J. G. Zhong and X. Y. Wei, China Chlor-Alkali, 2014, pp. 24–26 Search PubMed.
-
B. Jiang and J. G. Zhong, CN101817723, 2010/US9056305, 2013
.
- W. Zhao, M. X. Sun, H. Y. Zhang, Y. Z. Dong, X. Y. Li, W. Li and J. L. Zhang, RSC Adv., 2015, 5, 104071–104078 RSC
.
- X. Li, Y. Wang, L. Kang, M. Zhu and B. Dai, J. Catal., 2014, 311, 288–294 CrossRef CAS
.
- H. S. Qian, F. M. Han, B. Zhang, Y. C. Guo, J. Yue and B. X. Peng, Carbon, 2004, 42, 761–766 CrossRef CAS
.
- L. Feng, Y. Chen and L. Chen, ACS Nano, 2011, 5, 9611–9618 CrossRef CAS PubMed
.
- J. Wu, D. Zhang, Y. Wang and B. Hou, J. Power Sources, 2013, 227, 185–190 CrossRef CAS
.
- X. Li, X. Pan, L. Yu, P. Ren, X. Wu, L. Sun, F. Jiao and X. Bao, Nat. Commun., 2014, 5, 3688–3688 CAS
.
- J. H. Bitter, S. van Dommele and K. P. de Jong, Catal. Today, 2010, 150, 61–66 CrossRef CAS
.
- S. van Dommele, K. P. de Jong and J. H. Bitter, Chem. Commun., 2006, 4859–4861 RSC
.
- X. Wang, B. Dai, Y. Wang and F. Yu, ChemCatChem, 2014, 6, 2339–2344 CrossRef CAS
.
- M. Sevilla, P. Valle-Vigon and A. B. Fuertes, Adv. Funct. Mater., 2011, 21, 2781–2787 CrossRef CAS
.
| This journal is © The Royal Society of Chemistry 2018 |

