 Open Access Article
Engineering of a near-infrared fluorescent probe for real-time simultaneous visualization of intracellular hypoxia and induced mitophagy†
Yongchao
Liu
,
Lili
Teng
,
Lanlan
Chen
,
Hongchang
Ma
,
Hong-Wen
Liu
 and
Xiao-Bing
Zhang
 *
*
Molecular Science and Biomedicine Laboratory, State Key Laboratory of Chemo/Biosensing and Chemometrics, College of Chemistry and Chemical Engineering, Collaborative Innovation Center for Chemistry and Molecular Medicine, Hunan University, Changsha, 410082, P. R. China. E-mail: xbzhang@hnu.edu.cn
First published on 15th May 2018
Abstract
Mitophagy induced by hypoxia plays an important role in regulating cellular homeostasis via the removal of dysfunctional mitochondria in the lysosomal degradation pathway, which results in physiological changes in the mitochondria, such as the pH, polarity and viscosity. However, the lack of an effective method for imaging of both the hypoxic microenvironment and the resulting variable mitochondria limits the visualization of hypoxia-induced mitophagy. Based on the specific mitochondrial pH changes during the hypoxia-induced mitophagy process, we have reported a near-infrared fluorescent probe (NIR-HMA) for real-time simultaneous visualization of the hypoxic microenvironment and the subsequent mitophagy process in live cells. NIR-HMA selectively accumulated in the hypoxic mitochondria in the NIR-MAO form, emitting at 710 nm, and then transformed into NIR-MAOH, emitting at 675 nm, in the acidified mitochondria-containing autolysosomes. Importantly, by smartly tethering the hypoxia-responsive group to the hydroxyl group of the NIR-fluorochrome, which shows ratiometric pH changes, NIR-HMA can differentiate between different levels of the hypoxic microenvironment and mitophagy. Furthermore, using NIR-HMA, we could track the complete mitophagy process from the mitochondria to the autolysosomes and visualize mitophagy caused only by hypoxia both in cancer cells and normal cells. Finally, NIR-HMA was applied to investigate the role that mitophagy plays in the hypoxic microenvironment via the cycling hypoxia-reoxygenation model. We observed a decreased fluorescence ratio after reoxygenation and a further increased mitophagy level after hypoxia was induced again, suggesting that mitophagy might be a self-protective process that allows cells to adapt to hypoxia. Our work may provide an attractive way for real-time visualization of relevant physiological processes in hypoxic microenvironments.
Introduction
Mitophagy is an important cellular process that not only provides nutrients for cells but also regulates cellular homeostasis in adverse microenvironments, such as under hypoxic conditions.1 Hypoxia is a key component of many physiological or pathophysiological conditions, including cardiovascular diseases, inflammation and tumors.2 It has been reported that prolonged periods of hypoxia may lead to increased cellular oxidative stress, resulting in mitochondrial damage and subsequent mitophagy.3 During mitophagy, mitochondria are sequestered into double-membrane autophagosome vesicles and then fused with lysosomes to form autolysosomes (pH 4.5–5.5), resulting in some physiological changes in the mitochondria, such as decreased pH, increased polarity and reduced viscosity.4 Mitophagy can result in the elimination of dysfunctional mitochondria and the recycling of their constituents, which plays an important role in maintaining mitochondrial quality and quantity in hypoxic microenvironments.5 Real-time visualization of the complete hypoxia-induced mitophagy process, beginning with hypoxia and leading to the degradation of mitochondria in live cells, may provide an effective way to understand mitochondrial metabolism and the relevant physiological roles in hypoxic microenvironments.Current methods for monitoring the occurrence of mitophagy induced by hypoxia in live cells are mainly based on electron microscopy6 or analysis of protein makers, such as p62 and LC3.7 These methods are difficult to apply to live cell imaging and visualization of the complete mitophagy process induced by hypoxic microenvironments. Fortunately, molecular fluorescent probes with excellent spatiotemporal sampling capabilities have aroused great attention for the visualization of relevant physiological processes in hypoxic microenvironments.8 Near-infrared (NIR) fluorescent probes, with advantages such as minimum interference of background fluorescence and minimum photodamage,9 have been shown to exhibit a significant improvement in the real-time imaging performance applied for the tracking of the mitophagy process.10 Ratiometric fluorescent probes, with two emission bands, which can provide built-in correction for quantitative analysis,11 may be used for differentiating different levels of mitophagy in hypoxic microenvironments. However, previously reported fluorescent probes have only been able to image either hypoxia or mitophagy.10,12 The use of a single NIR fluorescent probe for the real-time monitoring of hypoxia and the corresponding levels of the resulting mitophagy simultaneously, as well as the differentiation of the mitophagy level in live cells is still a challenge. It is so significant that it will help us to provide deep insight into the relationship between hypoxic microenvironments and the induced mitophagy process.
In this work, due to the distinctive pH changes in the mitochondria in hypoxic microenvironments, we have smartly engineered a NIR fluorescent probe with a dual recognition site, NIR-HMA, for the first ever real-time simultaneous visualization of intracellular hypoxia and the resulting induced mitophagy (Scheme 1). A NIR fluorophore was chosen as the fluorescence reporter due to its mitochondrial-targeting ability and ratiometric response to pH changes.9b NIR-HMA was designed by caging the hydroxyl group of the NIR fluorophore with the 4-nitrobenzene group, leading to quenched NIR fluorescence. In the cellular hypoxic microenvironment, the nitrobenzyl group was reduced to an amino group by nitroreductase and this was followed by a 1,6-rearrangement elimination reaction, which led to the release of NIR-MAO for monitoring the mitophagy process. NIR-HMA selectively accumulated in the hypoxic mitochondria in the NIR-MAO form, with emission at 710 nm, and then transformed into NIR-MAOH, with emission at 675 nm, in the acidified mitochondria-containing autolysosomes. A ratiometric detection strategy was used to evaluate the different levels of hypoxia and the induced mitophagy process in live cells. Importantly, NIR-HMA can track the complete mitophagy process from the mitochondria to the autolysosomes. Using NIR-HMA, we confirmed that mitophagy is a universal phenomenon not only in cancer cells but also in normal cells. In addition, NIR-HMA could differentiate mitophagy that is only induced by hypoxia from other types of mitophagy in live cells. We further applied NIR-HMA to investigate the role mitophagy plays in hypoxic microenvironments via the cycling hypoxia-reoxygenation model, which suggests that mitophagy may be a self-protective process that allows cells to adapt to hypoxia.
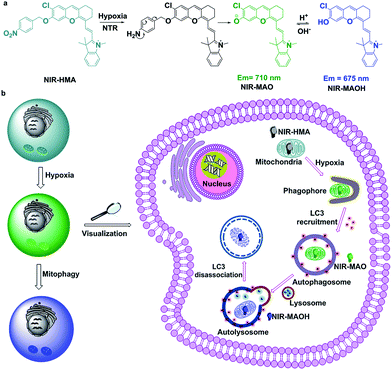 | ||
| Scheme 1 (a) The structural changes of NIR-HMA and (b) a schematic diagram of NIR-HMA for the visualization of hypoxia-induced mitophagy. | ||
Results and discussion
Mitophagy is the process by which damaged mitochondria eventually fuse with lysosomes to form acidic autolysosomes (pH 4.5–5.5), which results in a decrease in the mitochondrial pH,4 thus ultrasensitive pH fluorescent probes with mitochondria-targeting capabilities will be feasible for the visualization of mitophagy. Generally, hypoxia is accompanied by increased levels of intracellular reductive enzymes, such as nitroreductase (NTR), which is a key indicator of hypoxic microenvironments.12 Mitophagy is also closely related to the degree of hypoxia, so an ideal fluorescent probe for the visualization of hypoxia and the resulting induced mitophagy should be able to simultaneously respond to pH changes in the mitochondria and the degree of cellular hypoxia. As reported, nitroaromatic compounds can be used as a substrate for NTR in the presence of reduced NADH in hypoxic microenvironments.13 Near-infrared 2,3-dihydro-1H-xanthene-6-ol fluorochromes based on the intramolecular charge transfer (ICT) mechanism are pH sensitive owing to the protonation/deprotonation of the hydroxyl groups in their molecular skeleton.9b Taking together all of these factors, NIR-HMA was produced with 4-nitrobenzene, which is a recognition moiety for nitroreductase (NTR), smartly tethered to the hydroxyl group of the NIR fluorochrome, which has mitochondria-targeting capabilities and can help to visualize mitochondrial pH changes via ratiometric fluorescence (Scheme 1a). Consequently, NIR-HMA is non-fluorescent, with 4-nitrobenzene acting as a quenching and hypoxia-responsive moiety, while the reaction with NTR will result in the reduction of the nitro moiety, followed by the 1,6-rearrangement elimination reaction, and thus the rapid release of the “caged” fluorochrome. Simultaneously, the released fluorochrome (NIR-MAO) leads to ratiometric fluorescence for pH visualization with emission at 710 nm under neutral conditions (NIR-MAO form) and 675 nm under acidic conditions (NIR-MAOH form).NIR-HMA was synthesized according to Scheme S1.† The starting materials, 4-chlororesorcinol and 4-nitrobenzyl bromide, are commercially available and compound IR-780 was prepared according to a previously reported procedure.9b NIR-MAOH was synthesized via a retro-Knoevenagel reaction by reacting IR-780 with 4-chlororesorcinol in the presence of triethylamine in DMF at 60 °C for 5 h. The synthetic methodology for the probe NIR-HMA is outlined in Scheme S1,† and its structure was confirmed using 1H NMR, 13C NMR and MS (ESI†).
The absorption spectrum of NIR-HMA shows an obvious red shift from 600 to 680 nm in the presence of NTR (Fig. S1a†). NIR-HMA, without the addition of NTR, showed almost no fluorescence and this was attributed to the hydroxyl protection and the quenching effect of the nitrobenzene moiety. With the addition of NTR, fluorescence emission at 710 nm was observed, as shown in Fig. 1a, due to the enzyme-triggered cleavage reaction and the release of free NIR-MAO. The fluorescence signal at 710 nm increased with the increasing concentration of NTR and showed a linear relationship with the concentration of NTR in the range 0.5 to 3.5 μg mL−1 (Fig. S1b and c†). At an NTR concentration of 10 μg mL−1, the fluorescence signal at 710 nm increased by about 15 times when compared with that observed when no NTR was added. The fluorescence kinetic curves for NIR-HMA with different concentrations of NTR are shown in Fig. 1b; a higher concentration of NTR could induce a faster cleavage reaction and an increased fluorescence signal. In the presence of NTR, the fluorescence signal reached a plateau in about 800 s. These results indicate that NIR-HMA can be efficiently activated by NTR to produce a turn-on NIR fluorescence signal for NTR monitoring, as well as to monitor the different degrees of hypoxia in live cells.
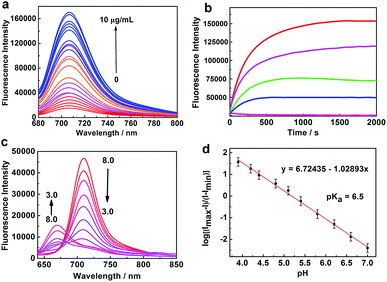 | ||
| Fig. 1 Spectral profiles of NIR-HMA and NIR-MAOH. (a) The fluorescence emission spectra of NIR-HMA (5 μM) with different concentrations of NTR in the presence of 500 μM NADH at 37 °C in buffer solution. λex = 670 nm. (b) A plot of the fluorescence intensity of NIR-HMA (5 μM) vs. reaction time with different NTR concentrations, from bottom to top: 0, 1.0, 2.5, 5.0 and 10 μg mL−1. λex/em = 670/710 nm. (c) The fluorescence emission spectra of NIR-MAOH (5 μM) in buffer solution with different pH values from pH 3.0 to pH 8.0. λex = 570 nm. (d) The linear relationship between log[(Imax − I)/(I − Imin)] and pH (4.0–7.0). The pKa value was calculated using the Henderson–Hasselbalch equation: log[(Imax − I)/(I − Imin)] = pH − pKa.14 | ||
Subsequently, we investigated the fluorescence response of NIR-MAOH to different pH values. When the pH was changed from basic (pH 8.0) to acidic (pH 3.0), the absorption band of NIR-MAOH shifted from 690 to 600 nm (Fig. S1d†), and an emission peak appeared at 675 nm, which increased significantly, while the emission peak at 710 nm decreased drastically (Fig. 1c). The ratiometric changes in the pH could be attributed to intramolecular charge transfer (ICT) resulting from the protonation/deprotonation of the hydroxyl group in the molecular skeleton. Moreover, NIR-MAOH showed an excellent linear response to pH, with values ranging from 4.0 to 7.0 (Fig. 1d, S1g†) and a pKa value of 6.5, which corresponds to the pH range of the mitophagy process. We also investigated the photostability of NIR-MAOH at 675 nm and 710 nm (Fig. S1e and f†). NIR-MAOH showed good reversibility between pH 4.0 and pH 7.4 (Fig. S1h and i†), which was attributed to the reversible protonation/deprotonation of the hydroxyl group. It was clear that the fluorescence signals collected at 675 nm and 710 nm were comparatively stable, proving that NIR-MAOH is photostable under physiological conditions. These results indicate that NIR-MAOH might be suitable for the accurate monitoring of physiological pH variations during the mitophagy process.
The selectivity of NIR-HMA for NTR and the effect of the interference of other potential species on NIR-MAOH were evaluated. As shown in Fig. S2a,† in the presence of interfering species with excess concentrations, no obvious change in the fluorescence intensity was observed, while NIR-HMA incubated with NTR showed a remarkable increase in the fluorescence emission. These results demonstrate that the probe is highly selective for NTR over other related species. Meanwhile, these relevant species also showed negligible interference for the fluorescence of NIR-MAOH at pH 4.5 (Fig. S2b†). The cytotoxicities of NIR-HMA and NIR-MAOH towards HeLa cells were evaluated using the standard CCK-8 assay. As displayed in Fig. S3,† NIR-HMA and NIR-MAOH showed low cytotoxicity and good biocompatibility. The kinetic response of NIR-HMA to NTR in live cells was also investigated using a real-time imaging experiment (Fig. S4†). The results show that the fluorescence signal could reach a plateau in about 20 min (Fig. S4b†), demonstrating that NIR-HMA can respond to hypoxia rapidly in live cells.
Firstly, we cultured HeLa cells in normoxic (20% O2) and hypoxic microenvironments (0.1% O2) over different time ranges and then treated them with NIR-HMA. As shown in Fig. S5,† in the normoxic microenvironment, weak fluorescence signals were observed. However, with increasing culture time in the hypoxic microenvironment, the fluorescence signals increased as NIR-HMA responded to different levels of hypoxia. Furthermore, the localization of NIR-HMA in the cells was tested by co-staining of the live cells with NIR-HMA and LysoTracker Green, MitoTracker Green, and ERTracker Red. As shown in Fig. S6,† the fluorescence image of NIR-HMA in the green and red channel (Fig. S6a–d†) showed a poor Pearson’s correlation coefficient (0.58). The confocal images showed that the fluorescence of NIR-HMA overlaps well with the commercially available mitochondrial tracking dye (MitoTracker Green) with a high Pearson’s correlation coefficient (0.95), indicating that NIR-HMA selectively accumulated in the mitochondria initially (Fig. S6i–l†). For comparison, NIR-HMA co-stained with LysoTracker Green (Fig. S6e–h†) and ERTracker Red (Fig. S6m–p†) showed poor co-localization with a low Pearson’s correlation coefficient of 0.38 and 0.66, respectively. In order to further confirm the anchoring ability of NIR-HMA, we conducted real-time co-localization experiments with MitoTracker Green to check whether the probe was bound to the mitochondria before and during the mitophagy process. MitoTracker Green, a mitochondria-targeting dye, has a benzyl chloride group in its molecular skeleton which can covalently bind to mitochondrial proteins and anchor in the mitochondria for a long time.10b As shown in Fig. S7,† both NIR-MAOH under normoxia and NIR-HMA under hypoxia showed a high Pearson’s correlation coefficient (>0.83) with MitoTracker Green from 3 h to 15 h. These co-localization results prove that NIR-HMA anchored predominantly in the organelles containing mitochondria rather than in the lysosomes or other organelles. Moreover, NIR-HMA showed a satisfactory mitochondria-anchoring ability and limited leakage from the organelles containing mitochondria, which was attributed to its lipophilic quaternary ammonium salt skeleton, meaning that it will tend to remain in the more lipophilic autophagic mitochondria. All of these results demonstrate that the NIR-HMA probe could be used for effective tracking of the mitophagy process.
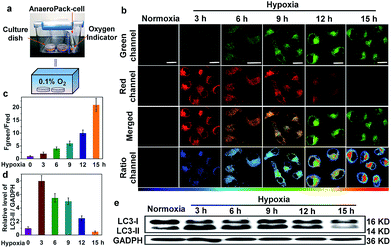
To prove that NIR-HMA could achieve real-time simultaneous visualization of the hypoxic microenvironment and the resulting induced mitophagy in live cells, we constructed a hypoxia model, in which a severe hypoxic microenvironment (∼0.1% O2) was generated using an AnaeroPack in a clear container (Fig. 2a), and we then cultured HeLa cells in a container with NIR-HMA at different times to induce mitophagy. With the prolongation of hypoxia, the fluorescence emission intensity in the green channel (625–680 nm) increased gradually while the fluorescence in the red channel (705–760 nm) decreased (Fig. 2b). The ratio images were obtained from the green and red channels, and the ratio (Fgreen channel/Fred channel) excludes the influence of photobleaching of the probes for long-time imaging and can be used for the quantification of the mitophagy level (Fig. 2c).11 Remarkable pseudocolor changes indicated the different mitophagy levels, and the level of mitophagy increased with the prolongation time in the hypoxic microenvironment from 3 to 15 h (Fig. 2b and c). Combined with the real-time co-localization experiments using MitoTracker Green, the fluorescence change from red to green was mainly induced by mitophagy. In order to further demonstrate the occurrence of mitophagy and the successful construction of a hypoxia model, we explored the hypoxia-induced mitophagy process in HeLa cells using the western blotting experiment. As reported, when mitophagy is activated, the LC3-I (16 kD) protein localized in the cytoplasm is cleaved, lipidated and inserted as LC3-II (14 kD) into autophagosome membranes.15 Thus, an increase in the LC3-II level is a characteristic of mitophagy and is associated with an increased number of autophagosomes.6 In the HeLa cells, the level of LC3-II was significantly enhanced in the first 3 h of hypoxia in 0.1% O2, suggesting the occurrence of the mitophagy process and the successful construction of a hypoxia-induced mitophagy model. Also, a decreasing level of LC3-II was observed from 3 h to 15 h of hypoxia which may be ascribed to the formation of autolysosomes and the degradation of LC3 for long-term mitophagy (Fig. 2d and e). These results demonstrate that NIR-HMA could be used for real-time visualization and differentiation of different degrees of hypoxic microenvironments as well as the corresponding levels of induced mitophagy in live cells.
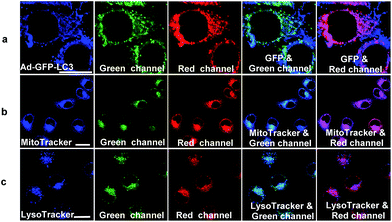
In hypoxic microenvironments, damaged mitochondria are sequestered into autophagosomes, which are then delivered and fuse with lysosomes to form autolysosomes.4 We applied NIR-HMA to track the complete process of mitophagy induced by hypoxic microenvironments from mitochondrion to autolysosome in live cells. First, to explore whether NIR-HMA can track mitophagosomes, which is a neutral organelle that contains mitochondria but is not fused with a lysosome,4 a transfect test was conducted by incubating with Ad-GFP-LC3, an adenovirus expressing GFP-LC3 fusion protein, which is a mitophagosomal marker. As shown in Fig. 3a, almost all of the patches of the GFP fluorescence merged with the fluorescence regions of NIR-HMA in the red channel, demonstrating that NIR-HMA can also track mitophagosomes. However, only slight GFP-LC3 fluorescence merged with the fluorescence of NIR-HMA in the green channel, which might be ascribed to the degradation of GFP-LC3 in the acidic autolysosome. The fluorescence regions of NIR-HMA in the green channel (NIR-MAOH form) were observed not only within the regions that were stained with MitoTracker Green (Fig. 3b), but they also overlapped well with the LysoTracker Green stained regions (Fig. 3c), which suggests that NIR-HMA can track mitochondria-containing autolysosomes derived from mitophagy because the regions of mitochondria-containing autolysosomes may be stained by MitoTracker Green and LysoTracker Green simultaneously. In addition, HCQ, a lysosomotropic agent, can neutralize the acidic environment in lysosomes and block the fusion of the autophagosomes and lysosomes.16 As shown in Fig. S8,† in the green channel, the fluorescence of NIR-HMA in HCQ-treated cells was much weaker than that in nontreated cells, while in the red channel, the fluorescence of NIR-HMA in HCQ-treated cells was brighter than that in non-treated cells, demonstrating that NIR-HMA can track autolysosomes, whose formation is disrupted by HCQ. A real-time localization experiment of NIR-HMA and LysoTracker Green was also carried out (Fig. S9†). The results show that the overlapped regions of NIR-HMA and LysoTracker Green increased with the prolonged times of hypoxia, proving that NIR-HMA could be used for real-time tracking of the formation of mitochondria-containing autolysosomes.
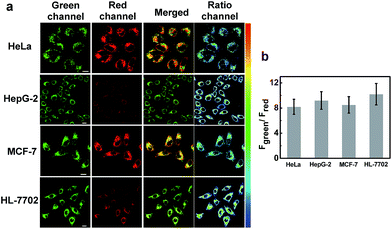
Subsequently, we applied NIR-HMA for the visualization of hypoxia-induced mitophagy in different cell lines, including normal cells and cancer cells. As shown in Fig. 4, intracellular fluorescence was detected in live cells of each line, confirming that mitophagy is a common physiological process that allows cells to adapt to hypoxic microenvironments whether they are normal cells or cancer cells. The fluorescence signal ratio (Fgreen channel/Fred channel) varied from cell line to cell line, reflecting the fact that different mitophagy levels occurred in different cells. To investigate the specificity of NIR-HMA for imaging mitophagy caused by hypoxia, we carried out a validation test in HeLa cells by adding rapamycin and EBSS to induce mitophagy. Rapamycin, an inhibitor of the mammalian target of rapamycin (mTOR),17 induces mitophagy in malignant glioma cells. EBSS, a kind of balanced salt solution, creates a nutrient deficient environment to induce mitophagy.18 As shown in Fig. S10,† cells incubated with the contrast probe NIR-MAOH displayed strong fluorescence not only in hypoxic microenvironments but also in EBSS and rapamycin media. The fluorescence signal of cells incubated with NIR-HMA was observed only in the hypoxic microenvironment, indicating that NIR-HMA can only track mitophagy that is induced by hypoxia rather than other types of mitophagy.
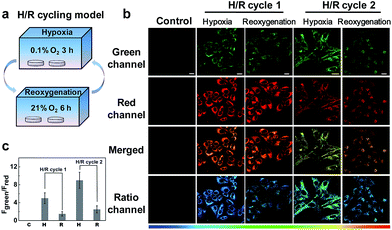
Next, we applied NIR-HMA to investigate the role that mitophagy plays in the hypoxic microenvironment by conducting a cycling hypoxia-reoxygenation (H/R) experiment (Fig. 5a). Fig. 5b shows the fluorescence images of HeLa cells incubated with NIR-HMA during H/R cycles. Quantitative analysis showed that the fluorescence ratio value of the reoxygenated cells was much lower than that in hypoxic cells, indicating that there is no increase in the mitophagy level after reoxygenation both in H/R cycle 1 and 2. In H/R cycle 2, the cells showed a higher fluorescence ratio value when compared with H/R cycle 1, both in hypoxic cells and reoxygenated cells (Fig. 5b and c). The real-time experiments also showed the gradual change in the fluorescence ratio value with the prolongation of the reoxygenation time (Fig. S11a and b†), and a mitophagy level close to the initial state was observed under reoxygenation for a long time using western blotting analysis (Fig. S11c and d†). Since cycling hypoxia may cause an increased level of mitophagy and the mitophagy levels are no longer increased during reoxygenation, this may suggest that the nutrients provided by mitophagy are no longer necessary. These findings lead us to believe that mitophagy in hypoxic microenvironments is more of a cell protection function that allows cells to adapt to the adverse conditions.
Conclusions
In summary, we have smartly engineered a NIR fluorescent probe, NIR-HMA, with dual recognition sites for real-time simultaneous visualization of different degrees of hypoxic microenvironments and differentiation of the corresponding mitophagy level in live cells. In the hypoxic microenvironment, the overexpressed NTR catalyzed the conversion of NIR-HMA to NIR-MAO, resulting in remarkable fluorescence enhancement, emitting at 710 nm, and high sensitivity to different degrees of hypoxia. During hypoxia-induced mitophagy, the acidified mitochondria caused the protonation of the hydroxyl group of NIR-MAO, forcing the emission wavelength to shift from 710 nm (NIR-MAO) to 675 nm (NIR-MAOH). Subsequently, we successfully applied NIR-HMA for real-time tracking of the complete mitophagy process in live cells. The remarkable changes in the ratiometric fluorescence reflected the different degrees of hypoxia and the subsequent induced mitophagy. Moreover, NIR-HMA is a special probe for imaging mitophagy induced by hypoxia only, and can visualize mitophagy induced by hypoxia in both cancer cells and normal cells. Based on the cycling hypoxia-reoxygenation model, we observed that mitophagy might be a self-protective process that allows cells to adapt to hypoxic microenvironments. Our designed probe may provide an effective tool for further exploration of relevant physiological processes in hypoxic microenvironments.Conflicts of interest
There are no conflicts to declare.Acknowledgements
This work was supported by the National Natural Science Foundation of China (Grants 21521063, 21325520, 21327009, J1210040) and the science and technology project of Hunan Province (2016RS2009, 2016WK2002).Notes and references
- (a) Y. Kondo, T. Kanzawa, R. Sawaya and S. Kondo, Nat. Rev. Cancer, 2005, 5, 726–734 CrossRef PubMed; (b) E. E. Mowers, M. N. Sharifi and K. F. Macleod, Oncogene, 2016, 36, 1619–1630 CrossRef PubMed.
- (a) A. L. Harris, Nat. Rev. Cancer, 2002, 2, 38–45 CrossRef PubMed; (b) N. M. Mazure and J. Pouysségur, Curr. Opin. Cell Biol., 2010, 22, 177–180 CrossRef PubMed; (c) C. Yee, W. Yang and S. Hekimi, Cell, 2014, 157, 897–909 CrossRef PubMed.
- D. M. Gilkes, G. L. Semenza and D. Wirtz, Nat. Rev. Cancer, 2014, 14, 430–439 CrossRef PubMed.
- (a) C. W. Wang and D. J. Klionsky, Mol. Med., 2003, 9, 65–76 Search PubMed; (b) M. B. Azad, Y. Chen, E. S. Henson, J. Cizeau, E. Mcmillan-Ward, S. J. Israels and S. B. Gibson, Autophagy, 2008, 4, 195–204 CrossRef PubMed.
- (a) L. Liu, D. Feng, G. Chen, M. Chen, Q. Zheng, P. Song, Q. Ma, C. Zhu, R. Wang, W. Qi, L. Huang, P. Xue, B. Li, X. Wang, H. Jin, J. Wang, F. Yang, P. Liu, Y. Zhu, S. Sui and Q. Chen, Nat. Cell Biol., 2012, 14, 177–185 CrossRef PubMed; (b) R. J. Youle and D. P. Narendra, Nat. Rev. Mol. Cell Biol., 2011, 12, 9–14 CrossRef PubMed.
- (a) N. Sun, D. Malide, L. Jie, I. I. Rovira, C. A. Combs and T. Finkel, Nat. Protoc., 2017, 12, 1576–1586 CrossRef PubMed; (b) N. Mizushima, T. Yoshimori and B. Levine, Cell, 2010, 140, 313–326 CrossRef PubMed.
- J. P. Pursiheimo, K. Rantanen, P. T. Heikkinen, T. Johansen and P. M. Jaakkola, Oncogene, 2009, 28, 334–344 CrossRef PubMed.
- (a) X. Li, X. Gao, W. Shi and H. Ma, Chem. Rev., 2014, 114, 590–659 CrossRef PubMed; (b) J. Zielonka, J. Joseph, A. Sikora, M. Hardy, O. Ouari, J. Vasquez-Vivar, G. Cheng, M. Lopez and B. Kalyanaraman, Chem. Rev., 2017, 117, 10043–10120 CrossRef PubMed; (c) W. Sun, S. Guo, C. Hu, J. Fan and X. Peng, Chem. Rev., 2016, 116, 7768–7817 CrossRef PubMed.
- (a) Q. Miao, D. C. Yeo, C. Wiraja, J. Zhang, X. Ning, C. Xu and K. Pu, Angew. Chem., Int. Ed., 2018, 57, 1256–1260 CrossRef PubMed; (b) Y. Li, Y. Wang, S. Yang, Y. Zhao, L. Yuan, J. Zheng and R. Yang, Anal. Chem., 2015, 87, 2495–2503 CrossRef PubMed; (c) X. He, L. Li, Y. Fang, W. Shi, X. Li and H. Ma, Chem. Sci., 2017, 8, 3479–3783 RSC; (d) D. Wu, A. C. Sedgwick, T. Gunnlaugsson, E. U. Akkaya, J. Yoon and T. D. James, Chem. Soc. Rev., 2017, 46, 7105–7123 RSC; (e) X. Wu, A. Shao, S. Zhu, Z. Guo and W. Zhu, Sci. China: Chem., 2016, 59, 62–69 CrossRef.
- (a) Y. Liu, J. Zhou, L. Wang, X. Hu, X. Liu, M. Liu, Z. Cao, D. Shangguan and W. Tan, J. Am. Chem. Soc., 2016, 138, 12368–12374 CrossRef PubMed; (b) M. H. Lee, N. Park, C. Yi, J. H. Han, J. H. Hong, K. P. Kim, D. H. Kang, J. L. Sessler, C. Kang and J. S. Kim, J. Am. Chem. Soc., 2014, 136, 14136–14142 CrossRef PubMed.
- (a) M. H. Lee, J. S. Kim and J. L. Sessler, Chem. Soc. Rev., 2015, 44, 4185–4191 RSC; (b) A. R. Sarkar, C. H. Heo, L. Xu, H. W. Lee, H. Y. Si, J. W. Byun and H. M. Kim, Chem. Sci., 2016, 7, 766–773 RSC; (c) Y. Chen, W. Zhang, Y. Cai, R. T. K. Kwok, Y. Hu, J. W. Y. Lam, X. Gu, Z. He, Z. Zhao, X. Zheng, B. Chen, C. Guia and B. Z. Tang, Chem. Sci., 2017, 8, 2047–2055 RSC; (d) H. Xiao, C. Wu, P. Li, W. Gao, W. Zhang, W. Zhang, L. Tong and B. Tang, Chem. Sci., 2017, 8, 7025–7030 RSC; (e) Z. Liu, X. Zhou, Y. Miao, Y. Hu, N. Kwon, X. Wu and J. Yoon, Angew. Chem., Int. Ed., 2017, 56, 5812–5816 CrossRef PubMed.
- (a) Y. Li, Y. Sun, J. Li, Q. Su, W. Yuan, Y. Dai, C. Han, Q. Wang, W. Feng and F. Li, J. Am. Chem. Soc., 2015, 137, 6407–6416 CrossRef PubMed; (b) K. Okuda, Y. Okabe, T. Kadonosono, T. Ueno, B. G. Youssif, S. Kizaka-Kondoh and H. Nagasawa, Bioconjugate Chem., 2012, 23, 324–329 CrossRef PubMed; (c) J.-n. Liu, W. Bu and J. Shi, Chem. Rev., 2017, 117, 6160–6224 CrossRef PubMed.
- (a) Z. Li, X. Li, X. Gao, Y. Zhang, W. Shi and H. Ma, Anal. Chem., 2013, 85, 3926–3932 CrossRef PubMed; (b) J. Zhang, H.-W. Liu, X. X. Hu, J. Li, L. H. Liang, X. B. Zhang and W. Tan, Anal. Chem., 2015, 87, 11832–11839 CrossRef PubMed.
- M. I. Burguete, F. Galindo, M. A. Izquierdo, J. E. O’Connor, G. Herrera, S. V. Luis and L. Vigara, Eur. J. Org. Chem., 2010, 2010, 5967–5979 CrossRef.
- (a) J. A. Forsythe, B. H. Jiang, N. V. Iyer, F. Agani, S. W. Leung, R. D. Koos and G. L. Semenza, Mol. Cell. Biol., 1996, 16, 4604–4613 CrossRef PubMed; (b) L. Wang, X. Hu, W. Zhu, Z. Jiang, Y. Zhou, P. Chen and J. Wang, Sci. China: Life Sci., 2014, 57, 171–180 CrossRef PubMed; (c) T. Kanki, K. Furukawa and S. I. Yamashita, Biochim. Biophys. Acta, Mol. Cell Res., 2015, 1853, 2756–2765 CrossRef PubMed.
- P. Maycotte, S. Aryal, C. T. Cummings, J. Thorburn, M. J. Morgan and A. Thorburn, Autophagy, 2012, 8, 200–212 CrossRef PubMed.
- A. Sekiguchi, H. Kanno, H. Ozawa, S. Yamaya and E. Itoi, J. Neurotrauma, 2012, 29, 946–956 CrossRef PubMed.
- M. Mauthe, A. Jacob, S. Freiberger, K. Hentschel, Y. D. Stierhof, P. Codogno and T. Proikas-Cezanne, Autophagy, 2011, 7, 1448–1461 CrossRef PubMed.
Footnote |
| † Electronic supplementary information (ESI) available. See DOI: 10.1039/c8sc01684d |
| This journal is © The Royal Society of Chemistry 2018 |

