 Open Access Article
Visualization of methylglyoxal in living cells and diabetic mice model with a 1,8-naphthalimide-based two-photon fluorescent probe†
Mingwang
Yang
,
Jiangli
Fan
 *,
Junwei
Zhang
,
Jianjun
Du
 and
Xiaojun
Peng

State Key Laboratory of Fine Chemicals, Dalian University of Technology, No. 2 Linggong Road, Dalian 116024, P. R. China. E-mail: fanjl@dlut.edu.cn
First published on 16th July 2018
Abstract
Methylglyoxal (MGO), a dicarbonyl metabolite, is the most studied precursor of advanced glycation end-products (AGEs) and its elevated levels have also been associated with various pathologies. Hence, the development of effective methods for monitoring MGO in live cells and in vivo is of great importance for ascertaining the onset and progress of related diseases. Herein, we designed and synthesized an endoplasmic reticulum-targeting two-photon fluorescent probe called NI-OPD for the detection of MGO with high selectivity, sensitivity, and hypotoxicity. The probe was successfully applied for monitoring MGO in living cells and a diabetic mice model. The two-photon fluorescence images confirmed that the endogenous MGO in the liver and kidney tissues of diabetic mice is higher than that of normal mice. Furthermore, it revealed that after treatment with metformin, a widely used hypoglycemia drug, the diabetic mice showed a decreased concentration of MGO in liver and kidney tissues. Thus, NI-OPD may serve as a useful tool for the detection of MGO and for studying the relationships between MGO and pathological and biological processes in biosystems.
Introduction
Methylglyoxal (MGO), a reactive dicarbonyl, is primarily produced by glycolysis in living cells. It is thought to contribute to diabetic complications, either as a direct toxin or as a precursor for advanced glycation end-products (AGEs).1,2 Accumulation of misfolded and unfolded proteins and abnormal calcium metabolism in the lumen of the endoplasmic reticulum (ER) lead to ER stress.3 Numerous studies have shown that ER stress is associated with diseases such as diabetes mellitus, obesity, Alzheimer's disease (AD) and Parkinson's disease (PA).4–9 Furthermore, there is increasing evidence that MGO is inextricably linked to ER stress10–12 and that increased MGO levels are associated with diabetes and related complications.13–15 However, although MGO is clearly involved in numerous diseases, its roles in intracellular and pathological processes remain unclear. Hence, detecting the MGO in ER and diabetes models is of great importance for the study of its pathological processes.Owing to its reactive dicarbonyl group, most approaches for HPLC and LC-MS detection of MGO involve its derivatisation with o-phenylenediamine (OPD) to form stable adducts.16–19 However, these methods require cell lysis and extensive complicated processes that negatively impact living systems, restricting their further application. Therefore, the development of convenient and efficient MGO detection methods are urgently required if we are to elucidate the exact physiological functions of MGO.
Fluorescence-based detecting techniques have emerged as a powerful tool for monitoring various bioactive analytes in living systems due to their simplicity, sensitivity and biocompatibility.20–25 Specifically, two-photon fluorescence microscopy imaging is a fascinating strategy that exhibits a great many advantages including deeper tissue penetration, higher signal-to-noise ratios and longer available observation time.26–28 Accordingly, a range of two-photon fluorescent probes for targeting various biomolecules and organelles have been designed and developed.28o-Phenylenediamine reacts quickly with MGO to form a 2-methylquinoxaline derivative. In 2013, Spiegel et al. exploited this reactivity to develop the first “turn-on” fluorescence sensor for MGO.29 To the best of our knowledge, only one further work on fluorescence MGO detection has been reported since.30 However, neither of the fluorescence probes developed in these two studies exhibits organelle localisation capability and they are either too susceptible to analytes or require reaction times that are too long to be applied in tissue imaging or real-time detection of changes in MGO levels.
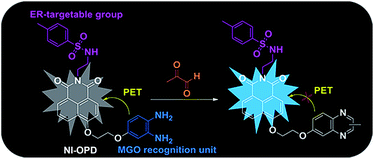
Accordingly, we have designed and synthesized a novel ER-targeting two-photon fluorescent probe termed NI-OPD, which comprises 1,8-naphthalimide (an ideal two-photon fluorophore), o-phenylenediamine (the MGO recognition unit), and methyl sulphonamide (the ER-targeting group).31–33 The intrinsic fluorescence of the 1,8-naphthalimide moiety in the NI-OPD probe is quenched by the o-phenylenediamine unit through the photo-induced electron transfer (PET) effect. However, when the o-phenylenediamine moiety of the probe interacts with MGO, the PET effect is inhibited and the probe therefore emits an intense fluorescence (Scheme 1). As a result, NI-OPD exhibits excellent selectivity and sensitivity, prominent ER-targeting ability, and low cytotoxicity. By utilizing confocal fluorescence imaging, we have visualized the MGO produced in the ER of cells under different stimuli. More importantly, NI-OPD is successfully applied to normal, diabetic and metformin-treated diabetic mice to study the difference in their endogenous MGO concentrations. To the best of our knowledge, NI-OPD is the first ER-targeting two-photon fluorescent probe capable of tracing the change in the MGO contents of the tissues in a diabetic mice model.
Results and discussion
Synthesis of NI-OPD
The synthetic route to NI-OPD is illustrated in Scheme S1.† All the synthesis conditions and yields were moderate. The structure of NI-OPD and the synthetic intermediates were characterised using 1H NMR, 13C NMR, and HR-MS.The spectroscopic properties of NI-OPD
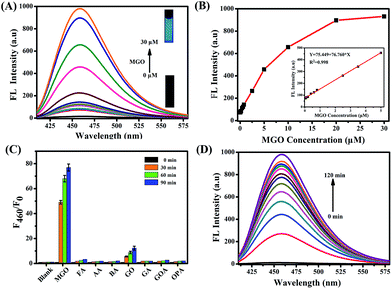
The optical properties of NI-OPD (10 μM) were evaluated in 10 mM PBS (pH = 7.4, containing 10% DMF as a co-solvent). As shown in Fig. S1,†NI-OPD presents an absorption maximum peak at 380 nm and the absorption intensity remains unchanged upon the addition of MGO. Under normal conditions, the probe shows almost no fluorescence owing to PET between o-phenylenediamine and 1,8-naphthalimide. However, in the presence of 30 μM MGO, an approximately 75-fold fluorescence enhancement at 460 nm is observed (Fig. 1A) with the fluorescence quantum yield increased from 0.008 to 0.244 owing to MGO-induced formation of the 2-methylquinoxaline product NI-MQL. NI-MQL was also independently synthesised and characterized by 1H NMR, 13C NMR and HR-MS and its analytical data compared with those of NI-OPD. The amino peak of NI-OPD is absent from the 1H NMR spectrum of NI-OPD, while a methyl peak appears in the spectrum of NI-MQL. In terms of HR-MS, upon reaction with MGO, a peak at m/z = 597.1803, corresponding to compound NI-MQL, is predominant (Scheme S2†).The fluorescence intensity at 460 nm increases linearly with the concentration of MGO in the range of 0–5 μM (R2 = 0.998) with a detection limit of 56 nM (Fig. 1B). Upon addition of 30 μM MGO, the fluorescence intensity of NI-OPD increases dramatically over 10 min and reaches a plateau after approximately 2 h (Fig. 1D and S2†). Additionally, the fluorescence response of NI-OPD to MGO is independent of pH in the range 3.0–11.0 (Fig. S3†), demonstrating its suitability for imaging under physiological conditions. The two-photon absorption cross-section (δ) values for NI-OPD in the presence and absence of MGO were obtained. As expected, the probe itself exhibits a low δ value while the product of the probe and MGO exhibits the maximal δ value at 780 nm (Fig. S4†). These significant two-photon properties demonstrate the suitability of NI-OPD for two-photon microscopy imaging of living specimens.
Outstanding selectivity is a necessary criterion for an excellent fluorescent probe. Accordingly, the fluorescence responses of NI-OPD to MGO and different analytes were evaluated. As expected, other common aldehydes, including formaldehyde (FA), acetaldehyde (AA), benzaldehyde (BA), glutaraldehyde (GA), glyoxylic acid (GOA) and o-phenylenediamine (OPA) elicited no obvious fluorescence response from NI-OPD (Fig. 1C). Although some fluorescence enhancement is observed upon addition of glyoxal (GO), it is much weaker than that in the presence of MGO. Furthermore, the probe was found to exhibit insignificant fluorescence responses to several common cations and anions (Fig. S5†).
It is well known that o-phenylenediamine is a commonly used reactive group for detecting nitric oxide (NO).34–37 However, it is noteworthy that NO elicits no significant fluorescence response from NI-OPD (Fig. S5†). Generally, a benzotriazole product is formed upon reacting NO with o-phenylenediamine as the benzotriazole is pH sensitive and its deprotonation at physiological pH can result in the formation of an electron-rich triazolate, which may lead to the fluorescence quenching through the acceptor-excited photo induced electron transfer (a-PET) mechanism.29,38,39 The physiological concentration of NO is estimated to be at the nanomolar level.40 In contrast, the intracellular MGO content is at least two orders of magnitude higher.41,42 Thus, these results indicate that other potential analytes will not interfere with MGO detection by NI-OPD.
Fluorescence imaging of exogenous and endogenous MGO in the ER of living cells
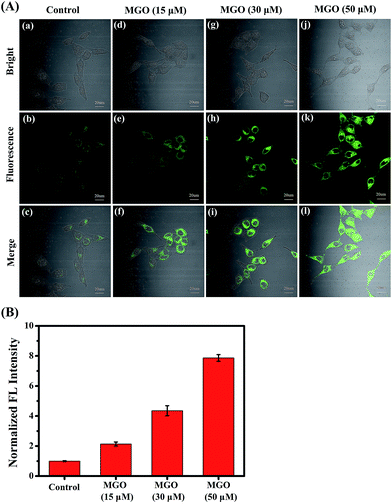
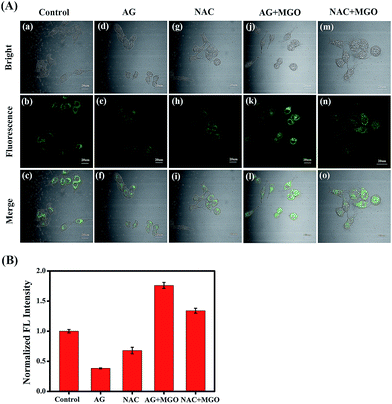
Encouraged by the excellent photophysical properties of NI-OPD and its selective response to MGO in vitro, we attempted to assess the suitability of NI-OPD for monitoring MGO in living cells. Accordingly, the cytotoxicity of NI-OPD was established using MTT assays with MCF-7 and HeLa cells. It was found that the cell viabilities exceed 95% when the cells are incubated for 24 h with 10 μM NI-OPD and are higher than 82% even when the cells are incubated with 30.0 μM NI-OPD, demonstrating the low cytotoxicity of NI-OPD (Fig. S6†).Subsequently, we applied NI-OPD to visualize intracellular MGO by incubating HeLa cells with NI-OPD and different levels of MGO. As shown in Fig. 2A(a–c), the cells exhibit definite fluorescence caused by endogenous MGO in the cells. However, upon incubation at various concentrations of MGO, an obvious fluorescence enhancement is observed (Fig. 2A(d–l)) and the fluorescence intensity is directly proportional to the concentration of MGO (Fig. 2B). Aminoguanidine (AG) and N-acetylcysteine (NAC), two common MGO scavengers, were used to confirm that this fluorescence is due to endogenous MGO in living cells.43 As shown in Fig. 3A and B, both the MGO scavengers remove MGO in HeLa cells to a large extent and the fluorescence intensity is dramatically weakened. However, when exogenous MGO (50 μM) is added to the HeLa cells pre-treated with AG or NAC, as expected, an obvious fluorescence intensity enhancement is observed. Similar results are obtained using MCF-7 cells (Fig. S7†). Thus, NI-OPD detects both exogenous and endogenous MGO in living cells.
Organelle-targeting ability of NI-OPD
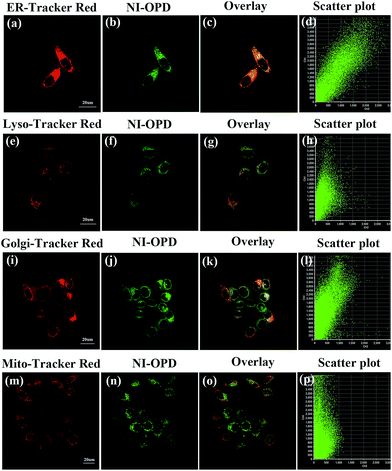
The subcellular localization of NI-OPD in HeLa and MCF-7 cells was also studied using co-staining assays. After the HeLa cells were treated with MGO, the universal fluorescent dyes, ER-Tracker Red, Lyso-Tracker Red, Golgi-Tracker Red and Mito-Tracker Red, were co-incubated with NI-OPD. As shown in Fig. 4a–d, the green channel for NI-OPD overlays well with the red channel of ER-Tracker Red, having an overlap coefficient of 0.94. A similar result was obtained when the same experiments were conducted with MCF-7 cells (Fig. S8,† overlap coefficient: 0.95), which confirms that the methyl sulphonamide group effectively induces the probe to target the ER.44–47 In contrast, NI-OPD shows poor correspondences with Lyso-Tracker Red, Golgi-Tracker Red and Mito-Tracker Red, with overlap coefficients of 0.76 (Fig. 4e–h), 0.78 (Fig. 4i–l) and 0.55 (Fig. 4m–p), respectively. Although the probe is partially distributed throughout other subcellular organelles, it is primarily accumulated in the ER, which helps us to detect MGO in the ER. Thus, NI-OPD is a very promising tool for tracking MGO levels during ER stress and cellular processes in different disease models.Fluorescence monitoring of MGO changes under ER stress
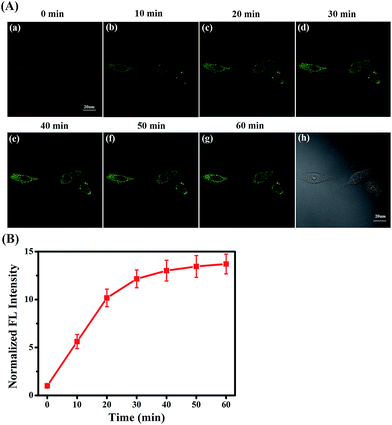
Under ER stress conditions, unfolded or misfolded proteins accumulate in the ER of cells, leading to abnormal cell function or apoptosis, eventually causing diabetes.48–51 In diabetes sufferers, cellular MGO concentrations are higher than normal owing to abnormal glucose metabolism.52,53 Consequently, having established the efficacy and hypotoxicity of NI-OPD in living cells, we attempted to monitor MGO levels in living cells under ER-stress conditions stimulated by chemical agents.The MCF-7 cells were incubated with NI-OPD, then washed with PBS and treated with tunicamycin (Tm), which is a nucleotide antibiotic produced by actinomycetes that inhibits glycosylation and induces abnormal metabolism of proteins, leading to ER stress.54 As illustrated in Fig. 5A(a–g), when the MCF-7 cells are treated with Tm, the fluorescence intensity of NI-OPD increases with treatment time, indicating an increase in MGO level in the ER under this stimulus. Furthermore, upon treatment with other stimuli, such as thapsigargin (Tg) and dithiothreitol (DTT), the content of the MGO in MCF-7 cells also increases (Fig. S9 and S10†). Thus, NI-OPD can be utilised to monitor MGO variations under ER stress.
Two-photon fluorescence imaging of MGO in diabetic mice
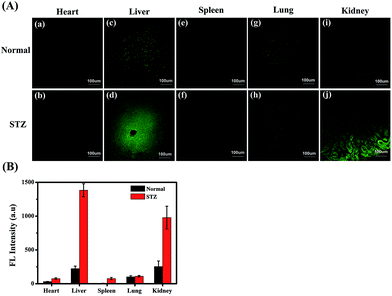
MGO variations in the tissues of normal, diabetic and drug-treated diabetic mice were tracked utilising the two-photon fluorescence imaging capabilities of NI-OPD. First, we assessed whether the probe could be used for staining and imaging of MGO in mouse tissues. As shown in Fig. S11(c and d),† the NI-OPD stained kidney tissue exhibits weak fluorescence intensity, whereas, the kidney tissue treated with NI-OPD and MGO (50 μM) exhibits much brighter fluorescence (Fig. S11(e and f)†). When the tissue is pre-treated with aminoguanidine (AG) and then with NI-OPD, no fluorescence is observed due to the inhibition effect of AG (Fig. S11(a and b)†). These significant fluorescence changes demonstrate that the probe is suitable for monitoring MGO in tissues.Diabetes sufferers present abnormal glucose metabolism and inconsistent MGO levels, especially in the liver and kidney tissues.55,56 Thus, diabetic mice were obtained by treating normal mice with streptozotocin (STZ), which is a glucosamine–nitrosourea and DNA alkylating agent that effects selective destruction of pancreatic beta cells and induces diabetes in many animals.57 We then investigated the MGO levels in different organs of the normal and STZ-induced diabetic mice using NI-OPD. As shown in Fig. 6, the organ tissue of the normal mice presented relatively weak fluorescence, whereas, those of the diabetic mice, particularly the liver and kidney tissues, exhibit brighter fluorescence (Fig. 6A(d, j)). This is because the liver and kidneys are the major metabolic organs and a large amount of MGO is excluded by those two organs under diabetic conditions. The confocal imaging results are consistent with those of previous reports.55,56
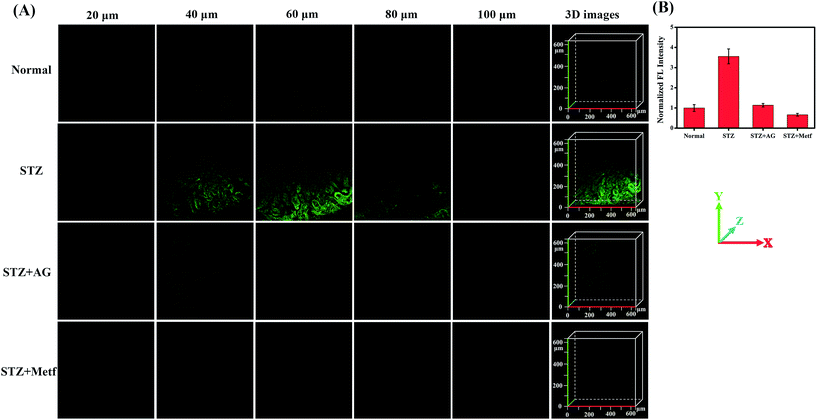
The diabetic mice were then treated orally with metformin (Metf), a disubstituted biguanide that is the most widely prescribed oral hypoglycaemic agent, which protects the liver and kidneys from MGO, as a comparative drug treatment model.1,13,14,58 We divided mice into four groups: an unstimulated blank control group, labelled the Normal group; STZ-induced diabetic mice, labelled the STZ group; AG-treated diabetic mice, labelled the STZ + AG group; and metformin-treated diabetic mice, labelled the STZ + Metf group. The mice were then anaesthetised and their liver and kidneys surgically exposed and incubated with NI-OPD (10 μM). Subsequently, two-photon fluorescence imaging of the liver and kidney tissues was performed with a 780 nm two-photon laser. As shown in Fig. 7, the intensity of the 3D fluorescence image of the kidney tissue in the STZ group is clearly enhanced compared to that in the Normal group. These results demonstrate that the diabetic mice exhibit higher MGO levels in the kidney tissue owing to abnormal glucose metabolism.
To further confirm this result, we intraperitoneally injected AG into the STZ group. As expected, the kidney tissues of the AG treated diabetic mice exhibit weak fluorescence, indicating a decrease in MGO levels and verifying the specificity of the probe. Moreover, when the STZ-induced diabetic mice were orally gavaged with metformin for seven days, the fluorescence intensity in the kidney tissues was significantly reduced, indicating that the MGO content of their kidney tissues was obviously decreased. It is thus possible that metformin has an inhibiting effect on glycation and AGE formation.1 Similar results were obtained for the liver tissue under the same conditions (Fig. S12†). These results are consistent with those of previous reports.11,13,14 All these data further demonstrate that NI-OPD is a suitable fluorescence imaging tool for monitoring MGO levels in the kidney and liver tissues of normal or diabetic mice.
Conclusions
In summary, we have constructed a two-photon, ER-targeting fluorescent probe (NI-OPD) for tracking MGO in living cells and a diabetic mice model. The probe is highly selective and sensitive to MGO as well as exhibits excellent fluorescence properties. Colocalization experiments confirmed that NI-OPD effectively accumulates in the ER of cells. Thus, NI-OPD was successfully used to monitor changes in the MGO levels under ER conditions utilising two-photon fluorescence imaging. Moreover, the probe was used to demonstrate that the MGO levels in the liver and kidneys of diabetic mice are higher than those in normal mice, and that after treatment with the antidiabetic drug metformin, the production of MGO in the diabetic mice was decreased. All these results indicate that NI-OPD could potentially serve as a useful tool for further investigating the involvement of MGO in ER-associated diseases.Conflicts of interest
There are no conflicts to declare.Acknowledgements
This work was financially supported by the National Science Foundation of China (21576037, 21676047, 21421005), NSFC-Liaoning United Fund (U1608222).Notes and references
- P. J. Beisswenger, S. K. Howell, A. D. Touchette, S. Lal and B. S. Szwergold, Diabetes, 1999, 48, 198–202 CrossRef PubMed.
- P. J. Thornalley, Drug Metab. Drug Interact., 2008, 23, 125–150 Search PubMed.
- C. Xu, B. Bailly-Maitre and J. C. Reed, J. Clin. Invest., 2005, 115, 2656–2664 CrossRef PubMed.
- U. Ozcan, Q. Cao, E. Yilmaz, A. H. Lee, N. N. Iwakoshi, E. Ozdelen, G. Tuncman, C. Gorgun, L. H. Glimcher and G. S. Hotamisligil, Science, 2004, 306, 457–461 CrossRef PubMed.
- M. Y. Sherman and A. L. Goldberg, Neuron, 2001, 29, 15–32 CrossRef PubMed.
- R. R. Kopito, Trends Cell Biol., 2000, 10, 524–530 CrossRef PubMed.
- R. V. Rao, H. M. Ellerby and D. E. Bredesen, Cell Death Differ., 2004, 11, 372–380 CrossRef PubMed.
- L. H. Zhao and S. L. Ackerman, Curr. Opin. Cell Biol., 2006, 18, 444–452 CrossRef PubMed.
- M. Cnop, F. Foufelle and L. A. Velloso, Trends Mol. Med., 2012, 18, 59–68 CrossRef PubMed.
- P. Palsamy, K. R. Bidasee, M. Ayaki, R. C. Augusteyn, J. Y. Chan and T. Shinohara, Free Radical Biol. Med., 2014, 72, 134–148 CrossRef PubMed.
- C.-M. Chan, D.-Y. Huang, Y.-P. Huang, S.-H. Hsu, L.-Y. Kang, C.-M. Shen and W.-W. Lin, J. Cell. Mol. Med., 2016, 20, 1749–1760 CrossRef PubMed.
- D.-H. Nam, J.-H. Han, S. Kim, Y. Shin, J. H. Lim, H. C. Choi and C.-H. Woo, Biochem. Biophys. Res. Commun., 2016, 480, 622–628 CrossRef PubMed.
- Z. Kender, T. Fleming, S. Kopf, P. Torzsa, V. Grolmusz, S. Herzig, E. Schleicher, K. Racz, P. Reismann and P. P. Nawroth, Exp. Clin. Endocrinol. Diabetes, 2014, 122, 316–319 CrossRef PubMed.
- T. Kiho, M. Kato, S. Usui and K. Hirano, Clin. Chim. Acta, 2005, 358, 139–145 CrossRef PubMed.
- S. Battah, N. Ahmed and P. J. Thornalley, in Maillard Reaction in Food Chemistry and Medical Science: Update for the Postgenomic Era, ed. S. Horiuchi, N. Taniguchi, F. Hayase, T. Kurata and T. Osawa, 2002, vol. 1245, pp. 355–356 Search PubMed.
- Y. Ogasawara, R. Tanaka, S. Koike, Y. Horiuchi, M. Miyashita and M. Arai, J. Chromatogr. B: Anal. Technol. Biomed. Life Sci., 2016, 1029–1030, 102–105 CrossRef PubMed.
- I. Nemet, L. Varga-Defterdarovic and Z. Turk, Clin. Biochem., 2004, 37, 875–881 CrossRef PubMed.
- A. Dhar, K. Desai, J. Liu and L. Wu, J. Chromatogr. B: Anal. Technol. Biomed. Life Sci., 2009, 877, 1093–1100 CrossRef PubMed.
- S.-T. Wang, Y. Lin, C. D. Spicer and M. M. Stevens, Chem. Commun., 2015, 51, 11026–11029 RSC.
- X. Zhou, S. Lee, Z. Xu and J. Yoon, Chem. Rev., 2015, 115, 7944–8000 CrossRef PubMed.
- W. Sun, S. Guo, C. Hu, J. Fan and X. Peng, Chem. Rev., 2016, 116, 7768–7817 CrossRef PubMed.
- T. D. Ashton, K. A. Jolliffe and F. M. Pfeffer, Chem. Soc. Rev., 2015, 44, 4547–4595 RSC.
- D. Wu, A. C. Sedgwick, T. Gunnlaugsson, E. U. Akkaya, J. Yoon and T. D. James, Chem. Soc. Rev., 2017, 46, 7105–7123 RSC.
- M. H. Lee, A. Sharma, M. J. Chang, J. Lee, S. Son, J. L. Sessler, C. Kang and J. S. Kim, Chem. Soc. Rev., 2018, 47, 28–52 RSC.
- X. Chen, Y. Zhou, X. Peng and J. Yoon, Chem. Soc. Rev., 2010, 39, 2120–2135 RSC.
- M. M. Alam, M. Chattopadhyaya, S. Chakrabarti and K. Ruud, Acc. Chem. Res., 2014, 47, 1604–1612 CrossRef PubMed.
- F. Helmchen and W. Denk, Nat. Methods, 2005, 2, 932–940 CrossRef PubMed.
- H. M. Kim and B. R. Cho, Chem. Rev., 2015, 115, 5014–5055 CrossRef PubMed.
- T. Wang, E. F. Douglass Jr, K. J. Fitzgerald and D. A. Spiegel, J. Am. Chem. Soc., 2013, 135, 12429–12433 CrossRef PubMed.
- T. Tang, Y. Zhou, Y. Chen, M. Li, Y. Feng, C. Wang, S. Wang and X. Zhou, Anal. Methods, 2015, 7, 2386–2390 RSC.
- P. Ning, W. Wang, M. Chen, Y. Feng and X. Meng, Chin. Chem. Lett., 2017, 28, 1943–1951 CrossRef.
- W. Xu, Z. Zeng, J. H. Jiang, Y. T. Chang and L. Yuan, Angew. Chem., Int. Ed., 2016, 55, 13658–13699 CrossRef PubMed.
- K. Qiu, Y. Chen, T. W. Rees, L. Ji and H. Chao, Coord. Chem. Rev., 2017 DOI:10.1016/j.ccr.2017.10.022.
- X. Chen, F. Wang, J. Y. Hyun, T. Wei, J. Qiang, X. Ren, I. Shin and J. Yoon, Chem. Soc. Rev., 2016, 45, 2976–3016 RSC.
- Z. Mao, W. Feng, Z. Li, L. Zeng, W. Lv and Z. Liu, Chem. Sci., 2016, 7, 5230–5235 RSC.
- E. Sasaki, H. Kojima, H. Nishimatsu, Y. Urano, K. Kikuchi, Y. Hirata and T. Nagano, J. Am. Chem. Soc., 2005, 127, 3684–3685 CrossRef PubMed.
- Y. Q. Sun, J. Liu, H. Zhang, Y. Huo, X. Lv, Y. Shi and W. Guo, J. Am. Chem. Soc., 2014, 136, 12520–12523 CrossRef PubMed.
- Y. Gabe, Y. Urano, K. Kikuchi, H. Kojima and T. Nagano, J. Am. Chem. Soc., 2004, 126, 3357–3367 CrossRef PubMed.
- H. Kojima, M. Hirotani, Y. Urano, K. Kikuchi, T. Higuchi and T. Nagano, Tetrahedron Lett., 2000, 41, 69–72 CrossRef.
- C. N. Hall and J. Garthwaite, Nitric Oxide, 2009, 21, 92–103 CrossRef PubMed.
- P. J. Thornalley, Drug Metab. Drug Interact., 2008, 23, 125–150 Search PubMed.
- N. Rabbani and P. J. Thornalley, Amino Acids, 2012, 42, 1133–1142 CrossRef PubMed.
- A. Dhar, I. Dhar, K. M. Desai and L. Wu, Br. J. Pharmacol., 2010, 161, 1843–1856 CrossRef PubMed.
- B. K. McMahon, R. Pal and D. Parker, Chem. Commun., 2013, 49, 5363–5365 RSC.
- H. Xiao, P. Li, X. Hu, X. Shi, W. Zhang and B. Tang, Chem. Sci., 2016, 7, 6153–6159 RSC.
- H. Xiao, C. Wu, P. Li, W. Gao, W. Zhang, W. Zhang, L. Tong and B. Tang, Chem. Sci., 2017, 8, 7025–7030 RSC.
- H. Xiao, X. Liu, C. Wu, Y. Wu, P. Li, X. Guo and B. Tang, Biosens. Bioelectron., 2017, 91, 449–455 CrossRef PubMed.
- K. Aston-Mourney, J. Proietto, G. Morahan and S. Andrikopoulos, Diabetologia, 2008, 51, 540–545 CrossRef PubMed.
- E. Karaskov, C. Scott, L. Zhang, T. Teodoro, M. Ravazzola and A. Volchuk, Endocrinology, 2006, 147, 3398–3407 CrossRef PubMed.
- D. L. Eizirik, A. K. Cardozo and M. Cnop, Endocr. Rev., 2008, 29, 42–61 CrossRef PubMed.
- H. P. Harding and D. Ron, Diabetes, 2002, 51, S455–S461 CrossRef PubMed.
- P. Sarkar, K. Kar, M. C. Mondal, I. Chakraborty and M. Kar, Ann. Acad. Med. Singapore, 2010, 39, 909–912 Search PubMed.
- K. C. Tan, S. W. Shiu, Y. Wong and X. Tam, Diabetes/Metab. Res. Rev., 2011, 27, 488–492 CrossRef PubMed.
- T. Nakagawa, H. Zhu, N. Morishima, E. Li, J. Xu, B. A. Yankner and J. Y. Yuan, Nature, 2000, 403, 98–103 CrossRef PubMed.
- J. E. Gerich, Diabetic Med., 2010, 27, 136–142 CrossRef PubMed.
- C. Meyer, M. Stumvoll, V. Nadkarni, J. Dostou, A. Mitrakou and J. Gerich, J. Clin. Invest., 1998, 102, 619–624 CrossRef PubMed.
- V. Burkart, Z. Q. Wang, J. Radons, B. Heller, Z. Herceg, L. Stingl, E. F. Wagner and H. Kolb, Nat. Med., 1999, 5, 314–319 CrossRef PubMed.
- R. Yanardag, O. Ozsoy-Sacan, S. Bolkent, H. Orak and O. Karabulut-Bulan, Hum. Exp. Toxicol., 2005, 24, 129–135 CrossRef PubMed.
Footnote |
| † Electronic supplementary information (ESI) available: Synthesis, experimental details, and additional spectroscopic data and images. See DOI: 10.1039/c8sc02578a |
| This journal is © The Royal Society of Chemistry 2018 |

