 Open Access Article
Adhesion analysis of single circulating tumor cells on a base layer of endothelial cells using open microfluidics†
Sifeng
Mao‡
 ,
Qiang
Zhang‡
 ,
Haifang
Li
 ,
Wanling
Zhang
,
Qiushi
Huang
,
Wanling
Zhang
,
Qiushi
Huang
 ,
Mashooq
Khan
and
Jin-Ming
Lin
 *
*
Department of Chemistry, Beijing Key Laboratory of Microanalytical Methods and Instrumentation, MOE Key Laboratory of Bioorganic Phosphorus Chemistry & Chemical Biology, Tsinghua University, Beijing 100084, China. E-mail: jmlin@mail.tsinghua.edu.cn
First published on 13th August 2018
Abstract
Circulating Tumor Cell (CTC) adhesion is essential in understanding the mechanism of metastasis. Although conventional methods for measuring adhesion strength have performed well on cell populations, a deeper insight into cell behavior demands new approaches for realizing non-destructive, high-resolution, in situ analysis of single cell adhesion. Here, we present a microfluidic method for adhesion strength analysis of single CTCs on a base layer of endothelial cells (ECs) to clarify cell-to-cell adhesion at single cell resolution. A confined flow in open space formed by a microfluidic device supplied a trypsin zone for the analysis of single cell adhesion. Tumor cell lines were used to model CTCs. This method was proved successful for extracting different types of CTCs from an endothelial cell layer to measure their adhesion strength by the time required for detachment. Moreover, we successfully uncovered the drug influence on the adhesion strength of single CTCs on ECs, which is promising in drug screening for tumor therapy. The current work reports a general strategy for cell-to-cell adhesion analysis for single cells.
Introduction
Cell adhesion is crucial for essential cellular processes such as survival, spreading, migration, proliferation, and differentiation.1–3 It is of prime importance for cell biology and medicine, and is a key player in several biological processes such as tumor metastasis,4,5 stem-cell fate,6 and cell death.7 Irregular adhesion behaviors usually lead to diseases including cancer,8–10 atherosclerosis11 and arthritis.12 Deeper insight into cell adhesion is helpful for solving those physiological problems. Cell-to-cell adhesion plays an important role in processes including tumor metastasis, tissue regeneration, and immune response.13–15CTCs have been demonstrated to have a key role in tumor metastasis which accounts for the majority of cancer-associated deaths, though the complex process remains the least studied aspect of cancer biology.16 CTCs mutating from normal cells or arising from primary tumors invade the vasculature of adjacent normal tissues. The resulting intravasation provides an avenue for CTCs to travel to distant positions, where they seed new tumors.17 Although most of the CTCs rapidly clear, a few of them are physically trapped on the vascular internal wall for only seconds or minutes after their initial entry to the vasculature.18 After their adhesive interactions with the vascular internal wall, adherent CTCs are capable of maneuvering through the capillary-sized vessels to a new site where a single CTC acts as a seed for new tumors. Ideally, blocking cell adherence to vessels will be a new tumor therapy strategy, while the conventional therapies focus more on the induction of cancer cell apoptosis and inhibition of cancer cell proliferation.
Single cell analysis has been extensively studied in recent years because of technical advances in the isolation of CTCs from the blood of cancer patients.19–23 The detection of CTCs allows precancerous diagnosis, and apoptosis analysis in vitro can be utilized to profile genetic mutations and drug sensitivities.24,25 Deeper insight into metastasis indicated that CTC adhesion is essential in tumor metastasis.26–28 In particular, better comprehension of the adhesion between cancer cells and endothelial cells will help us to understand how the cancer cells leave the original tumor, adhere to the vascular internal wall, and invade tissues from vessels.29 Unfortunately, few methods are capable of adhesion analysis of single CTCs, and though there are many methods for adhesion measurement of cell populations, including cell counting30,31 and quartz crystal microbalance (QCM) sensors,32 they only reveal statistical properties. Other methods based on AFM33 and micropipettes34 performed well on this issue, but they caused severe damage to the cellular functions or even killed the cells. Therefore, a gentle approach is crucial for adhesion strength analysis of natural cells at single cell resolution which contributes to understanding tumor metastasis.
Herein, we report a novel approach for measuring natural cell-to-cell adhesion strength of single CTCs on a base layer of ECs that could contribute to uncovering the mechanism of tumor metastasis. Trypsin solution in a confined zone35 was utilized to extract single adhered CTCs from an EC layer. The adhesion strength of multiple types of single-CTCs as well as the drug influence on CTC adhesion were investigated. The results indicated that different types of CTCs maintained different adhesion strengths and very few single-CTCs in each type held a strong adhesion ability to a HUVEC cell layer.
In our prediction, the CTCs possessing a higher adhesion strength would show stronger invasiveness. In the future, we can analyze the genomics and metabolomics of those special CTCs to reveal the mechanism of drug resistance in tumor cells, which is not only helpful for drug development and screening, but is also essential in uncovering the mechanism of invasiveness.
Results and discussion
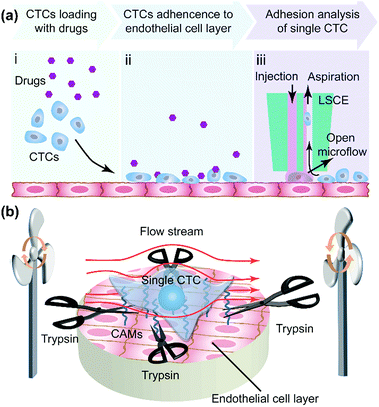
In tumor metastasis, adherence of CTCs to the vascular internal wall is a key step (Fig. S1†). To analyze cell adhesion strength of single CTCs in metastasis, first a CTC suspension was loaded onto an EC layer in adherent culture (Fig. 1a-i) and then the CTCs adhered onto the EC layer (Fig. 1a-ii) with or without the effect of drugs. We utilized a live single cell extractor (LSCE) to create a stable open microflow with a distribution of trypsin to analyze single CTCs and their adhesion strength (Fig. 1a-iii). A commercially available solution containing 0.25% trypsin and 0.02% EDTA was used in all experiments. The zone of trypsin was in dynamic equilibrium, where the trypsin was renewed ceaselessly and the products could be eliminated in time. The target single CTC was always surrounded by fresh trypsin with a stable concentration (Fig. 1a-iii). The temperature was controlled at 37 °C, and the pH also remained constant (pH 7.4) due to the buffering of culture medium. Under these constant conditions, the extracting time mainly depended on the adhesion strength of the target cell. The two fundamental modes of mass transfer were convection and diffusion. In order to control the spatial distribution of trypsin, the effect of diffusion driven by a concentration gradient would have to be as weak as possible, which would mean forced convection would be dominant. Generally, there should at least be an injection flow of trypsin and an aspiration flow nearby to suck out trypsin before it could leave the target region because of diffusion or an improper pressure gradient (Fig. S2†). In the experiments, the cell sample and LSCE were immersed in cell culture medium with 10% fetal bovine serum (FBS). Once the trypsin solution was aspirated back to the aspiration aperture, it was mixed with the cell culture medium. Therefore, the excess trypsin could be neutralized by sufficient FBS to prevent continued digestion of cellular proteins.Cell-to-cell adhesion was mediated by cell adhesion molecules (CAMs) including the Ig-superfamily, selectin and cadherin and integrin,36,37 which bond to other cells (Fig. 1b). During the process of cell adhesion, ECM proteins were recruited to form tight connections between cells (Fig. 1b) under the regulation of enzymes, including focal adhesion kinase. Trypsin digested the peptide bonds formed by lysine and arginine which are common components of protein. Therefore, single-cells detach gradually from adjacent cells. The time taken for this detachment represented the cell adhesion strength when the operation conditions (trypsin concentration, flow rates, temperature, and pH) remained constant. Moreover, the adhesion strength measured by the established method could also record the dynamic cell response during deadhesion, which was quite different from the protein analysis of focal adhesion.38
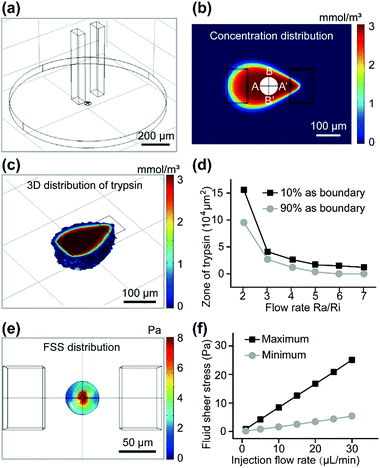
The dynamic characteristics of fluid around the cell were simulated by COMSOL Multiphysics (Fig. 2). As shown in Fig. 2a, the two cuboids represented the solution in both channels and the disk represented the solution between the bottom surface of the device and the substrate in the Petri dish. Trypsin solution (if not noted specifically, its concentration was always 3 mmol m−3) was injected into the system through the upper aperture of the left microchannel, and flowed out through the lower aperture. The trypsin solution and surrounding medium were aspirated back into the right microchannel through its lower aperture. The cell was modeled approximately on a bell-shaped rotator (Fig. 2a and S3a†).
All parameters in the simulation were identical to those in the experiments (if not noted specifically, the injection flow rate (Ri) = 10 μL min−1, and the aspiration flow rate (Ra) = 50 μL min−1, gap = 50 μm). The zone of trypsin (Fig. 2b) was consistent with the experimental results (Fig. S3B†). It is worth noting that the fluorescence area presented in the experimental results (Fig. S3b†) was the superposition of signals at different heights, so it was not always identical to that in the calculated results (the concentration distribution at the substrate surface) (Fig. 2b). The 3D distribution of trypsin could be controlled by adjusting the gap between the tip of the channels and the substrate surface (Fig. 2c). The concentration of trypsin near the target cell became lower with an increased gap (100 μm) (Fig. S3c†) near the target cell, which indicated that cells in the higher layer were covered with a higher concentration of trypsin, resulting in a shorter digestion time. The zone of trypsin decreased with an increase in the flow ratio (Fig. 2d) when the boundaries of the zone were set at 10% (or 90%) of the maximum trypsin concentration. An excessively low flow ratio would result in the leakage of trypsin, while a too high flow ratio made the small diffusion region fail to cover the target cell completely. In order to confine trypsin to a small area with a high concentration, the flow ratio was further optimized in later experiments.
Fluid shear stress (FSS) appeared to have a remarkable influence on the cell state, and excessive FSS would harm the cell. The FSS distributions near the substrate (Fig. S3d†) and cell surface (Fig. 2e) were calculated. Such low FSS (<25 Pa) caused little damage to the cells. The maximum and minimum of the calculated FSS near the cell surface were linear with the injection flow rate (Fig. 2f). With a constant flow ratio Ra/Ri, the concentration distribution was almost constant. Low FSS caused by a decreased flow rate (Fig. S3d†) would be insufficient in counteracting the physical interactions (physical adsorption, gravity, etc.), resulting in inadequate contact between the trypsin and the ECM proteins near the center of the adhesion region. An excessively high flow rate might peel the cell off the substrate before most of the connections were digested by trypsin, which would be harmful to the cell. Based on the calculated results, 10 μL min−1 for injection and 50 μL min−1 for aspiration were the optimal flow rates in our experiments.
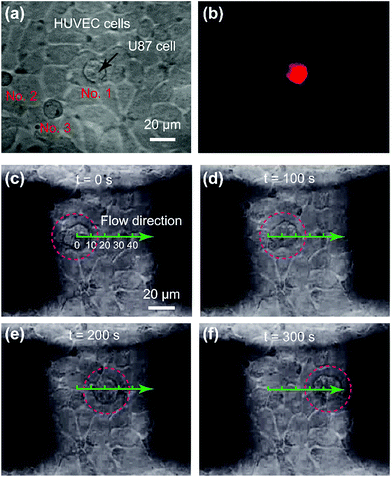
The substrate in the cell-to-cell adhesion experiments was pre-treated to enhance the cell layer adhesion on the substrate, and the cells with a better adhesion ability were chosen as a base. Therefore, the upper cells could be extracted before the base cells were obviously influenced. HUVEC cells acted as ECs, and U87 cells acted as CTCs. In the bright field image of one observational microzone, there were three single-cells on the cell layer (Fig. 3a). To distinguish U87 cells from HUVEC cells, the former ones were stained with 1,1′-dioctadecyl-3,3,3′,3′-tetramethylindocarbocyanine perchlorate (Dil) with red fluorescence for visualizing a single U87 cell on the HUVEC cell layer (Fig. 3b). By comparing the fluorescent image (Fig. 3b) with the bright field image (Fig. 3a), we confirmed that only the No. 1 cell was a U87 cell. Then, the extraction of single CTCs from the EC layer was demonstrated (Fig. 3c–f and ESI movie S1†). In most cases, a single U87 cell would start to move and leave the HUVEC cell layer gradually after the proteins were digested by trypsin. The time required for the complete extraction of the cell reflected the adhesion strength of a single U87 cell on the HUVEC cell layer. In some cases, as in Fig. 3c–f, the translational speed of the U87 cell under the flow environment was almost constant (0.1 μm s−1), which indicated that some single-U87 cells were only physically adsorbed on the HUVEC layer.
The action of trypsin, the fluid drag force (depending on the flow velocity) and the subatmospheric pressure jointly contributed to the extraction (Fig. 1b). At a constant flow ratio, the extracting time rose with an increase in the Ri and related Ra values (Fig. 4a). With an increase in the flow rate, the concentration of trypsin near the cell edge (point A and point B in Fig. 2b) showed no significant change (Fig. 4b and S4†). However, the fluid drag force and subatmospheric pressure that rose with the flow rates shortened the extracting time. With a constant injection flow rate, the extracting time showed different results with increasing flow ratios. The raising fluid drag force and subatmospheric pressure induced a reduction in the extracting time (Fig. 4c) when the flow ratio rose from 3 to 5, because the concentration of trypsin near the cell edge showed no significance (Fig. 4d and S5†). Then, the extracting time increased due to the sharp decrease of trypsin concentration when the flow ratio changed to 6 (Fig. 4d and S5†). When the ratio was higher than 7, the U87 cells failed to leave the glass within 30 min because the trypsin couldn’t reach the adhesion area. As a result, the flow ratio Ra/Ri = 5 was optimal.
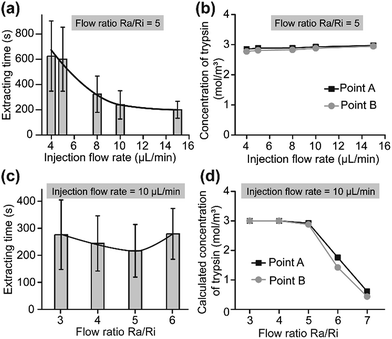 | ||
| Fig. 4 Adhesion strength analysis of single-U87 cells on a HUVEC cell layer. (a) Extracting time under different injection flow rates (Ra/Ri = 5) (n = 100). (b) Calculated trypsin concentration on the cell surface (points A and B in Fig. 2b) under different injection flow rates (Ra/Ri = 5). (c) Extracting time under different flow ratios Ra/Ri (n = 100). The injection flow rate was 10 μL min−1. (d) Calculated trypsin concentration on the cell surface (points A and B) under different flow ratios. | ||
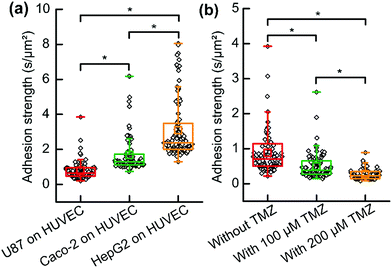
Three types of CTC including U87 cells, Caco-2 cells and HepG2 cells were analyzed when they were co-cultured and adhered to HUVECs which acted as ECs. To normalize the data, the extracting time divided by the cell contact surface area represented the adhesion strength of the cell. The cell contact surface was calculated using Image-Pro plus software (Media Cybernetics Inc., Bethesda, MD, USA). Each type of CTC provided a significantly different adhesion strength on the HUVEC cell layer (Fig. 5a). The results implied that HepG2 cells had a stronger adhesion ability and they might be easier to adhere to vascular internal walls. The glycoprotein on plasma may be the dominant parameter; however, more effort should be paid to uncover the mechanism of this strong adhesion in cell molecular biology. However, it should be noted that these results are far from conclusive that this type of CTC (HepG2 cell) produces tumor metastasis much more easily, because there are many other parameters. Our results contributed to characterizing and understanding the process of CTC adherence. Analyzing single CTC adhesion one by one, we observed that adhesions of single-CTCs had heterogeneity and few cells possessed an extremely high adhesion strength in each type of CTC.
As discussed, it would be an efficient way to prevent tumor metastasis by preventing CTCs from adhering to vascular internal walls. HUVEC cells were cultured in a Petri dish then formed a cell layer. The anti-tumor drug (temozolomide, TMZ) was mixed to the suspension of U87 cells. Then the suspension was immediately added to the HUVEC cell layer in a Petri dish. After 3 h, the medium surrounding the cells was replaced by fresh cell culture medium without drugs. Dead cells or non-adhered cells were removed, and adhesion analyses were performed to evaluate the influence of TMZ and reveal its role in cancer therapy. The results suggested that TMZ significantly weakened the adhesion of single-U87 cells on the HUVEC cell layer, and the adhesion strength further decreased with an increasing concentration of TMZ (Fig. 5b). TMZ led to apoptosis of tumor cells and damaged the DNA, resulting in abnormal protein secretion and weak adhesion. The results suggested that TMZ was effective not only for chemotherapy but also for preventing tumor metastasis.
Conclusions
In conclusion, we have presented a novel method based on open microfluidics for adhesion analysis of single CTCs on ECs to reveal one of the key steps, CTC adhesion, in tumor metastasis at single cell resolution. To the best of our knowledge, this is the first trial in which CTC adhesion on ECs was studied at single-cell resolution instead of in a cell population. With the single-cell adhesion strength measurement, three types of CTC (including U87 cell, Caco-2 cells and HepG2 cells) on ECs (HUVEC cells) were analyzed, and the three types appeared to have significantly different adhesion strengths. Moreover, the drug influence on CTC adhesion on ECs was evaluated. A significant decrease in CTC adhesion strength was confirmed when treated with temozolomide. As the adhesion of CTCs in blood vessels is a complex phenomena, we need to consider more factors in the future, such as the influence of fluid shear stress and the participation of immunocytes. Our method offers a novel perspective for studying single CTC adhesion and supplies a potential avenue for evaluating and screening anti-tumor drugs. By combining with gene detection and protein analysis, our method is expected to provide new insights into the prevention of tumor metastasis. The current method supplies a new avenue for adhesion behavior analysis of CTCs.Conflicts of interest
There are no conflicts to declare.Acknowledgements
We acknowledge the National Natural Science Foundation of China (No. 21435002, 21727814 and 21621003), Beijing Natural Science Foundation (2184106) and China Postdoctoral Science Foundation (2018T110085, 2017M620733).Notes and references
- S. Huang and D. E. Ingber, Nat. Cell Biol., 1999, 1, 131–138 CrossRef PubMed.
- J. S. Sun, L. Zhang, J. L. Wang, Q. Feng, D. B. Liu, Q. F. Yin, D. Y. Xu, Y. J. Wei, B. Q. Ding, X. H. Shi and X. Y. Jiang, Adv. Mater., 2015, 27, 1402–1407 CrossRef PubMed.
- S. E. L. Craig and S. M. Brady-Kalnay, Cancer Res., 2011, 71, 303–3093 CrossRef PubMed.
- S. M. Weis and D. A. Cheresh, Nat. Med., 2011, 17, 1359–1370 CrossRef PubMed.
- I. Malanchi, A. Santamaria-Martinez, E. Susanto, H. Peng, H. A. Lehr, J. F. Delaloye and J. Huelsken, Nature, 2012, 481, 85–95 CrossRef PubMed.
- B. Trappmann, J. E. Gautrot, J. T. Connelly, D. G. T. Strange, Y. Li, M. L. Oyen, M. A. C. Stuart, H. Boehm, B. J. Li, V. Vogel, J. P. Spatz, F. M. Watt and W. T. S. Huck, Nat. Mater., 2012, 11, 642–649 CrossRef PubMed.
- H. J. Kang, Y. Cui, H. Yin, A. Scheid, W. P. Hendricks, J. Schmidt, A. Sekulic, D. Kong, J. M. Trent and V. Gokhale, J. Am. Chem. Soc., 2016, 138, 13673–13692 CrossRef PubMed.
- A. Labernadie, T. Kato, A. Brugues, X. Serra-Picamal, S. Derzsi, E. Arwert, A. Weston, V. Gonzalez-Tarrago, A. Elosegui-Artola, L. Albertazzi, J. Alcaraz, P. Roca-Cusachs, E. Sahai and X. Trepat, Nat. Cell Biol., 2017, 19, 224–237 CrossRef PubMed.
- Y. Lu, L. Yang, W. Wei and Q. H. Shi, Lab Chip, 2017, 17, 1250–1263 RSC.
- H. Qi, G. Huang, Y. L. Han, W. Lin, X. Li, S. Wang, T. J. Lu and F. Xu, Crit. Rev. Biotechnol., 2016, 36, 20–31 CrossRef PubMed.
- Y. Y. Ding, L. Z. Huang, X. D. Xian, I. S. Yuhanna, C. R. Wasser, M. Frotscher, C. Mineo, P. W. Shaul and J. Herz, Sci. Signaling, 2016, 9, ra29 CrossRef PubMed.
- S. Umar, O. Hedaya, A. K. Singh and S. Ahmed, Toxicol. Appl. Pharmacol., 2015, 287, 299–305 CrossRef PubMed.
- J. K. Lee, E. T. Jansson, H. G. Nam and R. N. Zare, Anal. Chem., 2016, 88, 5453–5461 CrossRef PubMed.
- L. A. Vernetti, N. Senutovitch, R. Boltz, R. DeBiasio, T. Y. Shun, A. Gough and D. L. Taylor, Exp. Biol. Med., 2016, 241, 101–114 CrossRef PubMed.
- P. F. Gao, M. X. Gao, H. Y. Zou, R. S. Li, J. Zhou, J. Ma, Q. Wang, F. Liu, N. Li, Y. F. Li and C. Z. Huang, Chem. Sci., 2016, 7, 5477–5483 RSC.
- M. Poudineh, M. Labib, S. Ahmed, L. N. M. Nguyen, L. Kermanshah, R. M. Mohamadi, E. H. Sargent and S. O. Kelley, Angew. Chem., Int. Ed., 2017, 56, 163–168 CrossRef PubMed.
- Y. Song, T. Tian, Y. Shi, W. Liu, Y. Zou, T. Khajvand, S. Wang, Z. Zhu and C. Yang, Chem. Sci., 2017, 8, 1736–1751 RSC.
- S. H. Au, B. D. Storey, J. C. Moore, Q. Tang, Y.-L. Chen, S. Javaid, A. F. Sarioglu, R. Sullivan, M. W. Madden, R. O’Keefe, D. A. Haber, S. Maheswaran, D. M. Langenau, S. L. Stott and M. Toner, Proc. Natl. Acad. Sci. U. S. A., 2016, 113, 4947–4952 CrossRef PubMed.
- A. Sarkar, S. Kolitz, D. A. Lauffenburger and J. Han, Nat. Commun., 2014, 5, 3421–3429 CrossRef PubMed.
- X. Jie, H. Yang, M. Wang, Y. Zhang, W. Wei and Z. Xia, Angew. Chem., Int. Ed., 2017, 56, 14596–14601 CrossRef PubMed.
- R. N. Zare and S. Kim, Microfluidic platforms for single-cell analysis, Annu. Rev. Biomed. Eng., 2010, 12, 187–201 CrossRef PubMed.
- A. R. Wheeler, W. R. Throndset, R. J. Whelan, A. M. Leach, R. N. Zare, Y. H. Liao, K. Farrell, I. D. Manger and A. Daridon, Anal. Chem., 2003, 75, 3581–3586 CrossRef PubMed.
- M. Labib, R. M. Mohamadi, M. Poudineh, S. U. Ahmed, I. Ivanov, C. L. Huang, M. Moosavi, E. H. Sargent and S. O. Kelley, Nat. Chem., 2018, 10, 489–495 CrossRef PubMed.
- T. Jing, R. Ramji, M. E. Warkiani, J. Han, C. T. Lim and C. H. Chen, Biosens. Bioelectron., 2015, 66, 19–23 CrossRef PubMed.
- B. L. Khoo, G. Grenci, T. Jing, Y. B. Lim, S. C. Lee, J. P. Thiery, J. Han and C. T. Lim, Sci. Adv., 2016, 2, e1600274 Search PubMed.
- B. L. Khoo, G. Grenci, Y. B. Lim, S. C. Lee, J. Han and C. T. Lim, Nat. Protoc., 2018, 13, 34–58 CrossRef PubMed.
- B. J. Green, T. S. Safaei, A. Mepham, M. Labib, R. M. Mohamadi and S. O. Kelley, Angew. Chem., Int. Ed., 2016, 55, 1252–1265 CrossRef PubMed.
- Z. Zhu and C. J. Yang, Acc. Chem. Res., 2017, 50, 22–31 CrossRef PubMed.
- A. Giladi and I. Amit, Immunology, one cell at a time, Nature, 2017, 547, 27 CrossRef PubMed.
- K. V. Christ and K. T. Turner, J. Adhes. Sci. Technol., 2010, 24, 2027–2058 CrossRef.
- G. Lykotrafitis, Biophys. J., 2015, 108, 167a CrossRef.
- J. Y. Chen, L. S. Penn and J. Xi, Biosens. Bioelectron., 2018, 99, 593–602 CrossRef PubMed.
- J. Friedrichs, J. Helenius and D. J. Muller, Nat. Protoc., 2010, 5, 1353–1361 CrossRef PubMed.
- B. Hogan, A. Babataheri, Y. Y. Hwang, A. I. Barakat and J. Husson, Biophys. J., 2015, 109, 209–219 CrossRef PubMed.
- S. Mao, W. Zhang, Q. Huang, M. Khan, H. Li, K. Uchiyama and J.-M. Lin, Angew. Chem., Int. Ed., 2018, 57, 236–240 CrossRef PubMed.
- B. M. Gumbiner, Cell, 1996, 84, 345–357 CrossRef PubMed.
- K. Anselme, Biomaterials, 2000, 21, 667–681 CrossRef PubMed.
- P. Kanchanawong, G. Shtengel, A. M. Pasapera, E. B. Ramko, M. W. Davidson, H. F. Hess and C. M. Waterman, Nature, 2010, 468, 580–584 CrossRef PubMed.
Footnotes |
| † Electronic supplementary information (ESI) available. See DOI: 10.1039/c8sc03027h |
| ‡ These authors contributed equally to this work. |
| This journal is © The Royal Society of Chemistry 2018 |

