Particle size effect on the thermal conductivity reduction of silicon based thermoelectric composites
Received
14th March 2018
, Accepted 17th May 2018
First published on 22nd May 2018
Abstract
Composites of Si and transition metal silicides have been studied extensively for waste heat recovery applications because of their non-toxic, low cost and environmentally friendly nature. Composite samples made up of Si particles embedded in an Al doped β-FeSi2 matrix are synthesized by eutectoid decomposition of α-Fe2Si5−xAlx (x = 0.025, 0.05). The presence and uniform spatial distribution of Si particles are confirmed by means of X-ray diffraction and backscattered electron images of the samples, respectively. We measure the thermoelectric properties of our composite samples and find the highest figure of merit ZT = 0.09 for the sample with x = 0.05 at 773 K. Based on the interface thermal resistance predicted by the diffused mismatch model, it is shown that (i) the experimental values of the thermal conductivity of the composites are well described by the crowding factor model for different particles sizes and (ii) the matrix thermal conductivity can be reduced by half by inserting Si nanoparticles with a volume fraction of 50% and a radius of about 10 nm. Furthermore, a condition for lowering the thermal conductivity of particulate composites is derived, which can be useful to tune their microstructural parameters for thermoelectric applications.
1 Introduction
Thermoelectric power generation is a reliable and environment-friendly technology for waste heat recovery applications, which does not involve gas emissions. The efficiency of a thermoelectric generator is determined by the dimensionless figure of merit ZT = S2σT/(κe + κL), where S is the Seebeck coefficient, σ is the electrical conductivity, κe and κL are the respective electronic and lattice thermal conductivities, and T is the absolute temperature of the involved thermoelectric material. ZT can thus be enhanced by increasing the power factor (PF = S2σ) and/or by decreasing the thermal conductivity, but the complex interdependency of these two quantities makes it challenging. This is one of the reasons why the reduction in lattice thermal conductivity (κL), without significantly modifying the other material properties, is known as one of the efficient ways to enhance the figure of merit of thermoelectric materials.1–5
Composite materials are preferred for thermoelectric applications, because they efficiently scatter phonons at the interfaces to lower the κL, which in turn leads to an increased ZT. The enhancement of ZT in composite materials has been successfully demonstrated in existing systems like tellurides,6–11 half-heuslers,12,13 oxides,14–16 polymers17–20 and silicides.21–25 Thermoelectric composites made up of Si and transition metal silicides have been studied extensively because of their low cost and environmentally friendly nature.21,24,26,27 β-FeSi2 is one of the thermally and chemically stable, cheap transition metal silicides with applications in thermoelectric power generation and photovoltaics.4,28,29 The thermoelectric performance of β-FeSi2 can be improved by p-type30–32 and n-type33–35 dopings and by addition of an oxide dispersion.36 According to the Fe–Si phase diagram, a composite of silicon embedded β-FeSi2 can be synthesized by eutectoid decomposition of α-Fe2Si5. The effect of Co37 and Al38 dopings on the thermoelectric properties of the Si/β-FeSi2 composite has been reported in the literature. From the phase diagram, 1210 K is the equilibrium temperature for the existence of Si, β-FeSi2 and α-Fe2Si5, and the time required for complete transformation of α-Fe2Si5 into Si and β-FeSi2 as a function of temperature is given by the time–temperature transformation diagram (TTT diagram). The size of the dispersed Si particles can be tuned by varying the heat treatment temperature; the temperatures near to the equilibrium temperature produce a microstructure with coarse particles and the temperature farther from equilibrium results in a fine dispersion of silicon particles.39,40
In Si/β-FeSi2 composites, the interface between silicon and β-FeSi2 is expected to scatter phonons to reduce κL. This interface might also scatter charge carriers to lower the electrical conductivity, which limits the enhancement of ZT. Reducing the size of the dispersed particles to values in the range between the mean free path of phonons and electrons can effectively scatter phonons without significantly affecting the charge carrier transport.22,41–43 Hence the variation in silicon particle size affects the thermoelectric properties. The effect of silicon particle size on the thermal conductivity of Si/β-FeSi2 composites with different silicon particle sizes has been experimentally assessed and reported in the literature.37,40,44
In this work, Si/Al doped β-FeSi2 composites have been synthesized by eutectoid decomposition of α-Fe2Si5−xAlx (x = 0.025 and 0.05) treated at 973 K for 10 h, and their thermoelectric properties have been studied. It is shown that the thermal conductivity of the obtained samples is different from those reported in ref. 38, as a result of the differences in the heat treatment temperature and time, which leads to the difference in silicon particle size. Furthermore, the thermal conductivity of Si/β-FeSi2 with varying silicon particle size and volume fraction is modeled using the crowding factor description that takes into account the interfacial thermal resistance along with the size, shape and concentration of particles.45 This explanation may provide an insight into tuning the microstructural parameters. Based on this model, we have found that although the thermal conductivity of silicon is much higher than that of the β-FeSi2 matrix, the Si particle size reduction plays an important role in decreasing the thermal conductivity of these composites.
2 Experimental section
Stoichiometric amounts of Fe, Si and Al have been weighed to form Fe2Si5−xAlx (x = 0.025, 0.05) and arc melted in an argon atmosphere. Arc melting of a titanium gutter has been carried out prior arc melting of the samples to remove the residual oxygen from the chamber. An arc melted ingot has been pulverized using a mortar and pestle, and loaded into a graphite die for compaction using hot pressing. Hot pressing has been carried out in a home-built inductively heated uniaxial press, by applying 40 MPa pressure at 1373 K for 7 minutes. The compacted pellets have been heat treated in a vacuum sealed quartz tube at 973 K for 10 h, to facilitate the eutectoid decomposition. The pellet with x = 0.025 and heat treated at 973 K has been named 2Al-973, while the sample with x = 0.05 and heat treated at 973 K has been named 5Al-973. The literature data for the sample 5Al-1073 heat treated at 1073 K with x = 0.05 are also presented here for comparison.38
Phase analysis has been carried out using the X-ray diffraction (XRD, Cu Kα, λ = 1.5418, Panalytical X'Pert PRO) patterns of the samples recorded in the 2θ range from 10° to 110° at a scan rate of 1.6° min−1. The XRD patterns have been refined through the Rietveld method implemented in GSAS-II software.46 The instrumental parameter input for GSAS-II has been obtained by refining the XRD pattern of silicon powder with negligible crystallite size broadening. The microstructure of the samples has been analyzed using Backscattered Electron (BSE) images obtained using a Scanning Electron Microscope (FEG, FEI Inspect F50) equipped with a BSE detector. The average particle size and volume fraction of silicon particles have been estimated using ImageJ,47 an image processing software program with the BoneJ plug-in.48
The electrical resistivity of the disc samples with 10 mm diameter and 2 mm thickness has been measured by means of the Van der Pauw four-probe method between 300 K and 773 K. Parallelepiped samples of ∼8 mm × 2 mm × 2 mm have been used for the Seebeck coefficient measurements using an ULVAC-RIKO ZEM-3 instrument under a He atmosphere between 300 K and 773 K. The thermal diffusivity (D) of the samples has been measured using the standard laser flash technique (Netzsch LFA-457) at temperatures from 300 K to 773 K. The temperature dependent heat capacity (Cp) of the samples has been measured using a standard pyroceram, which is in good agreement with the Dulong–Petit value. The total thermal conductivity (κ) of the samples has then been estimated using the formula κ = D × ρ × Cρ, where ρ is the density of the samples. The density of the samples has been measured using Archimedes' principle and its values are summarized in Table 1.
Table 1 Density of the samples
| Sample |
Density (g cm−3) |
| 2Al-973 |
4.10 |
| 5Al-973 |
4.11 |
| 5Al-1073 |
4.18 |
3 Results and discussion
3.1 Phase and microstructural characterization
Fig. 1a shows the XRD pattern of the samples synthesized by the eutectoid decomposition of α-Fe2Si5−xAlx (x = 0.025 and 0.05) at 973 K/10 h. The peaks corresponding to Si and β-FeSi2 phases are clearly observed in the pattern, which confirms that the samples are X-ray pure. Fig. 1b shows the Rietveld refined XRD pattern of the sample 5Al-973. From the refinement, the weight fraction of Si in the composite samples has been estimated to be ∼11%.
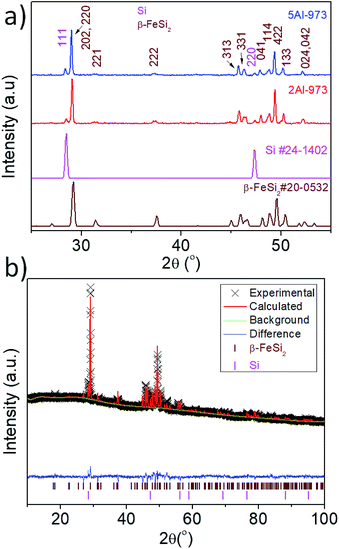 |
| | Fig. 1 (a) XRD pattern of the samples heat treated at 973 K for 10 h and (b) Rietveld profile refinement of the sample 5Al-973. | |
The Backscattered Electron (BSE) micrographs of the samples 5Al-1073 and 5Al-973 are shown in Fig. 2a and c, respectively. The color contrast in these micrographs identifies the Si and β-FeSi2 phases with black and gray colors, respectively. The size distribution of the Si particles inside the samples heat treated at 1073 K and 973 K is shown in Fig. 2b and d, respectively. Note that the average particle size of dispersed silicon in the samples heat treated at 973 K is smaller than that in the sample treated at 1073 K. The metallic ternary phase formation and local microstructural variation reported for the sample 5Al-1073 (ref. 38) (Fig. 2a) are not observed in the sample 5Al-973. Fig. 2c shows a fairly uniform distribution of silicon particles throughout the sample 5Al-973. The ternary metallic phase formation has been reported in the literature, with heat treatment at 997 K for one week.49 As the heat treatment of our samples has been carried out at 973 K for 10 h only, this lower heat treatment time and temperature avoids the metallic phase formation in sample 5Al-973. The presence of the metallic phase in 5Al-1073 leads to the reduction of the Seebeck coefficient as shown in subsection 3.2. The thermoelectric properties of the samples heat treated at 973 K have been studied and compared with those of the sample heat treated at 1073 K.
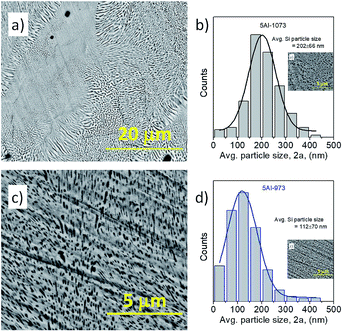 |
| | Fig. 2 BSE images of the sample heat treated at (a) 1073 K for 4 h (5Al-1073) and (b) Si particle distribution, (c) 973 K for 10 h (5Al-973) and (d) Si particle distribution. | |
3.2 Thermoelectric properties of Si/Al doped β-FeSi2
The electrical conductivity (σ) and Seebeck coefficient (S) of the samples are shown in Fig. 3a and b, respectively, as functions of temperature between 300 K and 773 K. Samples 2Al and 5Al stand for the aluminum concentrations x = 0.025 and x = 0.05, respectively, and the suffix denotes the heat treatment temperature of the sample (973 K and 1073 K). The temperature-dependent behavior of σ and S can be explained using the band model, established in ref. 50. The electrical conductivity of the material increases with the carrier concentration (n), whereas S decreases as n increases. Given that the carrier concentration of the composites increases with the Al concentration, the sample 5Al-973 shows higher σ and lower S than 2Al-973. When the samples heat treated at 973 K and 1073 K are compared, they primarily vary in the dispersed Si particle size. Sample 5Al-973 shows a smaller average particle size (Fig. 2b and d) than sample 5Al-1073. This reduction of the particle size might increase the charge carrier scattering at the interfaces, leading to a lower σ of sample 5Al-973 with respect to that of sample 5Al-1073. The increase in the value of S of sample 5Al-973 is significantly higher than the decrease in σ, which can be attributed to the absence of the metallic phase. The σ of the latter sample decreases by 30%, while its S increases by 35%, which leads to an enhancement in the power factor (S2σ).
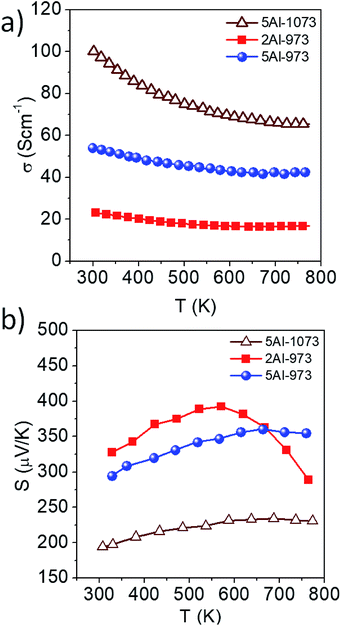 |
| | Fig. 3 Temperature-dependent (a) electrical conductivity and (b) Seebeck coefficient of the samples. | |
The thermal conductivity (κtotal) of the samples measured as a function of temperature between 300 K and 773 K is shown in Fig. 4. The κtotal of all samples decreases as the temperature increases, which confirms the strong Umklapp scattering. The fact that the samples with a higher aluminum content exhibit lower thermal conductivities than the sample with a smaller aluminum content can be attributed to the increase of point defect scattering with aluminum doping. Among the samples synthesized with different heat treatments, the average particle size of silicon is one of the important factors that affect the thermal conductivity of the composite, which decreases as the particle size reduces. A decrease in particle size leads to an increase in the interface density of the composite, which enhances the interface scattering of phonons resulting in a lower κtotal. Sample 5Al-973 shows the lowest thermal conductivity among the measured samples, which can be attributed to the enhanced phonon scattering due to an increased interface density. Furthermore, to investigate the effect of the size of the dispersed silicon particles on the thermal conductivity of Si/Al doped β-FeSi2 composites, we have modeled the effective thermal conductivity using the crowding-factor model, as discussed below.
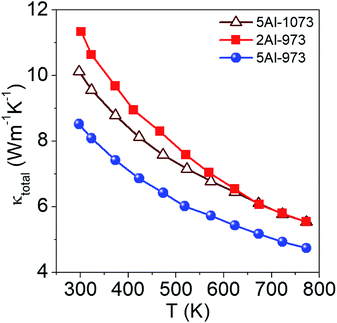 |
| | Fig. 4 Thermal conductivity of the samples as a function of temperature. | |
3.3 Effective thermal conductivity of Si/Al doped β-FeSi2 composites
The effective thermal conductivity of our Si/Al doped β-FeSi2 composites has been calculated using the crowding-factor model, which is suitable for low and high concentrations of particles and takes into account their size, shape and orientation along with interface thermal resistance between the particles and the matrix. Fig. 5 shows the schemes of the carrier–carrier and carrier–particle scattering processes inside the matrix along with the carrier–carrier and carrier–inner surface ones within the particles of the Si/β-FeSi2 composite. Assuming that the Si particles have a random spatial distribution, the effective thermal conductivity k of the composite is given by the crowding factor model,45 as follows:| |  | (1a) |
| |  | (1b) |
| |  | (1c) |
where f0 = 63.7% is the maximum packing fraction of spherical particles, aK = Rkm is the Kapitza radius, and R is the interfacial thermal resistance between the matrix and the particles of radius a. Note that the thermal conductivity of the composite depends equally on the ratios of thermal conductivities (km/kp) and of the normalized Kapitza radius (aK/a). The material properties used for the calculation are given in Table 2. The thermal conductivity of the matrix due to the presence of particles of volume fraction f with radius a has been calculated as given in ref. 53. Similarly, the thermal conductivity of the particles alone with radius a has been calculated and used to derive the effective thermal conductivity of the composite through eqn (1a)–(1c). The interfacial thermal resistance (R) between the β-FeSi2 matrix and the Si particles has been estimated based on the diffuse mismatch model using eqn (2), in which the properties of β-FeSi2 and Si are denoted with subscripts 1 and 2, respectively,54| |  | (2) |
where the phonon transmissivities through the interfaces Td12 = C2v2/(C1v1 + C2v2) and Td21 = C1v1/(C1v1 + C2v2) have been calculated using the input parameters given in Table 2. The interface thermal resistance of the Si/β-FeSi2 thus obtained from eqn (2) is R = 1.23 × 10⁻⁸ m2 K W−1, which is comparable to the known values of the Si/silicide interfacial thermal resistance.55
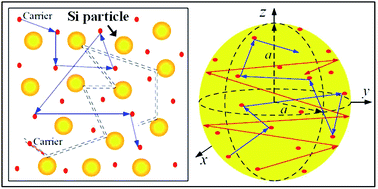 |
| | Fig. 5 Simplified scheme of the scattering processes of the energy carriers inside (left) the matrix and (right) a spherical particle. | |
Table 2 Material properties used in the calculations32,51,52
| Properties |
Values |
| Specific heat of β-FeSi2 (C1) |
2.75 × 10⁶ J m−3 K−1 |
| Specific heat of Si (C2) |
0.93 × 10⁶ J m−3 K−1 |
| Group velocity of β-FeSi2 (ν1) |
5663 m s−1 |
| Group velocity of Si (ν2) |
1804 m s−1 |
| Matrix thermal conductivity (κm) |
15 W m−1 K−1 (for x = 0.025) |
| 11.8 W m−1 K−1 (for x = 0.05) |
| Si particle thermal conductivity (κp) |
150 W m−1 K−1 |
|
f
0
|
63.7% |
The effective thermal conductivities of the composite computed for different volume fractions and average sizes of the silicon particles are reported in Table 3. These theoretical values are in good agreement with the experimentally measured thermal conductivities as shown in Fig. 6a. This indicates that the value of the interface thermal resistance estimated through the diffused mismatch model (DMM) describes quite well the heat conduction through the particle–matrix interface. Furthermore, the estimated R has been used to calculate the thermal conductivity of the composites with various silicon particle sizes as a function of the particle volume fraction. The dispersed silicon particle size and volume fraction have been varied in eqn (1a)–(1c) and the normalized thermal conductivity is shown in Fig. 6b. Note that the thermal conductivity of the composite decreases as the Si particle size reduces, such that it could be reduced to half of the matrix thermal conductivity by decreasing the average particle size at ∼10 nm with ∼50% silicon volume fraction. In general, according to the crowding factor model in eqn (1a)–(1c), the thermal conductivity of the composite becomes smaller than that of the bulk matrix (κ < κm), as long as κm/κp + aK/a > 1, which can be satisfied for an average particle radius smaller than the Kapitza one (a < aK). This relation gives the condition for lowering the thermal conductivity of the composite, and in the case of Si/β-FeSi2, this value of aK is (1.2 × 10⁻⁸) × κm ∼ 240 nm.
Table 3 Sample parameters used for the calculation and the experimental and calculated effective thermal conductivity of the composites
| Sample code |
Si volume fraction (%) |
κ experimental (W m−1 K−1) |
Average particle size, 2a (nm) |
κ calculated (W m−1 K−1) |
| 2Al-973 |
24.8(7) |
11.3 ± 0.6 |
106 ± 080 |
11.7 |
| 2Al-1073 (ref. 38) |
17.9(3) |
13.4 ± 0.5 |
186 ± 063 |
13.1 |
| 5Al-973 |
25.2(3) |
8.9 ± 0.6 |
112 ± 070 |
9.5 |
| 5Al-1073 (ref. 38) |
17.1(4) |
10.06 ± 0.5 |
207 ± 091 |
10.8 |
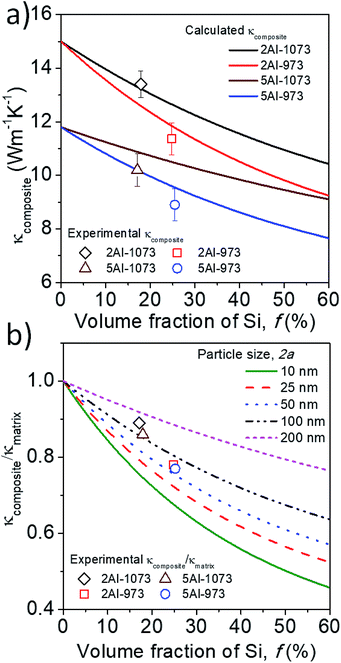 |
| | Fig. 6 (a) Comparison of the calculated thermal conductivity (solid lines) with the experimental (open symbols) thermal conductivity of the samples, (b) normalized thermal conductivity as a function of the Si particle volume fraction, predicted using the crowding factor model for different particle sizes, and normalized experimental thermal conductivity (open symbols). | |
3.4 Power factor and ZT
The power factor (PF = S2σ) of our samples has been estimated using the measured Seebeck coefficient and the electrical conductivity, and its temperature dependence is shown in Fig. 7a. At room temperature, the lowest power factor value of ∼2 μW cm−1 K−2 has been observed for the sample 2Al-973; this is mainly due to the decrease in electrical conductivity. The sample 5Al-973 shows a higher power factor value of ∼4.5 μW cm−1 K−2, which increases to ∼5.4 μW cm−1 K−2 at 773 K. Even though the electrical conductivity of the sample 5Al-973 is lower than that of the sample 5Al-1073, the dominant enhancement in the Seebeck coefficient of the sample 5Al-973 results in the highest power factor among those of all the samples in the measured temperature range. The dimensionless figure of merit (ZT) of the samples has been calculated as ZT= (S2σT/κ) and is shown in Fig. 7b. Sample 2Al-973 shows lower ZT values than those of the other samples in the entire measured temperature range. Although the thermal conductivity of 2Al-973 decreases, the reduction in the PF nullifies the improvement in ZT. The sample 5Al-973 shows the highest ZT = 0.01 at room temperature. The sample 5Al-973 gains advantage from two factors: one is the absence of the metallic phase, which leads to a higher PF than that of the sample heat treated at 1073 K, and the other one is the reduction in the average silicon particle size, which helps in decreasing the thermal conductivity. At 773 K the ZT of the sample 5Al-973 reaches ∼0.09, which is comparable with the existing literature results, as displayed in Table 4. Although the ZT of the composite material is low, the practical advantages of this composite material like thermal and chemical stability in air at high temperature and the cheap and non-toxic nature of the raw materials could outweigh the low thermoelectric performance. Fig. 8 shows the comparison plot of various composite materials and their thermoelectric properties. Our composite samples show a high Seebeck coefficient and comparable thermal conductivity to those of other composite materials; however, the electrical conductivity of the sample 5Al-973 is lower than those of other composite materials. In this study we have theoretically shown that the reduction of thermal conductivity to half of that of the matrix is possible by embedding silicon particles with a size of ∼10 nm and a volume fraction of ∼50%. This size range might also have minimal scattering of charge carriers and enhance the thermoelectric performance. The dispersion of this size range of particles could be achieved through synthesis and processing methods such as chemical synthesis, ball milling and melt spinning. Size reduction with co-doping of the composite with other p-type dopants like B and Mn to optimize the power factor could lead to an enhanced thermoelectric performance of this composite.
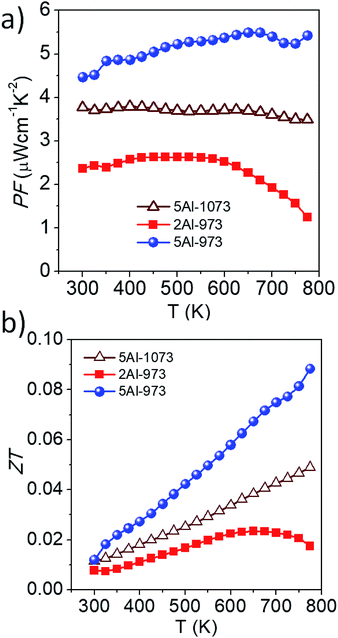 |
| | Fig. 7 Temperature-dependent (a) power factor (PF) and (b) dimensionless figure of merit (ZT) of the samples. | |
Table 4 Comparison of the measured thermoelectric properties with the existing literature values
| Reference |
κ
total (W m−1 K−1) |
PF (μW cm−1 K−2) |
ZT (773 K) |
| FeSi2Al0.1 (ref. 56) |
8 |
7 |
0.069 |
| Si/CoSi2 (ref. 24) |
20 |
31.05 |
0.12 |
| This work |
4.74 |
5.4 |
0.09 |
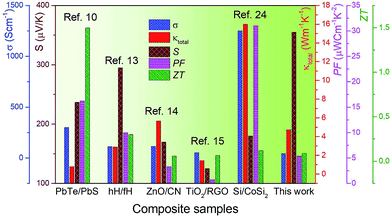 |
| | Fig. 8 Comparison of the thermoelectric properties of various composite materials. | |
4 Conclusion
The effective thermal conductivity of Si/Al doped β-FeSi2 composites with varying silicon particle size has been modeled using the crowding factor model. The interfacial thermal resistance between the matrix and the silicon particles has been calculated using the diffuse mismatch model and verified by means of experimental and calculated thermal conductivity values. It has been shown that silicon particles with a size of ∼10 nm and a volume fraction of ∼50% lead to lowering of the thermal conductivity by half of that of the matrix. The thermoelectric properties of the Si/Al-doped β-FeSi2 composite synthesized at different heat treatment temperatures have also been studied. Lowering the heat treatment temperature decreases the silicon particle size and also restricts the metallic phase formation. This absence of the metallic phase increases the Seebeck coefficient to enhance the power factor, and the decrease in the silicon particle size lowers the thermal conductivity and results in the highest ZT = 0.09 at 773 K.
Conflicts of interest
There are no conflicts to declare.
Acknowledgements
Rajasekar P. acknowledges the University Grants Commission (UGC) for a PhD fellowship. Rajasekar P. thanks CEFIPRA for providing the support to carry out a part of this work in France under the Raman Charpak fellowship. The authors would like to thank Ms. Sireesha Panithi and Prof. Kamanio Chottopadhyay, Materials Engineering, IISc for extending the Seebeck coefficient measurement facility. The authors acknowledge the help of Ms Ananya Banik and Prof. Kanishka Biswas in the thermal conductivity measurements.
References
-
D. M. Rowe, Thermoelectrics handbook: macro to nano, CRC press, 2005 Search PubMed.
- G. J. Snyder and E. S. Toberer, Nat. Mater., 2008, 7, 105–114 CrossRef PubMed.
- M. Zebarjadi, K. Esfarjani, M. Dresselhaus, Z. Ren and G. Chen, Energy Environ. Sci., 2012, 5, 5147–5162 Search PubMed.
-
H. J. Goldsmid, Introduction to thermoelectricity, Springer, 2010, vol. 121 Search PubMed.
- K. Biswas, J. He, I. D. Blum, C.-I. Wu, T. P. Hogan, D. N. Seidman, V. P. Dravid and M. G. Kanatzidis, Nature, 2012, 489, 414–418 CrossRef PubMed.
- B. Poudel, Q. Hao, Y. Ma, Y. Lan, A. Minnich, B. Yu, X. Yan, D. Wang, A. Muto and D. Vashaee,
et al.
, Science, 2008, 320, 634–638 CrossRef PubMed.
- J. Dong, W. Liu, H. Li, X. Su, X. Tang and C. Uher, J. Mater. Chem. A, 2013, 1, 12503–12511 Search PubMed.
- H.-C. Chang, M.-H. Chiang, T.-C. Tsai, T.-H. Chen, W.-T. Whang and C.-H. Chen, Nanoscale, 2014, 6, 14280–14288 RSC.
- J. Kim, K. H. Lee, S.-D. Kim, J.-H. Lim and N. V. Myung, J. Mater. Chem. A, 2018, 6, 349–356 Search PubMed.
- D. Ginting, C.-C. Lin, L. Rathnam, J. H. Yun, B.-K. Yu, S.-J. Kim and J.-S. Rhyee, J. Mater. Chem. A, 2017, 5, 13535–13543 Search PubMed.
- M. Ibáñez, R. Zamani, S. Gorsse, J. Fan, S. Ortega, D. Cadavid, J. R. Morante, J. Arbiol and A. Cabot, ACS Nano, 2013, 7, 2573–2586 CrossRef PubMed.
- J. P. Makongo, D. K. Misra, X. Zhou, A. Pant, M. R. Shabetai, X. Su, C. Uher, K. L. Stokes and P. F. Poudeu, J. Am. Chem. Soc., 2011, 133, 18843–18852 CrossRef PubMed.
- P. Sahoo, Y. Liu, J. P. Makongo, X.-L. Su, S. J. Kim, N. Takas, H. Chi, C. Uher, X. Pan and P. F. Poudeu, Nanoscale, 2013, 5, 9419–9427 RSC.
- W. H. Nam, B. B. Kim, Y. S. Lim, K. S. Dae, W.-S. Seo, H.-H. Park and J. Y. Lee, Nanoscale, 2017, 9, 12941–12948 RSC.
- W. H. Nam, Y. S. Lim, W. Kim, H. K. Seo, K. S. Dae, S. Lee, W.-S. Seo and J. Y. Lee, Nanoscale, 2017, 9, 7830–7838 RSC.
- T. D. Desissa, N. Kanas, S. P. Singh, K. Wiik, M.-A. Einarsrud and T. Norby, Phys. Chem. Chem. Phys., 2018, 20, 2754–2760 RSC.
- K. Zhang, J. Qiu and S. Wang, Nanoscale, 2016, 8, 8033–8041 RSC.
- N. Sani, X. Wang, H. Granberg, P. A. Ersman, X. Crispin, P. Dyreklev, I. Engquist, G. Gustafsson and M. Berggren, Sci. Rep., 2016, 6, 28921 CrossRef PubMed.
- P. V. More, C. Hiragond, A. Dey and P. K. Khanna, Sustainable Energy Fuels, 2017, 1, 1766–1773 Search PubMed.
- U. Ail, Z. U. Khan, H. Granberg, F. Berthold, R. Parasuraman, A. M. Umarji, K. Slettengren, H. Pettersson and X. Crispin, Synth. Met., 2017, 225, 55–63 CrossRef.
- P. Eaksuwanchai, K. Kurosaki, S.-a. Tanusilp, Y. Ohishi, H. Muta and S. Yamanaka, J. Appl. Phys., 2017, 121, 225110 CrossRef.
- D. N. Truong, H. Kleinke and F. Gascoin, Dalton Trans., 2014, 43, 15092–15097 RSC.
- K. Yin, X. Su, Y. Yan, H. Tang, M. G. Kanatzidis, C. Uher and X. Tang, Scr. Mater., 2017, 126, 1–5 CrossRef.
- J. Xie, Y. Ohishi, S. Ichikawa, H. Muta, K. Kurosaki and S. Yamanaka, J. Appl. Phys., 2017, 121, 205107 CrossRef.
- N. Liu, W. A. Jensen, M. Zebarjadi and J. A. Floro, Materials Today Physics, 2018, 4, 19–27 CrossRef.
- S. Perumal, S. Gorsse, U. Ail, M. Prakasam, S. Vivès, R. Decourt and A. M. Umarji, Mater. Lett., 2015, 155, 41–43 CrossRef.
- N. Mingo, D. Hauser, N. Kobayashi, M. Plissonnier and A. Shakouri, Nano Lett., 2009, 9, 711–715 CrossRef PubMed.
- D. Leong, M. Harry, K. Reeson and K. Homewood, Nature, 1997, 387, 686 CrossRef.
- T. Pandey, D. J. Singh, D. Parker and A. K. Singh, J. Appl. Phys., 2013, 114, 153704 CrossRef.
- X. Zhao, H. Chen, E. Müller and C. Drasar, Appl. Phys. A: Mater. Sci. Process., 2005, 80, 1123–1127 CrossRef.
- I. Yamauchi, H. Okamoto, A. Suganuma and I. Ohnaka, J. Mater. Sci., 1998, 33, 385–394 CrossRef.
- H. Chen, X. Zhao, T. Zhu, Y. Lu, H. Ni, E. Müller and A. Mrotzek, Intermetallics, 2005, 13, 704–709 CrossRef.
- H. Chen, X. Zhao, C. Stiewe, D. Platzek and E. Mueller, J. Alloys Compd., 2007, 433, 338–344 CrossRef.
- Z. He, D. Platzek, C. Stiewe, H. Chen, G. Karpinski and E. Müller, J. Alloys Compd., 2007, 438, 303–309 CrossRef.
- M. Ito, H. Nagai, E. Oda, S. Katsuyama and K. Majima, J. Appl. Phys., 2002, 91, 2138–2142 CrossRef.
- M. Ito, T. Tanaka and S. Hara, J. Appl. Phys., 2004, 95, 6209–6215 CrossRef.
- F. L. B. M. Redzuan, I. Mikio and T. Masatoshi, J. Mater. Sci., 2018, 1–8 Search PubMed.
- P. Rajasekar and A. M. Umarji, Intermetallics, 2017, 89, 57–64 CrossRef.
- I. Nishida, K. Masumoto, M.-a. Okamoto and T. Kojima, Trans. Jpn. Inst. Met., 1985, 26, 369–374 CrossRef.
- U. Ail, S. Gorsse, S. Perumal, M. Prakasam, A. Umarji, S. Vivès, P. Bellanger and R. Decourt, J. Mater. Sci., 2015, 50, 6713–6718 CrossRef.
- W. Liu, X. Yan, G. Chen and Z. Ren, Nano Energy, 2012, 1, 42–56 CrossRef.
- S. Xiong and S. Volz, C. R. Phys., 2016, 17, 1146–1153 CrossRef.
- J. Xie, Y. Ohishi, Y. Miyazaki, A. Yusufu, H. Muta, K. Kurosaki and S. Yamanaka, J. Appl. Phys., 2015, 118, 065103 CrossRef.
- W. A. Jensen, N. Liu, E. Rosker, B. F. Donovan, B. Foley, P. E. Hopkins and J. A. Floro, J. Alloys Compd., 2017, 721, 705–711 CrossRef.
- J. Ordonez-Miranda, R. Yang and J. Alvarado-Gil, J. Appl. Phys., 2013, 114, 064306 CrossRef.
- B. H. Toby and R. B. Von Dreele, J. Appl. Crystallogr., 2013, 46, 544–549 CrossRef.
- C. A. Schneider, W. S. Rasband and K. W. Eliceiri,
et al.
, Nat. Methods, 2012, 9, 671–675 CrossRef PubMed.
- M. Doube, M. M. Kłosowski, I. Arganda-Carreras, F. P. Cordelières, R. P. Dougherty, J. S. Jackson, B. Schmid, J. R. Hutchinson and S. J. Shefelbine, Bone, 2010, 47, 1076–1079 CrossRef PubMed.
- N. Krendelsberger, F. Weitzer and J. C. Schuster, Metall. Mater. Trans. A, 2007, 38, 1681–1691 CrossRef.
- U. Birkholz and J. Schelm, Phys. Status Solidi B, 1968, 27, 413–425 CrossRef.
- R. Yang and G. Chen, Phys. Rev. B: Condens. Matter Mater. Phys., 2004, 69, 195316 CrossRef.
- J.-i. Tani, M. Takahashi and H. Kido, Intermetallics, 2010, 18, 1222–1227 CrossRef.
-
J. Ordonez-Miranda, R. Yang and J. J. Alvarado-Gil, in Nanoscale Thermoelectrics, Springer, 2014, pp. 93–139 Search PubMed.
- G. Chen, Phys. Rev. B: Condens. Matter Mater. Phys., 1998, 57, 14958 CrossRef.
- N. Ye, J. P. Feser, S. Sadasivam, T. S. Fisher, T. Wang, C. Ni and A. Janotti, Phys. Rev. B, 2017, 95, 085430 CrossRef.
-
H. Chen, X. Zhao, Z. He, C. Stiewe and E. Muller, 25th International Conference on Thermoelectrics, 2006, pp. 670–673 Search PubMed.
|
| This journal is © The Royal Society of Chemistry 2018 |
Click here to see how this site uses Cookies. View our privacy policy here.  *b and
Arun M.
Umarji
a


