Enhanced storage capability by biomass-derived porous carbon for lithium-ion and sodium-ion battery anodes†
Jian
Hao
 *a,
Yanxia
Wang
a,
Caixia
Chi
b,
Jing
Wang
d,
Qingjie
Guo
a,
Yu
Yang
b,
Yao
Li
 c,
Xiaoxu
Liu
b and
Jiupeng
Zhao
 *b
*b
aState Key Laboratory of High-efficiency Utilization of Coal and Green Chemical Engineering, College of Chemistry & Chemical Engineering, Ningxia University, Yinchuan 750021, China. E-mail: haojian@nxu.edu.cn
bSchool of Chemistry and Chemical Engineering, Harbin Institute of Technology, 150001, Harbin, China
cCenter for Composite Materials, Harbin Institute of Technology, 150001, Harbin, China
dSchool of Light Industry, Harbin University of Commerce, Harbin 150028, China
First published on 2nd September 2018
Abstract
Efficient electrodes with impressive storage capability and fast ion transfer rate are urgently needed to meet the demand for higher energy/power densities and longer life cycles and large rate powering devices. Through a simple freeze-drying and annealing process, nitrogen-containing porous carbon materials with a hierarchical porous structure and enlarged lattice spacing between graphene layers are synthesized. Benefiting from an improvement in the electrochemical activity, porosity, conductive network and mechanical stability, the porous carbon used as anodes for lithium-ion batteries (LIBs) and sodium-ion batteries (SIBs) exhibits an excellent storage capability, rate performance, and cyclability. Apple carbon exhibits a high capacity of 1050 mA h g−1, and celery carbon shows the reversible capacities of 990 mA h g−1 at 0.1 A g−1 after the 200th cycle as LIBs anodes. For SIBs, a high capacity of 438 mA h g−1 is obtained after 200 cycles for apple carbon and 451 mA h g−1 for celery carbon. It is noteworthy that celery carbon shows a capacity retention of 94% between the 50th to 200th cycling. Further analysis on the structure characterization and charging curves reveal that celery carbon has a high N content, dilated intergraphene spacing, and an intrinsically hierarchical porous structure, which are capable of reversibly accumulating sodium ions through surface adsorption and sodium intercalation. Also, the electrochemical impedance spectroscopy (EIS) reveals that celery carbon has a low charge-transfer resistance, the enhanced cyclability and rate performance might be attributed to convenient ion diffusion in the electrode.
Introduction
In parallel with increasing energy and environmental problems, interest in clean and renewable energy materials, as well as their related devices, has spiked in recent years. Rechargeable batteries (lithium-ion batteries (LIBs), sodium-ion batteries (SIBs)), as the main renewable energy supplies, have gained great attention because of their high energy density, and environmental friendliness.1–3 Graphite as the most commonly anode material has been intensively explored in rechargeable batteries and other energy devices, because of its low cost and good electron and ion conductivity, stable structure, lightness, and easy availability.4,5 However, its limited storage capacity (372 mA h g−1 for LIBs6) and rate performance are holding back the development of certain high-tech industries such as electric vehicles and stationary energy storage.7 New carbon and carbon-composite materials are therefore being actively explored for high performance rechargeable batteries. Nanostructured carbon materials due to varying degrees of graphitization, dimensionality and morphologies, extremely large surface accessibility and high electrical conductivity usually offer special electrochemical properties. Novel carbon nanostructures with remarkable physical and chemical properties, such as carbon nanotubes,8,9 graphene10,11 and carbon nanofibers,12,13 have been of particular interest. Porous carbon materials have attracted increasing attention because their special morphology structure could provide a great contribution to enhance the Li (Na) ion storage capacity.14 In searching for advanced anode materials, nanostructured porous carbon shows significant superiority over graphite because the porous nanostructure not only shortens the solid-state diffusion length of ions in the bulk electrode, but also provides large electrode–electrolyte interfaces for rapid charge transfer reactions. Biomass as a porous carbon materials resource has attracted a great deal of attention, because of its low cost, huge availability, rapid regeneration, easy access and environmental friendliness.15 Some biomass has been used as a resource to synthesise porous carbon for electrode materials, such as rice husk16,17 corn straw,18 peanut shells,19,20 banana peel,21 wool,22 coffee shells,23 industrial waste biomass15 and so on. This research indicates that plants with fiber structures are suitable for preparing porous carbon for supercapacitors; carbon materials with low graphitization may be more suitable for Na+ storage; hetero-doping (such as N, B, S and P) can improve the electrochemical performance of porous carbon. The electrochemical performance of porous carbon is influenced by its the surface area, pore size, morphology, electrical conductivity and surface functionality. The intrinsic structure of biomass is the foundation for making its microstructure. Furthermore, the pore size and morphology of porous carbon directly is limited by the intrinsic structure of biomass. The biomass precursor is activated by chemical and physical methods, which allows these materials to be produced with a further higher surface area and with a controlled distribution of pores from nanoscale up to macroscopic dimensions, which actually play the most crucial role towards the construction of efficient electrode/electrolyte interfaces for capacitive processes in energy storage applications. Thus, finding a suitable biomass precursor is the basis for preparing excellent porous carbon electrode materials.In this paper, we used apple (fine fiber) and celery (crude fiber) as precursors though freeze-drying and annealing to synthesis porous carbon to discover the best biomass precursor. The synthesized celery porous carbon with a high N content, hierarchical structure wholly inherits the superior conductivity of traditional graphite. In addition, multi-scale pores and a large interlayer distance significantly improve the ion transporting and charge transfer processes. These porous carbon electrodes utilized as anodes for LIBs and SIBs applications show a high specific capacity, improved cyclability, rate performance and chemical stability, whilst maintaining the porosity and flexibility of the initial substrate. The development of new porous carbon materials could exhibit significant potential in this context and could be motivated by this present work.
Experimental
Preparation of porous carbon
The raw materials were cleaned by deionized water and cut into the appropriate volume, and then the apple blocks and celery blocks were put into a freeze dryer. The dry apple and celery were obtained after freeze drying for 48 h. To prepare the porous carbon, the dry apple and celery were heated to 500 °C for 3 h in a horizontal tube furnace under a high-purity N2 atmosphere. The carbonaceous product was washed with deionized water and ethanol several times to remove the soluble impurities. Finally, porous carbon was obtained after drying.General characterization
The obtained products were subjected to various characterization techniques. The specific surface areas, total pore volume and average pore diameter were determined from N2 adsorption–desorption isotherms at 77 K, using an automated gas sorption system (Quantachrome autosorb IQ). Before each measurement, the sample was degassed under vacuum at 200 °C for 3 h. X-ray diffraction (XRD) measurements were taken with a TD-3500 X-ray powder diffractometer (BRUKER AXS GMBH, D8 ADVANCE A25). X-ray photoelectron spectroscopy (XPS) was performed using a Kratos XSAM 800 spectrometer (Manchester, UK). Field emission scanning electron microscopy (FESEM) was performed with a Hitachi S4800 scanning electron microscope (Tokyo, Japan). Transmission electron microscopy (TEM) and high-resolution transmission electron microscopy (HRTEM) were performed with a FEI Tecnai G2 20 TEM (Hillsboro, OR, USA) operating at 200 kV. Raman spectra were taken with a confocal LabRAM HR800 spectrometer, Thermo Fisher DXR, USA.Electrochemical measurements
The electrochemical behavior of the porous carbon anode materials was evaluated using a coin-type cell (2032 type). To prepare the working electrodes, a mixture of the active materials, acetylene black and poly(vinyl difluoride) (PVDF), at a weight ratio of 80![[thin space (1/6-em)]](https://www.rsc.org/images/entities/char_2009.gif) :
:![[thin space (1/6-em)]](https://www.rsc.org/images/entities/char_2009.gif) 10
10![[thin space (1/6-em)]](https://www.rsc.org/images/entities/char_2009.gif) :
:![[thin space (1/6-em)]](https://www.rsc.org/images/entities/char_2009.gif) 10, was pasted onto a Cu foil. Then the coating film was desiccated in a vacuum chamber at 120 °C for 12 h. The obtained electrodes, with a mass loading of 0.8–1.0 mg cm−2, were assembled in an argon-filled glove box with an oxygen and water vapor pressure less than 0.3 ppm using lithium metal as the counter electrode for the LIBs and sodium plates as the counter electrode for the SIBs. A polypropylene micromembrane was used as the separator for the LIBs, glass fiber (GF/D) from Whatman was used as the separator for the SIBs. 1 M LiPF6 in ethylene carbonate (EC) and diethylcarbonate (DEC) with a weight ratio of 1
10, was pasted onto a Cu foil. Then the coating film was desiccated in a vacuum chamber at 120 °C for 12 h. The obtained electrodes, with a mass loading of 0.8–1.0 mg cm−2, were assembled in an argon-filled glove box with an oxygen and water vapor pressure less than 0.3 ppm using lithium metal as the counter electrode for the LIBs and sodium plates as the counter electrode for the SIBs. A polypropylene micromembrane was used as the separator for the LIBs, glass fiber (GF/D) from Whatman was used as the separator for the SIBs. 1 M LiPF6 in ethylene carbonate (EC) and diethylcarbonate (DEC) with a weight ratio of 1![[thin space (1/6-em)]](https://www.rsc.org/images/entities/char_2009.gif) :
:![[thin space (1/6-em)]](https://www.rsc.org/images/entities/char_2009.gif) 1 (or NaClO4 in ethylene carbonate (EC) and diethylcarbonate (DEC) with a weight ratio of 1
1 (or NaClO4 in ethylene carbonate (EC) and diethylcarbonate (DEC) with a weight ratio of 1![[thin space (1/6-em)]](https://www.rsc.org/images/entities/char_2009.gif) :
:![[thin space (1/6-em)]](https://www.rsc.org/images/entities/char_2009.gif) 1 for the SIBs) was used as the electrolyte. The electrochemical characteristics were examined between 0.01 V and 2.0 V for the LIBs and 0.01–1.5 V for the SIBs. The cyclic voltammograms (CV) were obtained at a scanning rate of 0.1 mV s−1, on a CHI660E electrochemical workstation (Shanghai Chenhua Device Company, China). Electrochemical impedance spectroscopy (EIS) was carried out in the frequency range 0.01–100 kHz at a charged stage with an applied amplitude of 5 mV.
1 for the SIBs) was used as the electrolyte. The electrochemical characteristics were examined between 0.01 V and 2.0 V for the LIBs and 0.01–1.5 V for the SIBs. The cyclic voltammograms (CV) were obtained at a scanning rate of 0.1 mV s−1, on a CHI660E electrochemical workstation (Shanghai Chenhua Device Company, China). Electrochemical impedance spectroscopy (EIS) was carried out in the frequency range 0.01–100 kHz at a charged stage with an applied amplitude of 5 mV.
Results and discussion
Apple and celery were chosen as the raw materials to prepare the porous carbon. Apple is fine and smooth but celery has more crude fibers. This natural structure difference is beneficial to us for the preparation of porous carbon with different pore structures. The scanning electron microscopy (SEM) images reveal that the resulting porous carbons show different morphologies from the precursor. The apple porous carbon retains a macroporous structure with a smooth surface (Fig. 1a and b). Many pores of different diameters produce an amorphous texture, forming an interconnected structure. Celery porous carbon possesses a fluffy structure with many pores, which is helpful for the contact between carbon and the electrolyte (Fig. 1c and d). In contrast, a large number of macropores are revealed to exist inside the celery carbon with different diameters, which can remarkably enhance the active surface area for ion storage (Fig. 1c). Moreover, disordered carbon layers have been found in the HRTEM images for celery carbon (Fig. 1f). Porous carbon with a hierarchical structure facilitates ion diffusion in the bulk electrode materials. The macropores extend into the particles as ion-buffering reservoirs and provide a short diffusion distance to the interior surfaces when they are immersed in the electrolyte, while the mesopores can provide a short ion-transport pathway, with a minimized inner-pore resistance.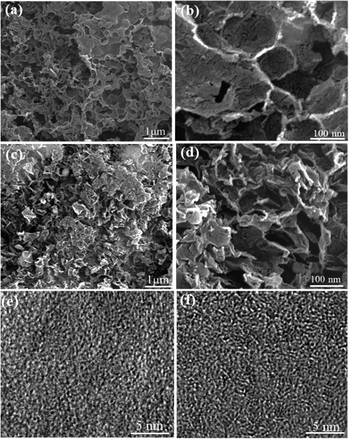 | ||
| Fig. 1 SEM images of (a) apple carbon, (b) apple carbon enlargement image, (c) celery carbon and (d) celery carbon enlargement image, HRTEM images of (e) apple carbon and (f) celery carbon. | ||
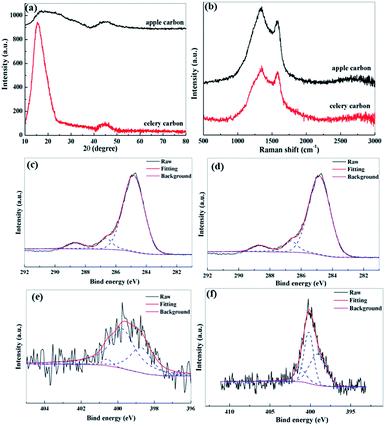
To clarify the crystallographic structures of the porous carbon, X-ray diffraction (XRD) was performed with the as-prepared samples for comparison (Fig. 2a). The XRD pattern of the apple carbon samples shows two broad peaks centered at about 19.2–30.2° and 40.1–50.9°, corresponding to the (002) and (100) planes of graphite respectively. The celery carbon shows a peak at 19.3° and a broad peak at 41.2–51.1°. These results indicate that celery carbon has a crystallographic structure and apple carbon is in an amorphous state. The interlayer spacing d002 is calculated to be 0.41 nm for apple carbon and 0.46 nm for celery carbon according to Bragg's equation, compared to a d-spacing of 0.335 nm for graphite, the observed larger d-spacing for the as-prepared porous carbon samples is important for the insertion/extraction of ions, especially the larger sodium ion.24,25Fig. 2b shows the Raman spectra of the as-prepared samples. Basically, the first-order Raman spectrum of perfectly ordered crystalline carbon would only show one peak at 1582 cm−1, whereas Fig. 2b has two peaks centered at about 1330 cm−1 and 1580 cm−1, respectively, corresponding to a disordered carbon band (D band) and a graphite band (G band). In general, the G band is associated with the vibration mode E2g of the cycle construction developed by the sp2-hybrid carbon atom, and the D band is indicative of the defects and disorder in the structure of the graphite attributed to vibration mode A1g of the electronic structure sp3 in disordered carbon.26 The intensity ratio ID/IG is usually employed to evaluate the amounts of defects.27,28 Clearly, the ID/IG value of apple carbon is 1.35. In contrast, the celery samples produce a less disordered structure with ID/IG ranging 1.02. This result corresponds with the XRD data, and indicates that apple carbon is made up of amorphous carbon, and celery carbon is composed of larger d-spacing graphite and amorphous carbon. The surface chemical compositions of the samples are further identified by the XPS test. From the survey spectra (Fig. S1†), we can see that all the samples exhibit peaks centered at 284.1 eV, 399.8 eV and 533.5 eV, corresponding to C 1s, N 1s and O 1s, respectively. Based on the integrated peak areas, the percentage of chemical composition is summarized in Table S1.† All the samples contain oxygen at about 14 at%. The level of nitrogen content was 2.62 at% for apple carbon, and 5.08 at% for celery carbon. The comparative high-resolution XPS analysis of C 1s, N 1s of the as-prepared samples is shown in Fig. 2c–f. The C 1s peak of all the samples can be decomposed into three components at 284.8 eV, 286.5 eV, and 288.9 eV assigned to the sp2 C–C bond, sp2 C–N bond, and C![[double bond, length as m-dash]](https://www.rsc.org/images/entities/char_e001.gif) O bond, respectively. 29The high-resolution N 1s core level XPS spectra can be divided into three peaks, representing pyridinic N at 398.5 eV, pyrrolic, pyridonic N at 400.1 eV and quaternary N at 401.3 eV. 30,31Celery carbon contains more pyridinic N (43%) than apple carbon (30%) (Table S2†). This is a critical factor in the increase of the electrochemistry performance.
O bond, respectively. 29The high-resolution N 1s core level XPS spectra can be divided into three peaks, representing pyridinic N at 398.5 eV, pyrrolic, pyridonic N at 400.1 eV and quaternary N at 401.3 eV. 30,31Celery carbon contains more pyridinic N (43%) than apple carbon (30%) (Table S2†). This is a critical factor in the increase of the electrochemistry performance.
In order to further understand the pore size details, N2 gas adsorption–desorption measurements were performed and analyzed at 77 K. The single point BET specific surface area obtained is found to be 16 m2 g−1 for apple carbon and 177 m2 g−1 for celery carbon. A steep rise in the nitrogen adsorption isotherms for the samples is also observed at high relative pressures (P/P0 > 0.9) (Fig. 3a), indicating the presence of mesopores and/or macropores in the as-prepared materials. For celery carbon, the hysteresis presented in the adsorption and desorption indicates that it is a type IV isotherm which arises due to the presence of mesopores therein. The pore size distribution obtained from the N2 adsorption–desorption measurements by the DFT method is shown in Fig. 3b. It exhibits that different types of pores are present in the material, the large fraction of pores lies in the range of 10–60 nm, the total pore volume for apple carbon is 0.021 cm3 g−1 and for celery carbon is 0.18 cm3 g−1. The pore density was maximum for the pore size around 20 nm. The size distribution of mesopores ranges between 10 and 30 nm. Indeed, 70% of the pore volume is only due to the mesopores present. Compared with apple carbon, the celery carbon offers an enhanced surface area and excellent pore volume. It can be seen from Fig. 3b that celery carbon has both mesopores and/or macropores, and apple carbon has a less porous structure. Fig. 3b displays the distribution of pores which are mainly several tens of nanometers in diameter, which is consistent with those revealed in the SEM images. This hierarchical porous structure is very important for ion migration and storage.32
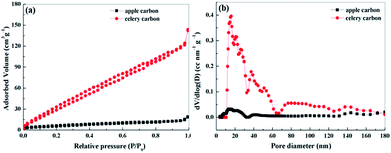 | ||
| Fig. 3 (a) N2 adsorption–desorption isotherms of the apple carbon and celery carbon samples and (b) the pore size distribution of apple carbon and celery carbon samples. | ||
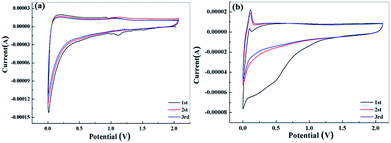
Li-ion storage behavior in the samples was investigated by cyclic voltammetry. Fig. 4 shows the CV curves for apple carbon and celery carbon specimens in the voltage range of 0.01–2.0 V. The reduction peak appeared at ∼1.3 V for apple carbon during the first discharge process and disappeared in the subsequent scans, which is likely ascribed to the irreversible reaction of the electrolyte with surface functional groups. The initial capacity loss can be ascribed to the decomposition of electrolyte and the formation of a solid electrolyte interphase (SEI) layer.33 The reduction peak at 0.4–0.8 V for celery carbon during the first discharge process should be attributed to Li–O superficial bonding featuring irreversible wide peaks and the formation of a SEI layer.29,34 Notably, after the first cycle, the following CV curves almost overlap, indicating that all the biomass carbon electrodes offer good stability and reversibility towards Li-ion storage.
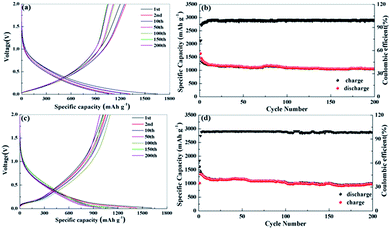
Fig. 5 reproduces the discharge/charge profiles and cycling performance for the obtained biomass carbon electrodes at the current density of 0.1 A g−1. During the first cycle, the apple carbon electrodes deliver specific discharge and charge capacities of 1637 and 1193 mA h g−1 for apple carbon, 1632 and 1046 mA h g−1 for celery carbon, respectively (Fig. 5a and c). The initial coulombic efficiency is 73% for apple carbon and 62% for celery carbon (Fig. 5b and d). The low initial coulombic efficiency is common for high-surface-area carbon materials. The initial capacity loss can be ascribed to the conversion of the carbon electrode from its pristine form to an active lithium storage host; the formation of a SEI layer on the active electrode surface, and/or irreversible lithium insertion into special positions such as in the vicinity of residual H atoms in the carbon material.30 The coulombic efficiency increases rapidly to over 98% after the 10th cycle, indicative of good reaction reversibility and structural stability. After 200 cycles, the reversible capacity of the apple carbon is maintained at 1050 mA h g−1, while the celery carbon electrodes show the reversible capacities of 990 mA h g−1. The capacity retention of apple carbon and celery carbon can reach up to 94% and 87% from the 2nd to the 50th cycle. However, the capacity retention of the both porous carbon samples can reach up to 90% from the 50th to the 200th cycle. These results show that a hierarchical porous structure is beneficial to Li ion insertion and extraction after the activation process.
Fig. 6 shows the capacity at various current densities from 0.074 to 7.4 A g−1. The reversible capacities of apple carbon samples are 1600, 1470, 1260, 1070 and 1000 mA h g−1 at 0.074, 0.185, 0.37, 0.74 and 1.11 A g−1, respectively. Even at the extremely high current densities of 1.85, 3.7 and 7.4 A g−1 (5C, 10C and 20C, 1C = 372 mA g−1), the reversible capacities are still as high as 620, 400 and 270 mA h g−1. For the celery carbon electrode, an excellent rate capability is obtained, e.g., indicated by capacities of 1620 mA h g−1 at 0.074 A g−1, 1288 mA h g−1 at 0.185 A g−1, 1024 mA h g−1at 0.37 A g−1, 930 mA h g−1at 0.74 A g−1 and 850 mA h g−1 at 1.11 A g−1. Note that a reversible capacity of 700 mA h g−1 at 1.85 A g−1, 540 mA h g−1at 3.7 A g−1, and 310 mA h g−1at 7.4 A g−1. At a high rate, the celery carbon electrodes show a higher capacity than apple carbon. Also, when the current goes back to 0.074 A g−1 at the end of rate performance measurements, the capacity recovers to 1334 mA h g−1 for apple carbon and 1522 mA h g−1. The capacity recovery rate is 82% and 93% for apple carbon and celery carbon, respectively. The enhanced rate property of celery carbon can be attributed to a high N content, larger d-spacing and hierarchical porous structure, which is important for the insertion/extraction of Li ions at a high current density.
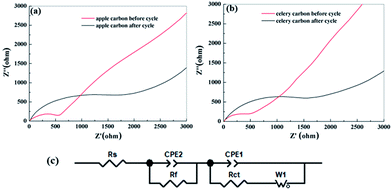
In order to understand this surface-dependent LIB performance, EIS measurements were taken for the as-prepared samples after performing up to 200 cycles at 0.037 A g−1, and the representative Nyquist plots are shown in Fig. 7a and b. Each of the electrodes has a semicircle in the high-medium frequency region and an inclined line in the low frequency region. The high-frequency and medium-frequency semicircles reflect the resistances of the surface film (Rs) and charge-transfer (Rct) which is associated with the charge transfer at the electrode–electrolyte interface, respectively.35,36 Data fitting was performed using the equivalent circuit model shown in Fig. 7c.37 Before the cycling test, the charge-transfer resistance (Rct) of the apple carbon is 304.3 Ω and 117.9 Ω for celery. However, after 200 cycles, the Rct of apple carbon is 398.5 Ω and 247.9 Ω for celery carbon. It can be seen that the apple carbon has a larger Rct than the celery carbon, indicating that a larger d-spacing and higher N-doping content is superior to apple porous carbon in charge transfer. However, after cycling, the structure of both the samples was damaged partly, and the Rct became larger than the initial electrode materials.
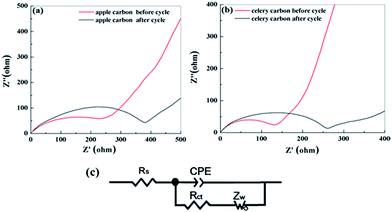 | ||
| Fig. 7 Impedance measurements of apple carbon (a) and celery carbon (b) before cycling and after 200th cycle for LIBs, and (c) the equivalent circuit model used to fit the experimental data. | ||
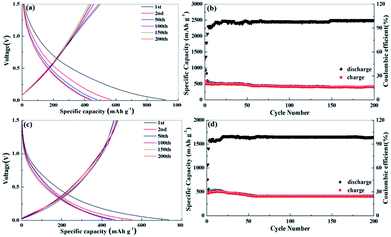
It is well acknowledged that the commonly used commercial graphite anode in today's lithium ion batteries shows a low reversible capacity in sodium ion batteries due to a graphene interlayer spacing that cannot host the larger Na ions. Recent results indicate that the improvement of the electrochemical performance of the carbon anodes for sodium ion batteries strongly depends on their morphology, pore structure, and heteroatom doping. The as-prepared samples have a larger d-spacing of 0.38–0.46 nm and a high N content (5.08% for celery carbon), which is important for the insertion/extraction of larger sodium ions. Fig. 8 reproduces the discharge/charge profiles for the obtained samples at the current density of 50 mA g−1. During the first cycle, the apple carbon electrodes deliver specific discharge and charge capacities of 930 and 500 mA h g−1. For the celery carbon the specific discharge and charge capacities are 711 and 450 mA h g−1, respectively. The initial coulombic efficiency for apple carbon is 53% and for celery carbon is 63%. The coulombic efficiency of the celery carbon electrodes approaches 96% after 10 cycles (Fig. 10b), and a capacity fading is observed in the initial dozens of cycles. A high capacity of 438 mA h g−1 is obtained after 200 cycles for apple carbon and 451 mA h g−1 for celery carbon, with a high coulombic efficiency approaching 100%. The observed capacity fading during cycling can be attributed to the incomplete stabilization of the SEI layer and/or the trapping of sodium ions between the graphite interlayers.38 The capacity retention of apple carbon is 85% from the 50th to the 200th cycle. And for the celery carbon the capacity retention can reach up to 94%. This result indicates the large interlayer space beneficial to insertion of Na ions into parallel layers. This enhancing cyclability could be attributed to the unique structure and morphology of the porous carbon, but also gives a clue for the underlying reasons which will be involved in the following passage.
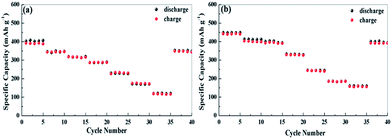
The as-prepared electrode also shows an excellent high rate capability. The rate-dependent capacities are also illustrated in Fig. 9. The cells were discharged and charged at various current densities from 50 mA g−1 to 2 A g−1. The celery carbon demonstrates a higher capacity compared to apple carbon at high current densities. For example, a reversible capacity 410 mA h g−1 for celery carbon (352 mA h g−1 for apple carbon) is achieved at a current density of 0.1 A g−1, 390 mA h g−1 (321 mA h g−1 for apple carbon) at 0.2 A g−1, 330 mA h g−1 (285 mA h g−1 for apple carbon) at 0.3 A g−1, 240 mA h g−1 (230 mA h g−1 for apple carbon) at 0.5 A g−1, 195 mA h g−1 (175 mA h g−1 for apple carbon) at 1 A g−1 and 162 mA h g−1 (116 mA h g−1 for apple carbon) at 2 A g−1. Notably, as the current density returns to 50 mA g−1, the discharge capacity can recover to 395 and 344 mA h g−1 for celery carbon and apple carbon, respectively. The celery carbon demonstrates a higher capacity retention (88%) compared to apple carbon (82%). We compared the initial reversible capacity and rate capability of the as-prepared samples with those of some porous carbon materials as anodes for LIB and SIB, as listed in Table S3.† The electrochemical performance of the as-prepared samples is among that of the most active biomass carbon anode materials.
In order to understand this surface-dependent SIB performance, EIS measurements were taken for the two porous carbon samples before cycling and after performing up to 200 cycles, and the representative Nyquist plots are shown in Fig. 10a and b. It is clear that the diameters of the semicircles of the two samples are similar, which implies that it possesses the highest electrical conductivity and the most rapid charge transfer reaction for Na ion insertion and extraction of all the samples. Data fitting was performed using the equivalent circuit model39,40 shown in Fig. 10c. Before the cycling test, the charge-transfer resistance (Rct) of the apple carbon is 524.1 Ω and 517.6 Ω for celery. However, after 200 cycles, the Rct of apple carbon is 1788.2 Ω and 1569.7 Ω for celery carbon. The increasing of charge transfer resistance with the increase of cycle number indicates a less stable SEI layer formed throughout cycling. Therefore, the formation of a SEI layer can cause a decrease of sodium storage in the active sites, leading to a high capacity loss. On the other hand, the unbalanced electron atmosphere, the interconnected porous structure and a large interlayer spacing of the porous are beneficial for Na ions intercalation and deintercalation, leading to a relatively high coulombic efficiency. It is important to note that this cycling performance can potentially be further improved through the optimization of the electrolyte employed.
 | ||
| Fig. 10 Impedance measurements of apple carbon (a) and celery carbon (b) before cycling and after the 200th cycle for SIBs, and (c) the equivalent circuit model used to fit the experimental data. | ||
The typical SEM images of the as-samples after the 200th cycle for LIBs and SIBs are shown in Fig. S2,† the porous structure edge becomes unclear and forms a carbon film with some traces, but the porous structure still maintains an intact morphology even after 200 cycles. The as-prepared porous carbon electrode shows improved cycling and rate performance both in LIBs and SIBs, especially the celery carbon. The excellent electrochemical performance described herein can be explained by a special interconnected hierarchical porous structure. First, the well-connected porous structure and the macropores serve as ion-buffering reservoirs, mesopores can accelerate the kinetic process of ion diffusion in the electrodes, and facilitate the efficient and smooth ion transportation. Secondly, the large interlayer distance facilitates the transport and storage of sodium ions between graphite layers, which is critical for the larger Na ions. Thirdly, a high N content can afford an unbalanced electron atmosphere beneficial to promoting interactions between the Li (Na) and the carbon network, which enhances the electronic conductivity and electrochemical stability. Fourthly, a hierarchically porous structure not only shortens the transport length of ions, offers a large electrode/electrolyte interface for the charge-transfer reaction, but also offers a large number of active sites for reactions. Lastly, the pores in the carbon can accommodate the volume change during the discharge–charge process.
Conclusions
In summary, we employed apple and celery as a carbon source to prepare hierarchically porous carbon by a facile, economic, and template-free method. With freeze-drying, biomass maintains its original morphology, and we obtained porous carbon samples which both have a large interlayer distance, facilitating the transport and storage of ions, especially the larger Na ion. Apple carbon and celery carbon both exhibit a high specific capacity, long-term stability and excellent rate performance for LIBs. Also, celery carbon shows the best rate performance and cyclability for SIBs, the capacity retention of celery carbon from the 50th to the 200th cycle can reach up to 94%, because of the high surface area and N content, low degree for order and large interlayer distance. The results show that celery (crude fiber plant) is beneficial to gain a large interlayer distance, a high N content and porosity in nano-carbon materials. This approach can be easily industrialized, and could become an effective solution for polluted environments. Given the outstanding electrochemical storage performances and facile preparation strategy, these porous carbons besides application in energy storage, could also be applied in gas adsorption, catalysis, water purification, and other research fields.Conflicts of interest
There are no conflicts to declare.Acknowledgements
We thank the Key Research and Development Program of Ningxia Province of China (No. 2018BEE03012), Natural Science Foundation of Ningxia Province (No. 2018AAC03022), and the National First-rate Discipline Construction Project of Ningxia (Chemical Engineering & Technology, NXYLXK2017A04).Notes and references
- J. F. Peters, M. Baumann, B. Zimmermann, J. Braun and M. Weil, Renewable Sustainable Energy Rev., 2017, 67, 491–506 CrossRef.
- M. A. Hannan, M. S. H. Lipu, A. Hussain and A. Mohamed, Renewable Sustainable Energy Rev., 2017, 78, 834–854 CrossRef.
- Y. Zhao, L. P. Wang, M. T. Sougrati, Z. X. Feng, Y. Leconte, A. Fisher, M. Srinivasan and Z. C. Xu, Adv. Energy Mater., 2017, 7, 1601424 CrossRef.
- M. A. Munoz-Marquez, D. Saurel, J. L. Gomez-Camer, M. Casas-Cabanas, E. Castillo-Martinez and T. Rojo, Adv. Energy Mater., 2017, 7, 1700463 CrossRef.
- X. X. Liu, J. L. Liu, D. Zhan, J. X. Yan, J. Wang, D. L. Chao, L. F. Lai, M. H. Chen, J. H. Yin and Z. X. Shen, RSC Adv., 2013, 3, 11601–11606 RSC.
- L. X. Zeng, R. P. Liu, L. Han, F. Q. Luo, X. Chen, J. B. Wang, Q. R. Qian, Q. H. Chen and M. D. Wei, Chem.–Eur. J., 2018, 24, 4841–4848 CrossRef PubMed.
- J. B. Wang, L. Chen, L. X. Zeng, Q. H. Wei and M. D. Wei, ACS Sustainable Chem. Eng., 2018, 6, 4688–4694 CrossRef.
- S. W. Lee, N. Yabuuchi, B. M. Gallant, S. Chen, B. S. Kim, P. T. Hammond and Y. Shao-Horn, Nat. Nanotechnol., 2010, 5, 531–537 CrossRef PubMed.
- R. N. A. R. Seman, M. A. Azam and A. A. Mohamad, Renewable Sustainable Energy Rev., 2017, 75, 644–659 CrossRef.
- Y. Lu, Y. Y. Lu, Z. Q. Niu and J. Chen, Adv. Energy Mater., 2018, 8, 1702469 CrossRef.
- X. X. Liu, D. L. Chao, D. P. Su, S. K. Liu, L. Chen, C. X. Chi, J. Y. Lin, Z. X. Shen, J. P. Zhao, L. Q. Mai and Y. Li, Nano Energy, 2017, 37, 108–117 CrossRef.
- Z. H. Wang, L. Qie, L. X. Yuan, W. X. Zhang, X. L. Hu and Y. H. Huang, Carbon, 2013, 55, 328–334 CrossRef.
- Y. C. Liu, L. Z. Fan and L. F. Jiao, J. Mater. Chem. A, 2017, 5, 1698–1705 RSC.
- J. H. Kim, M. J. Jung, M. J. Kim and Y. S. Lee, J. Ind. Eng. Chem., 2018, 61, 368–380 CrossRef.
- W. Y. Long, B. Z. Fang, A. Ignaszak, Z. Z. Wu, Y. J. Wang and D. Wilkinson, Chem. Soc. Rev., 2017, 46, 7176–7190 RSC.
- Q. Q. Wang, X. S. Zhu, Y. H. Liu, Y. Y. Fang, X. S. Zhou and J. C. Bao, Carbon, 2018, 127, 658–666 CrossRef.
- D. S. Jung, M. H. Ryou, Y. J. Sung, S. B. Park and J. W. Choi, Proc. Natl. Acad. Sci. U. S. A., 2013, 110, 12229–12234 CrossRef PubMed.
- Y. E. Zhu, H. C. Gu, Y. N. Chen, D. H. Yang, J. P. Wei and Z. Zhou, Ionics, 2018, 24, 1075–1081 CrossRef.
- L. Liu, L. Yang, P. Wang, C. Y. Wang, J. Cheng, G. Zhang, J. J. Gu and F. F. Cao, Int. J. Electrochem. Sci., 2017, 12, 9844–9854 CrossRef.
- W. M. Lv, F. S. Wen, J. Y. Xiang, J. Zhao, L. Li, L. M. Wang, Z. Y. Liu and Y. J. Tian, Electrochim. Acta, 2015, 176, 533–541 CrossRef.
- F. Q. Li, F. R. Qin, K. Zhang, J. Fang, Y. Q. Lai and J. Li, J. Power Sources, 2017, 362, 160–167 CrossRef.
- X. M. Zhu, Q. Li, S. Qiu, X. L. Liu, L. F. Xiao, X. P. Ai, H. X. Yang and Y. L. Cao, JOM, 2016, 68, 2579–2584 CrossRef.
- Y. J. Hwang, S. K. Jeong, K. S. Nahm, J. S. Shin and A. M. Stephan, J. Phys. Chem. Solids, 2007, 68, 182–188 CrossRef.
- S. Qiu, L. F. Xiao, M. L. Sushko, K. S. Han, Y. Y. Shao, M. Y. Yan, X. M. Liang, L. Q. Mai, J. W. Feng, Y. L. Cao, X. P. Ai, H. X. Yang and J. Liu, Adv. Energy Mater., 2017, 7, 1700403 CrossRef.
- P. Z. Wang, X. S. Zhu, Q. Q. Wang, X. Xu, X. S. Zhou and J. C. Bao, J. Mater. Chem. A, 2017, 5, 5761–5769 RSC.
- R. J. Mo, Y. Zhao, M. M. Zhao, M. Wu, C. Wang, J. P. Li, S. Kuga and Y. Huang, Chem. Eng. J., 2018, 346, 104–112 CrossRef.
- L. B. Ma, R. P. Chen, Y. Hu, G. Y. Zhu, T. Chen, H. L. Lu, J. Liang, Z. X. Tie, Z. Jin and J. Liu, Nanoscale, 2016, 8, 17911–17918 RSC.
- A. C. Ferrari and D. M. Basko, Nat. Nanotechnol., 2013, 8, 235–246 CrossRef PubMed.
- H. W. Song, N. Li, H. Cui and C. X. Wang, Nano Energy, 2014, 4, 81–87 CrossRef.
- L. Chen, Y. Z. Zhang, C. H. Lin, W. Yang, Y. Meng, Y. Guo, M. L. Li and D. Xiao, J. Mater. Chem. A, 2014, 2, 9684–9690 RSC.
- G. Y. Xu, J. P. Han, B. Ding, P. Nie, J. Pan, H. Dou, H. S. Li and X. G. Zhang, Green Chem., 2015, 17, 1668–1674 RSC.
- J. B. Wang, Z. W. Liu, W. J. Yang, L. J. Han and M. D. Wei, Chem. Commun., 2018, 54, 7346–7349 RSC.
- Z. M. Zheng, X. Zhang, F. Pei, Y. Dai, X. L. Fang, T. H. Wang and N. F. Zheng, J. Mater. Chem. A, 2015, 3, 19800–19806 RSC.
- Z. Li, Z. W. Xu, X. H. Tan, H. L. Wang, C. M. B. Holt, T. Stephenson, B. C. Olsen and D. Mitlin, Energy Environ. Sci., 2013, 6, 871–878 RSC.
- D. W. Zhang, G. Wang, L. Xu, J. B. Lian, J. Bao, Y. Zhao, J. X. Qiu and H. M. Li, Appl. Surf. Sci., 2018, 451, 298–305 CrossRef.
- H. H. Ru, N. B. Bai, K. X. Xiang, W. Zhou, H. Chen and X. S. Zhao, Electrochim. Acta, 2016, 194, 10–16 CrossRef.
- Y. Z. Sun, G. Q. Ning, C. L. Qi, J. C. Li, X. L. Ma, C. G. Xu, Y. F. Li, X. Zhang and J. S. Gao, Electrochim. Acta, 2016, 190, 141–149 CrossRef.
- Y. Yan, Y. X. Yin, Y. G. Guo and L. J. Wan, Adv. Energy Mater., 2014, 4, 1301584 CrossRef.
- C. Zheng, M. Y. Liu, W. Q. Chen, L. X. Zeng and M. D. Wei, J. Mater. Chem. A, 2016, 4, 13646–13651 RSC.
- C. Zheng, C. R. Chen, L. Chen and M. D. Wei, J. Mater. Chem. A, 2017, 5, 19632–19638 RSC.
Footnote |
| † Electronic supplementary information (ESI) available: XPS dates, and the comparison of electrochemical performance of porous carbon materials for LIBs and SIBs, SEM images of as-samples after 200th cycle for LIBs and SIBs. See DOI: 10.1039/c8se00353j |
| This journal is © The Royal Society of Chemistry 2018 |

