The thermoelectrochemistry of the aqueous iron(II)/iron(III) redox couple: significance of the anion and pH in thermogalvanic thermal-to-electrical energy conversion†
Mark A.
Buckingham
 a,
Frank
Marken
 b and
Leigh
Aldous
 *a
*a
aDepartment of Chemistry, Britannia House, King's College London, London, SE1 1DB, UK. E-mail: leigh.aldous@kcl.ac.uk
bDepartment of Chemistry, University of Bath, Claverton Down, Bath BA2 7AY, UK
First published on 1st October 2018
Abstract
Thermogalvanic conversion of temperature gradients into electricity via a redox couple represents a potential method of waste energy harvesting, but inexpensive, effective and sustainable redox couples are required. In this study four aqueous Fe(II)/Fe(III) salt systems are considered, based upon ammonium iron sulphate, iron sulphate, iron trifluoromethanesulfonate and iron nitrate. A range of Seebeck coefficients were observed, from +0.18 ± 0.04 mV K−1 for ammonium iron(II/III) sulphate to +1.46 ± 0.02 mV K−1 for acidified iron(II/III) trifluoromethanesulfonate, both at a temperature difference of 20 K; notably these apparent Seebeck coefficients vary with temperature difference due to significant chemical equilibria. The iron(II/III) nitrate system generated the highest thermogalvanic power output. The systems were probed by cyclic voltammetry, pH, UV-Vis spectroscopy and electrochemical impedance spectroscopy, and two competing mechanisms noted, which strongly affect both the current output and Seebeck coefficient (i.e. potential output) of their thermoelectrochemical cells (or thermocells). Green and economic consideration are important aspects if these systems are to be employed in harvesting low-grade heat energy at a larger scale; iron nitrate and acidified iron sulphate were the most highly competitive systems.
Introduction
Temperature gradients can be converted directly into a flow of current (i.e. electricity) using the Seebeck effect; this corresponds primarily to conductors and semi-conductors.1 A similar outcome can also be achieved using ‘thermoelectrochemistry’, whereby two electrodes at dissimilar temperatures and sharing a common redox active electrolyte results in a potential difference; connecting the electrodes results in a corresponding flow of thermogalvanic current.1,2 The temperature dependence of the electrode potential is a fundamental parameter,3 but is frequently referred to as the ‘Seebeck coefficient’, or Se, when discussed in the context of thermogalvanic conversion of temperature gradients to power.1 In both cases, the thermodynamic driving force is the difference in entropy between the two halves of the redox couple, ΔSrc, and the temperature difference, ΔT, such that:Devices that exploit this are frequently referred to as liquid thermoelectrics,4,5 thermoelectrochemical cells (thermocells)5,6 or thermogalvanic cells.1,2,4 The majority of systems have used aqueous electrolytes, with some exceptions.4 While some systems have used metals and their ions for the redox couple, such as Li+|Li0 couple6,7 and Cu2+|Cu0 couple,8,9 most use two soluble redox states. In this context, the potassium ferricyanide/ferrocyanide (K3Fe(CN)6/K4Fe(CN)6) redox couple is arguably the most extensively reported system, with aqueous Se values of ca. −1.4 mV K−1.1,2,10
Given the low potential generated by individual thermoelectrochemical cells, a solution is to combine multiple cells electrically in-series to increase the potential output. However, the need to avoid a thermal short circuit means that alternating cells should ideally have opposite signs for their Se, so they can be arranged electrically in-series but thermally in-parallel; Al Maimani et al. reported the first detailed study of such liquid-based in-series system, using ferricyanide/ferrocyanide cells in-series with iron(II/III) sulphate cells.5 Yang et al. also reported a similar system but using gelled electrolytes, and connecting ferricyanide/ferrocyanide cells in-series with iron(II/III) chloride cells.10 In both studies the iron(II/III) cells were inferior to the ferricyanide/ferrocyanide cells.
Therefore iron(II/III) systems with positive Se values are highly desirable, but these have not been investigated in detail. Fundamental work has been performed on measuring the ΔSrc (and therefore Se) of redox couples, but only at mM or μM levels.11 The aqueous Se of Fe2+/Fe3+ was reported as ca. +1.8 mV K−1,11 but only at ionic strength values below 0.2 M; above this the Se rapidly dropped. Conversely, high power thermogalvanic devices require more concentrated systems (i.e. concentrations >1 M; ionic strengths frequently >3 M).5 The theoretical Se for Fe2+/Fe3+ in water (calculated under standard conditions and in the absence of anions) has been reported as +1.175 mV K−1.3
Regarding the thermoelectrochemistry of aqueous iron(II/III) chloride systems, Burrows reported a Se of +0.6 mV K−1 for aqueous FeCl2/FeCl3 in the presence of HCl.2 Later, Yang et al. reported an Se of +1.02 mV K−1 for aqueous FeCl2/FeCl3 immobilised in PVDF with 10 w/w% HCl (up to ΔT = 20 °C).10 In ionic liquids, the chloride-based [FeCl4]2−/[FeCl4]− redox couple does not dissociate, and leads to an inverted Se of −0.48 ± 0.02 mV K−1.12
Regarding the thermoelectrochemistry of iron(II/III) sulphate systems, Al Maimani et al. reported Se values in the range of +0.24 to +0.40 mV K−1 (from 1.4 M Fe2+/1.4 M Fe3+ to 0.0014 M Fe2+/0.0014 M Fe3+, respectively), which could be increased to +0.54 mV K−1 with the addition of H2SO4 (all at ΔT = 50 °C).5 Later, Zhang et al. reported a Se of +0.5 mV K−1 for aqueous 0.25 M FeSO4/0.25 M Fe[SO4]1.5 for a ΔT of approximately 21 °C, without acidification.13
A range of iron(II/III) systems have also been investigated in other systems, such as a range of ionic liquids.12,14 The thermoelectrochemistry of a number of ferrocene/ferrocenium-based systems have been reported, all in ionic liquids, with Se values ranging from −0.088 ± 0.02 mV K−1 to +1.67 ± 0.05 mV K−1.12,14–16 The ‘un-complexed’ Fe2+/Fe3+ system, investigated as their [NTf2]−-based salts in an [NTf2]−-based ionic liquid, gave an Se of +0.96 ± 0.04 mV K−1.12
Therefore the Se for aqueous Fe2+/Fe3+ is expected to reach between ca. +1.2 mV K−1 (ref. 3) and ca. +1.8 mV K−1.11 To date, experimentally reported Se values (for aqueous Fe(II)/Fe(III) salts) have fallen between +0.24 mV K−1 5 and +1 mV K−1.10 The pH is clearly influential,5 but, to the best of our knowledge, the nature of the anion has never been investigated in detail (in the context of thermogalvanic cells). Therefore this study reports an in-depth (thermo)electrochemical and spectroscopic study of four different aqueous Fe(II)/Fe(III) systems, with a record high Se of +1.46 ± 0.02 mV K−1 ultimately achieved for acidified Fe(II)/Fe(III) trifluoromethylsulfonate salts. The highly significant nature of the anion and pH is investigated. Preliminary comparisons of the economic and ‘green’ credentials are also evaluated, in the context of sustainable chemistry.
Experimental
Chemicals
All reagents were purchased from UK suppliers and were used as received, unless otherwise specified. These were ammonium iron(II) sulfate hexahydrate (≥98%, Sigma Aldrich), ammonium Iron(III) sulfate dodecahydrate (≥99%, Sigma Aldrich), iron(III) nitrate nonahydrate (≥99.95%, Sigma Aldrich), iron(II) sulfate heptahydrate (99%, Acros Organics), iron(III) sulfate pentahydrate (97%, Acros Organics), iron(II) trifluoromethanesulfonate (≥85%, Sigma Aldrich), iron(III) trifluoromethanesulfonate (90%, Sigma Aldrich), nitric Acid (70%, Fisher Scientific), sulfuric acid (1 M volumetric standard, Honeywell), trifluoromethanesulfonic acid (98+%, Alfa Aesar).Synthesis of iron(II) nitrate
Since iron(II) dinitrate was not commercially available, it was synthesised in situ by preparing an aqueous solution containing 0.2 M iron(II) chloride tetrahydrate (≥98%, Honeywell) and 0.4 M silver nitrate (99.5%, Acros Organics). This was stirred overnight until metathesis was complete, and the solution filtered using an Sartorius biotech Minisart® syringe filter to remove the silver chloride precipitate, to yield an aqueous solution of 0.2 M iron(II) nitrate; cyclic voltammetry was used to confirm the absence of residual silver. Subsequently solid iron(III) nitrate was dissolved to form a mixture of 0.2 M iron(II) nitrate and 0.2 M iron(III) nitrate, which was used directly. Since iron(II) nitrate is known to slowly decompose,17 these solutions were prepared immediately before use.Thermoelectrochemistry
The thermoelectrochemical cell consisted of a nylon 6,6 cylinder with an outer diameter of 18 mm, an inner diameter of 8 mm and a length of 8 mm (RS Components Ltd, UK). A machine cut lip 0.5 mm deep and 10 mm in diameter was introduced at either end using a Roland Modela MDX-40 CNC milling machine. Materials were machined using square-end mills between 1 and 3 mm in diameter. Into these were inserted two solid gold electrodes (1 mm thick discs with 10 mm diameter, from Surepure Chemetals, USA). The hollow cylinder was therefore filled with ca. 0.6 ml of electrolyte, and the gold electrodes were ca. 200 mm2 and separated by 7 mm. Temperature control was maintained by directly contacting the gold discs with copper heat exchangers connected to RS-TX150 thermostatic circulator baths (Grant Instruments Ltd, UK). All measurements were made with the cell and electrodes arranged horizontally (cf.ref. 8). All potential and current measurements were performed using a Keysight B2901A Source Measure Unit (Keysight, UK). Current output was measured by setting a load resistance such that a constant pre-determined potential was generated, and the current output recorded for 10 minutes. Steady state output was achieved within a matter of seconds (Fig. S2(a) and (b)†); the reported values are the average of the steady state current values recorded from 5 to 10 minutes.Cyclic voltammetry
Cyclic voltammetric experiments were carried out using a PGSTAT 302N and NOVA software (Metrohm Autolab, the Netherlands). The electrochemical setup was an 1.6 mm diameter Au disc working electrode and a Pt wire counter electrode, vs. an Ag/AgCl (3 M NaCl) reference electrode (all BASi, USA), at a scan rate of 50 mV s−1. All solutions contained 0.2 M of the Fe(II) salt and 0.2 M of the Fe(III) salt, in both the presence and absence of 1 M of the conjugate acid; no other supporting electrolyte was employed.Electrochemical impedance
Electrochemical impedance was performed on solutions of 0.2 M of both Fe(III) and Fe(II) in the presence and absence of 1 M conjugate acid in the same setup as thermoelectrochemical measurements in the absence of supporting electrolyte. The impedance measurements were performed by a Solartron 1286/1250 system with Zplot/Zview software (Solartron, UK). The impedance spectra were obtained at the equilibrium potential with a frequency range from 50![[thin space (1/6-em)]](https://www.rsc.org/images/entities/char_2009.gif) 000 Hz to 1 Hz and with an amplitude of 20 mV.
000 Hz to 1 Hz and with an amplitude of 20 mV.
UV-Vis spectroscopy
UV-Vis spectroscopy was performed using a Cary 100 UV-Vis and WinUV software (Agilent, UK) between 200–800 nm and with a UV-Vis crossover wavelength of 400 nm, using either ambient temperature (ca. 25 °C) or an integrated Peltier temperature control block. Quartz cuvettes with a path length of 100 μm were used (FireflySci, USA). All spectrums were obtained using solutions containing 0.02 M of the Fe(II) salt and/or 0.02 M of the Fe(III) salt, in the presence and absence of 0.1 M of the conjugate acid.pH measurement
The pH was measured using a digital pH meter (SciQuip Benchtop 9 Series pH and conductivity meter, SciQuip, UK). It was measured at ambient temperatures for solutions containing 0.2 M of the Fe(II) salt or 0.2 M Fe(III) salt, or both, in the presence and absence of 1 M of the conjugate acid.Results and discussion
Seebeck coefficient and entropy of a range of iron salts
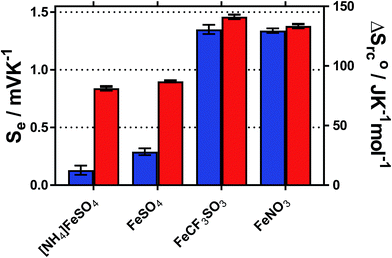
The temperature coefficient of the electrode potential, or apparent Seebeck coefficient (Se) of four distinct Fe(II)/Fe(III) redox couples were first measured using non-isothermal thermoelectrochemical measurements, using 0.2 M of each redox state (total [Fe ion] = 0.4 M). Given the complex stoichiometry of the solid precursors, the [NH4]2Fe(II)[SO4]2/[NH4]Fe(III)[SO4]2 redox couple will be referred to in the simplified form ‘[NH4]FeSO4’, the Fe(II)SO4/Fe(III)[SO4]1.5 as ‘FeSO4’, the Fe(II)[NO3]2/Fe(III)[NO3]3 as ‘FeNO3’, and the Fe(II)[CF3SO3]2/Fe(III)[CF3SO3]3 as ‘FeCF3SO3’. All were purchased as salts, with the exception of Fe(II)[NO3]2, which was prepared in situ, as described in the Experimental section. Attempts were made to measure the Fe(II)Cl2/Fe(III)Cl3 system, but stable results could not be obtained.Initially the Se of all systems were measured at ΔT = 20 °C (Tcold = 15 °C, Thot = 35 °C, as a temperature range to represent exploiting waste radiative body heat18). The resulting values are summarised visually in Fig. 1, and are tabulated in the Table S1.† Notably, the Se varied significantly, from +0.18 ± 0.04 mV K−1 for [NH4]FeSO4 up to +1.35 ± 0.04 mV K−1 for FeNO3; nearly an 8-fold difference.
Addition of 1 M of the conjugate acid of the anion to the systems resulted in significant increases in the Se for both [SO4]2−-based systems, and the [NH4]FeSO4 increased up to +0.84 ± 0.02 mV K−1; nearly a 5-fold increase. Acid addition resulted in only a minor increase in the Se of the FeNO3 and FeCF3SO3 systems (by up to 0.11 mV K−1). Notably these systems have comparable Se values (of inverted sign) to the Se value of the ca. −1.4 mV K−1 widely reported for the [Fe(CN)6]4−/[Fe(CN6)]3− system,1,19 although comparable Se values are not actually required to combine such systems electrically in-series.5
A maximum Se value of ca. +1.8 mV K−1 was reported for the Fe2+/Fe3+ redox system by Weaver et al.,20 but this only applied for ionic strength values <0.2 M, which is equivalent to <17 mM of the FeSO4 system. Above this ionic strength value the Se value was reported to decrease.
Typically the Se value should be independent of the temperature difference,1 unless temperature-dependant equilibria is present.15 For [NH4]FeSO4 a Se of +0.18 mV K−1 was measured when ΔT = 20 °C, but this decreased to a Se of +0.08 mV K−1 at ΔT = 5 °C, as shown in Fig. 2(a); this highlights significant temperature-dependent dynamics were present in this system, and our use of the term ‘apparent Seebeck coefficient’. The Se of all the other systems (including acidified [NH4]FeSO4 in the presence of 1 M H2SO4) varied no more than 0.04 mV K−1 between ΔT = 5 °C and ΔT = 20 °C, as highlighted in Fig. 2(b) by the [NH4]FeSO4 and FeNO3 systems (representative raw data shown in Fig. S1 in ESI†).
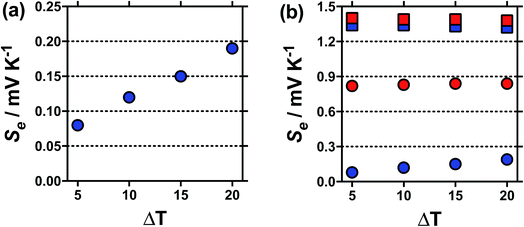 | ||
Fig. 2 Plots showing the variation in the apparent Seebeck coefficient, Se, against ΔT (Thot = 35 °C, Tcold = 15 to 30 °C), for (a)  un-acidified [NH4]FeSO4 system, and (b) un-acidified [NH4]FeSO4 system, and (b)  and and  for the un-acidified and acidified [NH4]FeSO4 systems, respectively and for the un-acidified and acidified [NH4]FeSO4 systems, respectively and  and and  for the un-acidified and acidified FeNO3 systems, respectively; all other conditions match those in Fig. 1. The high temperature sensitivity of the apparent Se of the un-acidified [NH4]FeSO4 system against ΔT is immediately apparent, as is the relatively more minor variations in the other three systems. for the un-acidified and acidified FeNO3 systems, respectively; all other conditions match those in Fig. 1. The high temperature sensitivity of the apparent Se of the un-acidified [NH4]FeSO4 system against ΔT is immediately apparent, as is the relatively more minor variations in the other three systems. | ||
The trend in Se values across the redox couples can be rationalised in terms of acid–base equilibrium and ion pairing. The size and valence of the redox centre is highly influential in determining the Se value,16 and an ideal Fe2+ and Fe3+ redox couple is expected to have a high Se value by virtue of their small size and high ionic charge.11 However, it's well established that such iron salts undergo association with water and anions which will reduce their overall charge and therefore their redox entropy change;11 this is especially true with Fe3+ and anions such as [SO4]2−, which can even form oligomeric [Fe(SO4)n]3−2n complexes.21 The first step of these two competing equilibria are exemplified below using Fe3+ and [SO4]2−;
| [Fe(H2O)6)]3+ ⇆ [Fe(OH)(H2O)5]2+ + H+ | (1) |
| Fe3+ + [SO4]2− ⇆ [FeSO4]+ | (2) |
Both equilibria would be expected to demonstrate temperature dependence, as was experimentally observed here. For process (1), a decrease in pH would encourage more hexaaqua Fe3+ to be present (as opposed to species such as [Fe(OH)]2+)22 which would be reflected by an increase in the Se value, as was observed experimentally for all systems. For process (2), this is highly anion dependant, with decreasing degrees of ion pairing expected to follow the trend [SO4]2− ≫ [HSO4]− > [NO3]− ∼ [CF3SO3]− (based upon values published for iron solutions21 and lanthanide salts23). It is notable that this trend also matches the experimentally observed trend in Se. Additionally, acidification is not expected to influence [NO3]− and [CF3SO3]−, given the pKa values of their conjugate acids are below that of water (−1.3 (ref. 24) and −14.0,25 respectively), whereas acidification of [SO4]2− with an excess of H2SO4 would generate two [HSO4]− (pKa of [HSO4]− = +2);24 this would reduce ion pairing and thus increase the Se value. Once again, this was also experimentally observed. Therefore measurements aimed at probing the relative contributions of processes (1) and (2) are discussed below.
pH and proton concentration
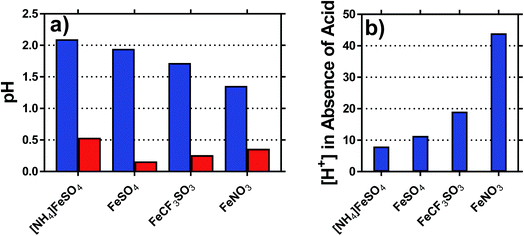
The pH of each solution was measured, for solutions containing 0.2 M of both the Fe(II) salt and Fe(III) salt, in the presence and absence of acid; the results are summarised in Fig. 3(a). The inherent acidity of the iron solutions all fell within the pH range of ca. 1.75 ± 0.35; measuring the pH of the Fe(II) and Fe(III) salts separately demonstrated that the Fe(III) salts were responsible for at least 10-fold more inherent acidity (>1 pH unit lower) than the Fe(II) salts.The concentration of acidic protons were calculated from the pH, and are shown in Fig. 3(b). Notably, higher Se values correlated with higher inherent proton concentrations; this is initially counterintuitive, since process (1) should reduce Se. However, it is likely that process (1) and (2) are in competition, and therefore process (2) dominates for the [SO4]2− systems; the higher valence of [SO4]2− relative to [OH]− will result in a proportionately lower Se, as was observed. This also explains why [NH4]FeSO4 had a lower Se than FeSO4, since the as prepared mixed valence solution of the former contained 2 [SO4]2− per iron ion, whereas the latter contained only 1.25 [SO4]2− per iron ion.
The highest concentration of protons observed corresponded to 45 mM for the FeNO3 system, or ca. 23% of the 200 mM Fe(III) present. This has two implications; first is that the majority of species present are expected to be hydrated species (cf. [Fe(H2O)6]3+), but process (1) will remove a significant minority of these species (e.g. as [Fe(OH)(H2O)5]2+). The second is that since process (1) only influences the minority of redox-active species across the systems, process (2) is assumed to dominate the overall Se trend observed. This was further probed spectroscopically.
UV-Vis spectroscopy
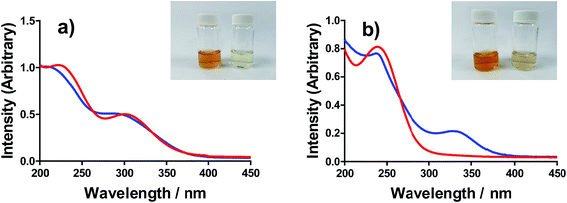
All of the solutions containing 400 mM iron were strongly coloured, and changed significantly upon acidification; this is shown visually by the inserts in Fig. 4, for (a) FeSO4, and (b) FeCF3SO3. UV-Vis spectra demonstrated that this was almost entirely due to the Fe(III) salts, since none of the Fe(II) salts demonstrated appreciable absorption features Fig. S3;† the exception was the nitrate salts, where absorbance of the [NO3]− dominated both Fe(II) and Fe(III) features Fig. S3.†The UV-Vis spectra of solutions containing both 20 mM Fe(II) and 20 mM Fe(III) salts were investigated as a function of added acid (0 mM and 100 mM of the conjugate acid) and temperature (5 °C to 35 °C); all significant spectral features correspond to the Fe(III) species.‡ All four iron systems displayed broad peaks centred on ca. 240 nm, which has been previously attributed to [Fe(H2O)6]3+.22 Absorption features at higher wavelengths have been attributed to complexes of Fe(III), such as [Fe(OH)]2+;22 in our results FeSO4 had an additional feature at ca. 300 nm (Fig. 4(a)), as did [NH4]FeSO4 (Fig. S3(D)†). Conversely, FeCF3SO3 had an additional absorption peak at ca. 340 nm (Fig. 4(b)), as did FeNO3 (Fig. S3(C)†). Addition of acid resulted in a sharpening of all peaks, consistent with a shift in a dynamic equilibrium, and in the case of FeCF3SO3 and FeNO3 resulted in the complete loss of the absorption peak at ca. 340 nm (Fig. 4(b) and Fig. S3(C),† respectively).
This allows us to conclude that the peak at ca. 340 nm corresponds to complex ions associated with process (1), such as [Fe(OH)(H2O)5]2+; acidification with HCF3SO3 or HNO3 shifts this equilibrium entirely to the left (to [Fe(H2O)6]3+), resulting in the disappearance of this peak.
Upon acidification of FeSO4 and [NH4]FeSO4 the feature at ca. 300 nm (in the 20 mM sample) shifted slightly but did not otherwise change. This initial peak likely corresponds to species formed by process (2), such as [FeSO4]+; addition of a significant excess of H2SO4 failed to remove these adducts, and instead they likely persisted as [FeHSO4]2+ salts. Notably, since the extinction coefficients of these species are unknown, but are known to vary widely for different Fe(III)-adducts,22 these results cannot be taken as quantitative. Such ion pairing interactions are also expected to be extremely concentration sensitive, given that acidification clearly had a more significant effect upon the 200 mM sample (shown in the insert in Fig. 4(a)).
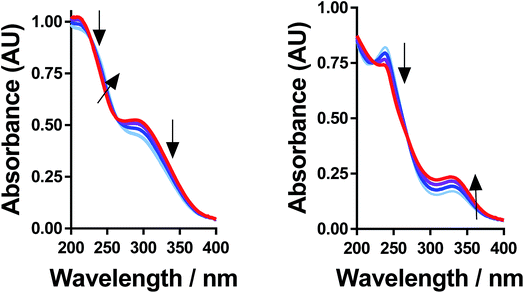
Further evidence that the different peaks found for FeSO4 and FeCF3SO3 correspond to different processes was demonstrated by variable-temperature UV-Vis. Fig. 5 displays UV-Vis spectra for these two systems measured between 5 °C and 35 °C; ion pairing (i.e. process (2)) would be expected to decrease with an increase in temperature, while acid–base dissociation (i.e. process (1)) would be expected to increase. In line with these expectations, the peak at ca. 300 nm for FeSO4 decreased with increasing temperature, while the peak at ca. 340 nm for FeCF3SO3 increased. Furthermore, this temperature-sensitive equilibrium explains the significant temperature-dependence observed for the Seebeck coefficient of [NH4]FeSO4 (cf.Fig. 2(a)), and the minor variation observed for the other systems.
Thermogalvanic power generation
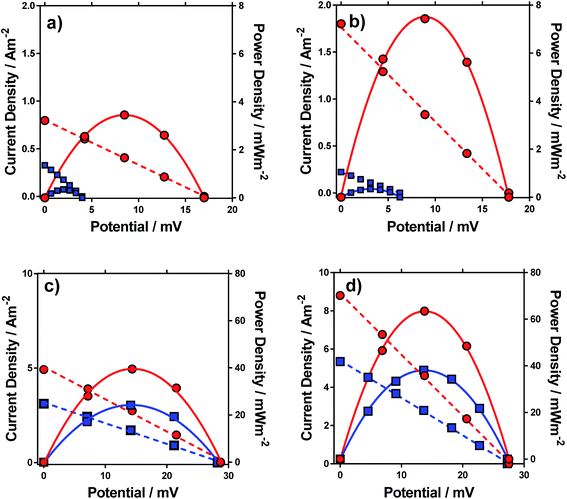
Having characterised the properties of the systems, the thermogalvanic power produced by these redox systems were also measured at ΔT = 20 °C. Fig. 6 displays the power curves for the four systems, in the presence and absence of acid. The potential generated matched the trends observed for the Se, as would be expected. The addition of acid can be seen to significantly increase the power density for all four systems (Fig. 6).The power curves for both FeSO4 and [NH4]FeSO4 were strongly altered by the addition of acid; the increased potential leads to increased current and power, since the potential represents the thermodynamic driving force behind the process,1 and acid-addition resulted in ca. 10 and 20-fold increases in the power output for the [NH4]FeSO4 and FeSO4 systems, respectively. Conversely, for FeNO3 and FeCF3SO3, addition of acid had a minor effect upon the Se but increased current by ca. 60% and 65% respectively, resulting in a ca. 60% and 65% increase in power output respectively.
In the case of FeSO4 and [NH4]FeSO4, these systems are dominated by the ion pairing expressed by process (2). Acidification therefore removes the [SO4]2− (by forming two [HSO4]−), and this acidification results in dramatic increases in the thermodynamic driving force (expressed as the Se) by repressing process (2) and therefore the significant boost in power output shown in Fig. 6. In the case of FeNO3 and FeCF3SO3 process (2) is negligible and instead ca 10–20% of the Fe(III) salt is expected to have undergone process (1) (cf.Fig. 3(b)). The reduced inherent Se of [Fe(OH)(H2O)5]2+ (relative to [Fe(H2O)6]3+) indicates these species would not have contributed significant current during thermogalvanic power generation. Since addition of acid removes these (cf.Fig. 4(b)) this correlates with more thermogalvanically active species and therefore higher current, as seen experimentally.
It is important to note the scales on the power axis in Fig. 6, which are an order of magnitude higher for FeNO3 and FeCF3SO3 than for FeSO4 and [NH4]FeSO4, highlighting the extremely significant role of the anion in thermogalvanic power generation. Interestingly, FeNO3 resulted in a higher power output than FeCF3SO3, which could not be predicted by any of the earlier measurements; these systems were therefore investigated in more detail by cyclic voltammetry and impedance spectroscopy.
Cyclic voltammetry and impedance spectroscopy
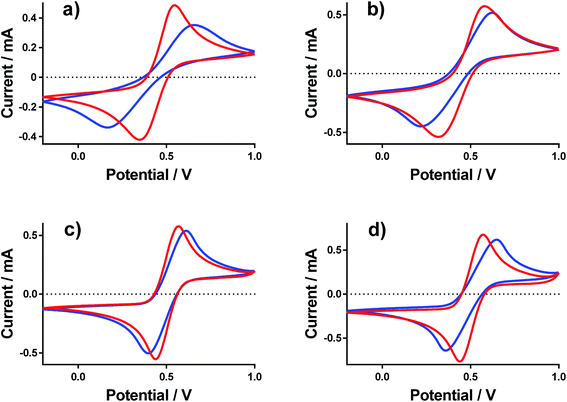
Cyclic voltammograms (CVs) were recorded at a gold electrode for the 400 mM mixed Fe(II/III) solutions, in the presence and absence of the conjugate acid. This represents extremely concentrated solutions and a general absence of any other supporting electrolyte, but is consistent with the solutions used elsewhere in this study. Fig. 7 displays all of the CVs, and the relevant electrochemical parameters are summarised in Table S3.† The trend in peak-to-peak separation somewhat correlated with the thermogalvanic power generated, and primarily the distinct difference between [NH4]FeSO4/FeSO4 systems and the FeCF3SO3/FeNO3 systems. However, these parameters are subject to the rate of electron transfer, ohmic drop and ionic migration, especially given the lack of excess supporting electrolyte. In order to evaluate the different components in more detail, impedance spectroscopy was employed.Impedance spectroscopy was recorded, and fitted using the simplest model possible (Fig. S4†). From this, two resistance values RET and RS were quantified, which broadly represented the resistance for electron transfer (or polarisation resistance) at the electrode surface and the solution resistance, respectively.
Fig. 8 displays graphically the (a) solution resistance (RS), and (b) electron transfer resistance (RET) for the four systems when measured in the thermoelectrochemical cell at ca. 25 °C, with and without addition of acid, actual spectra shown in Fig. S5;† values listed in Table S4.† For comparison, the (c) thermocell resistance for the same systems in the thermogalvanic cell (Rcell) at ΔT = 20 °C are shown (values listed in Table S5†); these are determined by the gradient of the potential vs. current data shown in Fig. 6.
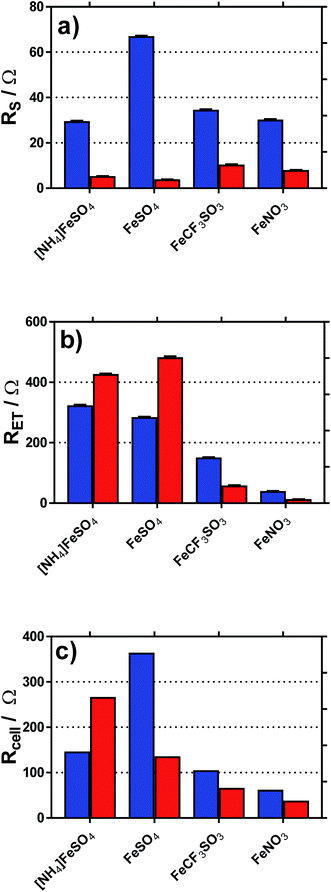 | ||
| Fig. 8 Plots of the (a) solution resistance, RS and (b) electron transfer (or polarisation) resistance, RET, determined in the isothermal cell using impedance spectroscopy. Also shown is the (c) calculated internal resistance of the thermogalvanic cell at ΔT = 20 °C, Rcell, based upon Ohms law (V = IR) and the I–V plots shown in Fig. 5. | ||
As shown in Fig. 8(a), all systems had similar Rs values, which is reasonable considering the concentration of ions present; the higher Rs value for FeSO4 was likely a result of the ion pairing known to occur in this system, while the ion pairing expected for [NH4]FeSO4 would have been offset by the additional ions present (as [NH4]+ and [SO4]2−). All Rs values decreased to negligible values after the addition of 1 M of the conjugate acid, with lower values for the diprotic H2SO4-containing systems.
As shown in Fig. 8(b), the RET values were ca. 4- to 8-fold higher than the RS values for the [NH4]FeSO4, FeSO4 and FeCF3SO3 systems. Interestingly, FeNO3 demonstrated by far the lowest RET value, such that it was on par with the Rs value. Additionally, impedance demonstrated that the addition of acid decreased RET for FeCF3SO3 and FeNO3, but increased RET for [NH4]FeSO4 and FeSO4.
The rate of electron transfer for the Fe(II)/Fe(III) couple is known to be surface-sensitive.26 For the FeCF3SO3 and FeNO3 systems, a lower RET could be due to pH-induced changes of the gold surface, improving electrocatalysis at the gold surface. However, this is counter-intuitive since surface oxides are well known to promote electron transfer constants for the Fe(II)/Fe(III) couple,26 but be less prevalent at lower pH values.27 Alternatively, it could simply be a reflection of a change in relative speciation, on par with the increased current observed in Fig. 6(c) and (d); more redox species present will reduce RET. Since RET was far higher for [NH4]FeSO4 and FeSO4 than the other two systems, and increased upon acidification, the most likely explanation here is sulphate-poisoning of the gold electrode surface; both [SO4]2− and [HSO4]− anions are known to strongly chemisorb upon gold electrode surfaces, hindering gold oxide formation (relative to [ClO4]−).28
These trends are mirrored somewhat in the Rcell values shown in Fig. 8(c); the results indicate the thermogalvanic performance of all systems are likely largely controlled by the RET value;§ the relatively low RET value for FeNO3 explains the relatively high power produced by this system. This also allows us to (tentatively) conclude that a drop in Rcell for FeSO4 upon acidification is primarily due to a supporting electrolyte-type effect, with the added H2SO4 reducing solution resistances and offsetting an increased electrode poisoning effect. In the case of [NH4]FeSO4, the supporting electrolyte-type effect cannot offset the increase in RET, such that Rcell actually increases. However, despite these changes in Rcell, the power output for these two systems actually increased very significantly upon acidification (cf.Fig. 6); this effect is therefore dominated by the increase in the Se due to changes in speciation. Since an increased Se exerts a very significant effect upon the efficiency of the heat-to-current transfer,16 it results in a higher current as well as a higher potential, both boosting power output. In the case of FeCF3SO3 and FeNO3, acidification reduces both RS and RET; further work is required to identify which of the many components involved in acidification (changed speciation, reduced ohmic drop, changes in surface electrocatalytic sites, etc.) are dominant.
Sustainability
Sustainable chemistry generally requires a confluence of economic, societal and ‘green’ chemistry benefits to be viable.29 Considering the economic aspects, it is premature to develop a complete technoeconomic model for these systems. However, Table 1 lists the cost in reagents required to fill the thermoelectrochemical cell with 0.4 M of the iron species (full details regarding the reagents, quantity, purchase price, etc. are listed in Table S6†). It then uses the systems power density at ΔT = 20 °C to present a relative ratio of cost by performance; this value should not be interpreted as cost of power production since no time factor has been included, but is useful to compare the systems.| Iron redox system | Cost of Fe3+/£ per cell | Cost of Fe2+/£ per cell | Cost of 1 M acid/£ per cell | Total cost per cell/£ | Ratio of cost![[thin space (1/6-em)]](https://www.rsc.org/images/entities/char_2009.gif) : :![[thin space (1/6-em)]](https://www.rsc.org/images/entities/char_2009.gif) power (£/W) power (£/W) |
||
|---|---|---|---|---|---|---|---|
| Un-acidified | Acidified | Un-acidified | Acidified | ||||
| a Cost for AgNO3 and FeCl2. | |||||||
| [NH4]FeSO4 | 0.0047 | 0.0079 | 0.0014 | 0.013 | 0.014 | 458 | 52 |
| FeSO4 | 0.0067 | 0.0027 | 0.0014 | 0.009 | 0.011 | 353 | 19 |
| FeCF3SO3 | 1.86 | 0.55 | 0.11 | 2.414 | 2.52 | 1275 | 812 |
| FeNO3 | 0.0058 | 0.0930a | 0.0022 | 0.099 | 0.101 | 33 | 20 |
In the absence of acid, it is clear that the moderate cost and high power produced by the FeNO3 system resulted in the best ratio of cost![[thin space (1/6-em)]](https://www.rsc.org/images/entities/char_2009.gif) :
:![[thin space (1/6-em)]](https://www.rsc.org/images/entities/char_2009.gif) power by at least one order of magnitude. However, the cells containing FeSO4 and [NH4]FeSO4 are by far the cheapest; acidification improved the cost
power by at least one order of magnitude. However, the cells containing FeSO4 and [NH4]FeSO4 are by far the cheapest; acidification improved the cost![[thin space (1/6-em)]](https://www.rsc.org/images/entities/char_2009.gif) :
:![[thin space (1/6-em)]](https://www.rsc.org/images/entities/char_2009.gif) power of the FeSO4 cell more than 20-fold, such that the acidified FeSO4 cell became the most cost effective. Despite the relatively good power produced by the FeCF3SO3 system, the high cost (especially of the Fe(III) salt) resulted in this system having by far the worst cost
power of the FeSO4 cell more than 20-fold, such that the acidified FeSO4 cell became the most cost effective. Despite the relatively good power produced by the FeCF3SO3 system, the high cost (especially of the Fe(III) salt) resulted in this system having by far the worst cost![[thin space (1/6-em)]](https://www.rsc.org/images/entities/char_2009.gif) :
:![[thin space (1/6-em)]](https://www.rsc.org/images/entities/char_2009.gif) power ratio. These considerations ignore economy of scale. However, preliminary searches in this area demonstrated that the FeSO4 system was likely to benefit most from this, with this material on sale on the kg scale at ca. 100-fold less on a £ per gram basis.¶
power ratio. These considerations ignore economy of scale. However, preliminary searches in this area demonstrated that the FeSO4 system was likely to benefit most from this, with this material on sale on the kg scale at ca. 100-fold less on a £ per gram basis.¶
The 12 principles of green chemistry30 provide some categories against which the four different systems can be assessed. However, primarily only principle 4 (designing safer chemicals) and principle 10 (design for degradation) apply.
In considering the need to design safer chemicals, they should maintain functionality while minimising toxicity.30 Toxicity data was unavailable for the majority of the iron salts, but where available all values fell within the ‘moderately toxic’ range on the Gosselin, Smith and Hodge oral toxicity rating; the four systems cannot be easily distinguished. The acidified samples are all also dominated by corrosive nature; these represent a more severe risk to safety and again are all essentially equally undesirable properties.
In considering design for degradation, the [CF3SO3]− system fails given the anion is highly fluorinated and there is no evidence of biodegradation occurring.31 Conversely, [SO4]2− and [HSO4]− are both naturally abundant in all water sources, including tap water;.32 Both the [NO3]− (in FeNO3) and the [NH4]+ (in [NH4]FeSO4) are essential parts of a wide range of ecological environments and are technically ‘bio-available’ rather than biodegradable, but an over-abundance can disrupt the ecology and present long-term risks to humans (via drinking water).33
Finally, green chemistry broadly dictates that the systems should be as stable and as safe as possible. Here, Fe(II)[NO3]2 is notable as it is known to slowly decompose due to oxidation of [NO3]− by the Fe2+.17 This occurs very slowly, but does represent a possible risk to the user (NOx gas evolution), likely limits the longevity of the FeNO3 system, and is a route via which atmospheric pollution is anticipated.
Overall, these points indicate that the acidified FeSO4 represents the most economical and environmentally sustainable system. The higher power generated by the FeNO3 system is only superior if gravimetric or volumetric considerations are included.
Conclusions
This study has investigated four distinct iron salt systems (with different anions) in terms of their thermogalvanic ability to convert a temperature gradient into electrical power. Two systems included the divalent sulphate anion (the [NH4]FeSO4 and FeSO4 systems); two had weakly coordinating monovalent anions (the FeNO3 and FeCF3SO3 systems). This resulted in significant differences between these systems, with the sulphate-based systems demonstrating strong pH sensitivity, and extensive ion pairing resulted in orders of magnitude less thermogalvanic power being generated compared to the monovalent systems. The monovalent anion systems were more strongly influenced by the dissociation of water of hydration rather than ion pairing. A fifth system, iron chloride, did not yield stable results under the conditions used in this study.This study has also demonstrated that addition of sulphuric acid to the thermogalvanic cell was beneficial in terms of speciation and also a supporting electrolyte-type effect (to reduce internal ohmic resistances) but was detrimental to the electron transfer resistance. Conversely, the conjugate acid of the monovalent anions improved the relative speciation and decreased both bulk and electron transfer resistances, resulting in more power being generated.
A preliminary costing comparison, and an evaluation of the ‘green’ credentials of the four systems, resulted in the FeSO4 system being clearly identified as the preferred system; conversely, the FeCF3SO3 system was highlighted as extremely uncompetitive. The FeNO3 was superior in terms of the overall power generated per cell, and these systems investigated were consistently economically competitive (on the scale employed) but does demonstrate potential longevity, safety and environmental issues.
Overall the highly significant role of the anion in the thermogalvanic performance of Fe2+/Fe3+-based systems has been demonstrated. Going forward, non-coordinating monovalent cations that are both cost-effective and environmentally benign need to be identified.
Conflicts of interest
There are no conflicts to declare.References
- T. I. Quickenden and Y. Mua, J. Electrochem. Soc., 1995, 142, 3985 CrossRef CAS.
- B. Burrows, J. Electrochem. Soc., 1976, 123, 154–159 CrossRef CAS.
- S. G. Bratsch, J. Phys. Chem. Ref. Data, 1989, 18, 1–21 CrossRef CAS.
- A. Gunawan, C.-H. Lin, D. A. Buttry, V. Mujica, R. A. Taylor, R. S. Prasher and P. E. Phelan, Nanoscale Microscale Thermophys. Eng., 2013, 174, 304–323 CrossRef.
- M. Al Maimani, J. J. Black and L. Aldous, Electrochem. Commun., 2016, 72, 181–185 CrossRef CAS.
- J. J. Black, T. Murphy, R. Atkin, A. Dolan and L. Aldous, Phys. Chem. Chem. Phys., 2016, 18, 20768–20777 RSC.
- J. J. Black, A. Dolan, J. B. Harper and L. Aldous, Phys. Chem. Chem. Phys., 2018, 20, 16558–16567 RSC.
- A. Gunawan, H. Li, C.-H. Lin, D. A. Buttry, V. Mujica, R. A. Taylor, R. S. Prasher and P. E. Phelan, Int. J. Heat Mass Transfer, 2014, 78, 423–434 CrossRef CAS.
- C. Lin, A. Gunawan, P. E. Phelan, D. A. Buttry and R. A. Taylor, ASME Proceedings, 2012, 6, 541–547, DOI:10.1115/IMECE2012-88796.
- P. Yang, K. Liu, Q. Chen, X. Mo, Y. Zhou, S. Li, G. Feng and J. Zhou, Angew. Chem., Int. Ed., 2016, 55, 12050–12053 CrossRef CAS PubMed.
- N. Sutin, M. J. Weaver and E. L. Yee, Inorg. Chem., 1980, 19, 1096–1098 CrossRef CAS.
- T. Migita, N. Tachikawa, Y. Katayama and T. Miura, Electrochemistry, 2009, 77, 639–641 CrossRef CAS.
- L. Zhang, T. Kim, N. Li, T. J. Kang, J. Chen, J. M. Pringle, M. Zhang, A. H. Kazim, S. Fang, C. Haines, D. Al-Masri, B. A. Cola, J. M. Razal, J. Di, S. Beirne, D. R. MacFarlane, A. Gonzalez-Martin, S. Mathew, Y. H. Kim, G. Wallace and R. H. Baughman, Adv. Mater., 2017, 29, 1–7 Search PubMed.
- Y. Yamato, Y. Katayama and T. Miura, ECS Trans., 2012, 50, 167–174 CrossRef.
- E. H. B. Anari, M. Romano, W. X. Teh, J. J. Black, E. Jiang, J. Chen, T. Q. To, J. Panchompoo and L. Aldous, Chem. Commun., 2016, 52, 745–748 RSC.
- L. Aldous, J. J. Black, M. C. Elias, B. Gélinas and D. Rochefort, Phys. Chem. Chem. Phys., 2017, 19, 24255–24263 RSC.
- C. J. Ottley, W. Davison and W. M. Edmunds, Geochim. Cosmochim. Acta, 1997, 61, 1819–1828 CrossRef CAS.
- J. Wu, J. J. Black and L. Aldous, Electrochim. Acta, 2017, 225, 482–492 CrossRef CAS.
- M. S. Romano, S. Gambhir, J. M. Razal, A. Gestos, G. G. Wallace and J. Chen, J. Therm. Anal. Calorim., 2012, 109, 1229–1235 CrossRef CAS.
- E. L. Yee, R. J. Cave, K. L. Guyer, P. D. Tyma and M. J. Weaver, J. Am. Chem. Soc., 1979, 101, 1131–1137 CrossRef CAS.
- J. Majzlan and S. C. B. Myneni, Environ. Sci. Technol., 2005, 39, 188–194 CrossRef CAS PubMed.
- C. C. Loures, M. A. K. Alcântara, H. J. Izario Filho, A. C. S. C. Teixeira, F. T. Silva, T. C. B. Paiva and G. R. L. Samanamud, Int. Rev. Chem. Eng., 2013, 5, 102–120 Search PubMed.
- R. Diaz-Torrez and S. Alvarez, Dalton Trans., 2011, 40, 10742–10750 RSC.
- D. H. Ripin and D. A. Evans, pKa's of Inorganic and Oxo-Acids, https://ccc.chem.pitt.edu/wipf/MechOMs/evans_pKa_table, (accessed 13th August 2018) Search PubMed.
- F. G. Bordwell, Acc. Chem. Res., 1988, 21, 456–463 CrossRef CAS.
- R. L. McCreery, Chem. Rev., 2008, 108, 2646–2687 CrossRef CAS PubMed.
- L. Aldous and R. G. Compton, Phys. Chem. Chem. Phys., 2011, 13, 5279–5287 RSC.
- H. Angerstein-Kozlowska, B. E. Conway, A. Hamelin and L. Stoicoviciu, J. Electroanal. Chem., 1987, 228, 429–453 CrossRef CAS.
- M. Philippe, B. Didillon and L. Gilbert, Green Chem., 2012, 14, 952–956 RSC.
- P. Anastas and J. Warner, Green Chemistry: Theory and Practice, Oxford University Press, Oxford, England, 2000 Search PubMed.
- D. Coleman and N. Gathergood, Chem. Soc. Rev., 2010, 39, 600–637 RSC.
- Sulfate in Drinking-water: Background document for development of WHO Guidelines for Drinking-water Quality (WHO/SDE/WSH/03.04/114), https://www.who.int/water_sanitation_health/dwq/chemicals/sulfate.pdf, (accessed 16th July 2018) Search PubMed.
- Y. Xue, J. Song, Y. Zhang, F. Kong, M. Wen and G. Zhang, Water, 2016, 8(8), 328 CrossRef.
Footnotes |
| † Electronic supplementary information (ESI) available. See DOI: 10.1039/c8se00416a |
| ‡ Despite using the smallest pathlength cuvette available (100 μm), the concentration had to be reduced to 20 mM Fe(III) to keep the absorbance within acceptable values. |
| § Impedance measurements of resistance values in an isothermal setup are expected to be different to impedance measurements in a non-isothermal cell. Furthermore, the internal resistance reported for the thermocell represents a steady-state discharge system; here there will be significantly altered redox ratios at the electrode surfaces, and the mass transfer in the thermogalvanic cell often involves more than simple diffusion. Therefore comparison between such impedance measurements and actual thermogalvanic cell performance characteristics need to be approached with caution. |
| ¶ At the time of writing, 25 kg of Fe(II)SO4–7H2O was for sale for £22.95 on ebay.co.uk, as a lawn supplement. |
| This journal is © The Royal Society of Chemistry 2018 |


