 Open Access Article
Creative Commons Attribution 3.0 Unported Licence
Growth dynamics of surface nanodroplets during solvent exchange at varying flow rates†
Brendan
Dyett
 a,
Akihito
Kiyama
b,
Maaike
Rump
c,
Yoshiyuki
Tagawa
b,
Detlef
Lohse
 c and
Xuehua
Zhang
 *dac
*dac
aSoft Matter & Interfaces Group, School of Engineering, RMIT University, Melbourne, VIC 3001, Australia. E-mail: xuehua.zhang@ualberta.ca
bDepartment of Mechanical Systems Engineering, Tokyo University of Agriculture and Technology, Nakacho 2-24-16 Koganei, Tokyo 184-8588, Japan
cPhysics of Fluids Group, Department of Science and Engineering, Mesa+ Institute, J. M. Burgers Centre for Fluid Dynamics and the Max Planck Center Twente for Complex Fluid Dynamics, University of Twente, P.O. Box 217, 7500 AE Enschede, The Netherlands
dDepartment of Chemical and Materials Engineering, Faculty of Engineering, University of Alberta, Edmonton, Alberta T6G1H9, Canada
First published on 7th May 2018
Abstract
Solvent exchange is a simple solution-based process to produce surface nanodroplets over a large area. The final size of the droplets is determined by both the flow and solution conditions for a given substrate. In this work, we investigate the growth dynamics of surface nanodroplets during solvent exchange by using total internal reflection fluorescence microscopy (TIRF). The results show that during the solvent exchange, the formation of surface nanodroplets advanced on the surface in the direction of the flow. The time for the number density and surface coverage of the droplets to reach their respective plateau values is determined by the flow rate. From the observed evolution of the droplet volume and of the size of individual growing droplets, we are able to determine that the growth time of the droplets scales with the Peclet number Pe with a power law ∝Pe−1/2. This is consistent with Taylor–Aris dispersion, shedding light on the diffusive growth dynamics during the solvent exchange. Further, the spatial rearrangement of the droplets during coalescence demonstrates a preference in position shift based on size inequality, namely, the coalesced droplet resides closer to the larger of the two parent droplets. These findings provide a valuable insight toward controlling droplet size and spatial distribution.
1 Introduction
Droplet formation on surfaces is paramount to a growing number of fundamental and applied processes.1–4 Areas of interest include breath figure templating5,6 and the condensation of droplets on liquid repellent surfaces.7,8 Surface droplets are also relevant for high throughput screening9 and compartmentalized biological conversion in microdroplet arrays.10 Once these droplets are tens to hundreds of nanometers in height and several hundred nanometers to several microns in lateral diameter, we refer to them as surface nanodroplets. To be more precise, they may be also called sessile submicron droplets.To lay the foundation for a variety of droplet-based applications, various approaches have been explored to produce surface nanodroplets, including inkjet11 and contact printing,12 matrix-assisted pulsed laser evaporation,13 drop splitting14 and condensation.15 Among these approaches, solvent exchange provides a versatile approach for producing droplets on a substrate in contact with a surrounding phase of an immiscible liquid. The approach of solvent exchange denotes the general process of displacing a good solvent of the droplet liquid with a poor solvent within a fluid channel which accommodates the substrate. Solvent exchange has been shown to be universal, yielding femtoliter surface droplets of various liquids16 and is not limited by scale.17
During solvent exchange, a pulse of temporal oversaturation of the solute is created at the mixing front,18 leading to the formation of surface nanodroplets on the substrate. The oversaturation and from this the resulting droplet size can be controlled by the flow and solution conditions. However, this control of the droplet formation requires a quantitative understanding of the mechanism of solvent exchange. The work by Zhang et al.19 highlighted the interplay between the solution chemistry and fluid dynamics for the final droplet size. It was reported that the droplet size was larger at higher flow rates, corresponding to higher Peclet (Pe) numbers. For fixed fluid cell geometries, the final droplet volume per unit area scales with ∝Pe3/4. On the other hand, for a fixed flow rate, the droplet volume scales with the channel height h with ∝h3 and thus can be modulated by modulating the channel height.20 These influences can be understood by describing the mixing of the two solutions through Taylor–Aris dispersion.21–23 Consequently, for given channel dimensions, it is expected that the duration of the oversaturation pulse τ scales Pe−1/2.20 So far, however, the growth time of droplets at different flow rates has not yet been directly measured from experiments and a quantitative correlation between the droplet growth time and the flow rate of the solvent exchange is yet to be established.
More recently, Xu et al.24 identified universal regimes of droplet growth based on the final droplet morphology from a broad range of flow and solution conditions. It was suggested that the surface coverage and number density of droplets initially increased before a maximal surface coverage was reached. With continued droplet growth, the surface coverage remained saturated while the number density decreased. However, the dynamics of the droplet growth has not yet been examined in situ during the process of solvent exchange.
In this work, we employ total internal reflection fluorescence confocal microscopy25–27 (TIRF) to examine the growth of surface nanodroplets. This experimental technique allows in situ observation of surface nanodroplets during the entire process of solvent exchange. From the superb spatial and temporal resolution of TIRF measurements we are able to determine the growth time of the droplets at different flow rates. The measurements allow for two complementary approaches to determine the growth time of droplets for a given flow rate, which both give consistent results. Furthermore, once the surface coverage is above a certain threshold, the dynamical process of droplet coalescence can clearly be revealed. The findings of this work are valuable for the design of flow conditions for desirable droplet sizes, but also may be applied to control microphase separation in general.
2 Experimental section
2.1 Chemicals and materials
1-Octanol (99%, Sigma), ethanol (AR, Chem-supply), isopropanol (AR, Chem-supply), octyldecyltrichlorosilane (OTS) (99%, Sigma), nile-red (Sigma) were used as received without further purification. The glass substrates (high precision, 26 × 60 mm, no. 1.5H, Marienfeld) were hydrophobilized using OTS by following a previously reported protocol.28 The substrates were additionally cleaned by sonication in isopropanol for 15 min immediately before use.1-Octanol was chosen as the droplet liquid. To perform the solvent exchange, two solutions were prepared. The first solution, solution A, was 5% (v/v) 1-octanol in 50% aqueous ethanol while the second solution, solution B, was 1-octanol saturated water. All the experiments were conducted at room temperature. For the measurements by confocal microscope, nile-red was used to selectively dye the 1-octanol phase.
2.2 TIRF measurements of growing nanodroplets during solvent exchange
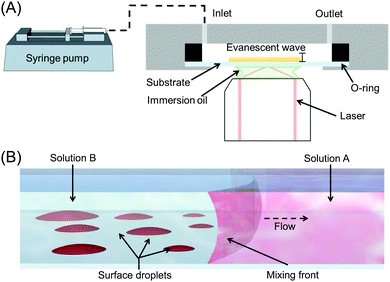
Surface nanodroplets were formed on the glass substrate that was the bottom wall of a custom-built fluid chamber as sketched in Fig. 1A. The rectangular chamber was 15 mm in width, 50 mm in length and 900 μm in height. The fluid cell was positioned on the top of the sample stage for TIRF measurements. During the solvent exchange, the fluid chamber was pre-filled with solution A. The second solution, solution B, was introduced into the chamber at a given flow rate to displace solution A. The flow rate was controlled by using a digital syringe pump (NE-1000, Pump Systems). The flow conditions for the solvent exchanges are listed in Table 1 and were performed in triplicate.| Q (μl min−1) | Re | Pe | Ū (mm s−1) |
|---|---|---|---|
| 25 | 0.031 | 27.8 | 0.031 |
| 35 | 0.044 | 38.9 | 0.043 |
| 50 | 0.062 | 55.6 | 0.062 |
| 75 | 0.094 | 83.3 | 0.093 |
| 100 | 0.125 | 111 | 0.123 |
| 150 | 0.187 | 167 | 0.185 |
The process of nucleation and growth of surface nanodroplets sketched in Fig. 1B was observed in the measurements by TIRF. A Nikon N-Storm super-resolution confocal microscope (TIRF 100× 1.49 NA objective lens) was used with the samples illuminated by a continuous wave (CW) 561 nm laser. Within the NIS-Elements AR software the TIRF mirror position was adjusted until achieving TIR, determined by a simultaneous decrease in background brightness. The region of interest was collected by an Andor iXon EMCCD camera and defined as 81.9 × 81.9 μm2 with ∼31.2 ms exposure, resulting in a pixel calibration of 0.16 μm per pixel.
2.3 Data analysis
A tiff stack of the raw data from TIRF was processed frame-by-frame in self-written Matlab codes. The brightness of each frame was adjusted by adaptive histogram equalization before segmentation and watershed transforms. Based on the binarized images, the number, size and surface coverage of droplets with time were determined. To analyse droplet coalescence, a coalesced droplet was first identified, and then the tiff image stack of this droplet at earlier time was analysed to identify its parent droplets. The size and position of the droplets were determined in each frame as the time went back to earlier and earlier stages. The change in droplet position and number was utilized to characterize the parent-child droplet relationships.3 Results and discussion
3.1 Size, surface coverage and number density of droplets during solvent exchange
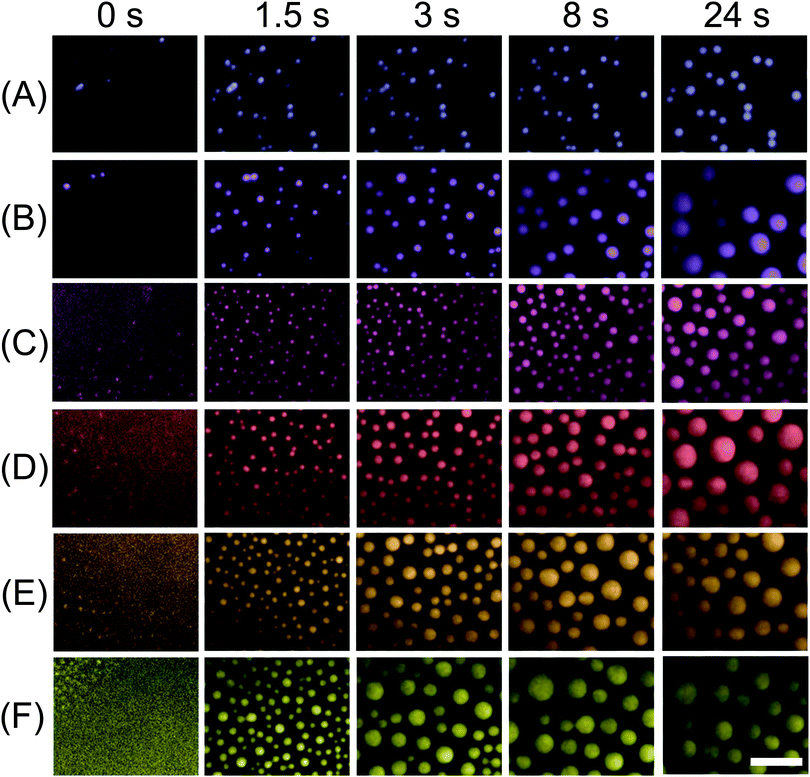
A representative series of snapshots shown in Fig. 2 reveals the progressive nucleation of 1-octanol droplets along the surface. The flow for the solvent exchange was in a diagonal direction from the upper left to the lower right, identical to the advancing direction for the droplet formation. These TIRF images resolve droplet radii of ∼200–300 nm, allowing the direct visualization of the droplet growth process from an early stage of the exchange. The interval between two sequential snapshots is ∼60–120 ms. The moment of the detection of the initial droplets in the measurements is defined as time 0. The images of the droplets at the end of the solvent exchange (shown in Fig. 3) did not show any difference in terms of droplet size at different locations of the substrate. The observations suggest that the duration of the solvent exchange at a given location on the surface is not related to the flow direction. That is, the earlier formed droplets also stop growing earlier. A video of the solvent exchange with millisecond temporal resolution is available in the ESI† (Video S1).The extended time series of TIRF images in Fig. 3 show the droplet growth during the solvent exchange from the beginning to the end at ∼24 s. For six different flow rates from 25 μl min−1 to 150 μl min−1, the number density, size and surface coverage of droplets were different not only at the end of the growth process, but also exhibited contrasting dynamics during the growth process. For the slowest flow rate Q = 25 μl min−1, the nanodroplets were clearly smaller in size and grew mostly isolated from one another for the entire solvent exchange. At a flow rate Q = 35 μl min−1 however, the number of droplets started to decrease from several incidents of droplet coalescence from 8 s onward. At an even faster flow rate Q = 50 μl min−1, the droplets were much more crowded on the surface than those formed for the two slower flow rates. Then at faster flow rates of 75–150 μl min−1, the decrease in the number density from droplet coalescence was particularly noticeable and was evident at earlier time intervals as the flow rate was increased. Below we will refer to 25 μl min−1 and 35 μl min−1 as slow flow rates, 50 μl min−1 as the intermediate flow rate and 75–150 μl min−1 as fast flow rates.
The quantitative analysis of individual droplet radius, droplet number, surface coverage and droplet volume per unit area, all as a function of time is provided in Fig. 4(A–D). The droplet base radius R as a function of time t is obviously greatly influenced by the coalescence. Fig. 4(A) shows the radius of two representative growing droplets that did not experience any coalescence in the given time window. The size of individual droplets rapidly increased first and then slowly approached a plateau. The growth time was obviously longer as the flow rate decreased from Q = 150 μl min−1 to Q = 75 μl min−1. In the following section, the dependence of individual droplet radius as a function of time will be analysed in greater detail to precisely extract the duration of the droplet growth.
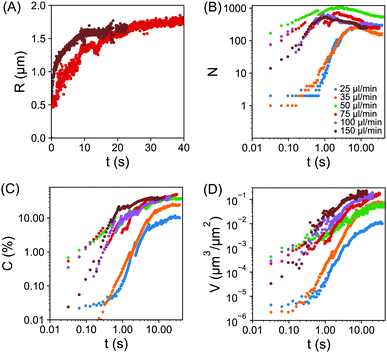 | ||
| Fig. 4 (A) Plot of droplet base radius R vs. time t, for two representative growing droplets. The individual droplets did not experience coalescence in the given time window. The flow rates of the solvent exchange were 75 μl min−1 (red) and 150 μl min−1 (brown). For clarity, only two flow rates are shown here, results for additional flow rates are included within the ESI,† Fig. S1. (B–D) log–log plot of the number of droplets N in (B), the surface coverage C in (C), the droplet volume per unit area V in (D) all as a function of time t. The flow rate as labelled by different colors was 25 μl min−1 (blue), 35 μl min−1 (orange), 50 μl min−1 (green), 75 μl min−1 (red), 100 μl min−1 (purple) and 150 μl min−1 (brown). Plots B–D begin from the initial frame (∼30 ms) prior to droplet detection. | ||
The plot in Fig. 4(B) reveals the transition of different stages in the number density of droplets corresponding to different flow rates. For slow flow rates, the initial nucleation yielded a relatively slow increase in droplet number between ∼0.1 s and 1 s. There was then a rapid increase in the droplet number until ∼10 s, beyond which the droplet number remained unchanged. For the intermediate and fast flow rates, the rapid rise in the droplet number already finished in ∼3 s and ∼1 s, respectively. After the droplet number peaked, there was a subsequent reduction due to droplet coalescence, in particular for fast flow rates. At the end of the droplet growth, the highest droplet number density was achieved at a intermediate flow rate Q = 50 μl min−1. Interestingly, Fig. 3 also showed that the final droplet size was clearly smaller at Q = 50 μl min−1 than at Q = 35 μl min−1. Given the droplets are effectively competing for local oversaturation, the reduced size can be attributed to the higher number density during the growth process, which leads to increased competition between neighbouring droplets.
The plot of surface coverage vs. time in Fig. 4(C) shows an early stage of fast increase and a late stage of slow increase. After the peak in droplet number at fast flow rates, the surface coverage of droplets still kept increasing. The terminal surface coverage was ∼10% at Q = 25 μl min−1, ∼24% at Q = 35 μl min−1 and remained to be ∼37% to ∼45% at all higher flow rates from 50 μl min−1 to 150 μl min−1. The dependence of the final surface coverage of droplets on the flow rate is in agreement with what we found in ref. 24.
The coupled effects from temporal evolution of individual droplet size, surface coverage and number density led to a clear difference in the total volume of the droplets per unit surface area at different flow rates. Fig. 4D shows that the droplet volume per unit area monotonically increases with time for fixed flow rates and with flow rate for a given duration. Below we will explain how the growth rate in droplet volume per unit area is related to the flow rate. The relation between the final total droplet volume per unit area V and the flow rate (expressed as Pe) was devised in ref. 19, obtaining V ∝ h3Pe3/4. The explanation was based on diffusive droplet growth through a time-dependent concentration boundary layer given by the passing oversaturation pulse due to the mixing front. Extending the same idea, here we focus on the dynamics of the growth process.
3.2 Theoretical analysis of droplet growth dynamics
Assuming the droplet grows with a constant contact angle, the growth of an individual droplet is given by the diffusion equation,| ṁ = 4πρoilR2Ṙ = 4πDR2∂rc|R, | (1) |
 of the droplet in a laminar flow,
  . This can be integrated over time leading to
 | (2) |
 | (3) |
 , we then obtain
 | (4) |
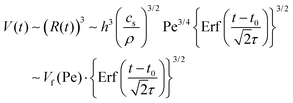
The shear flow in solvent exchange corresponds to a non-uniform, parabolic flow velocity distribution within the channel; with the highest velocity in the middle of the channel and a parabolically decreasing velocity approaching the channel walls. As described by Taylor–Aris dispersion,21–23 the velocity profile creates enhanced concentration gradients, which in turn enhance the radial diffusion of the solute. This effectively results in a ‘smearing out’ of the concentration distribution in flow direction. Consequently, it is expected that ζmax ∼ Pe1/2 and τ ∼ h2Pe−1/2/D, reflecting that at a fixed position downstream for large advection velocity the blob of oversaturation will be smeared out less as less time has passed.20 Thus ζmax·τ ∼ h2/D,20 resulting in
 | (5) |
 | (6) |
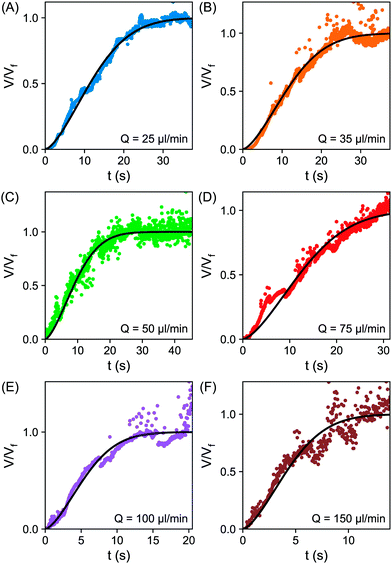 | ||
| Fig. 5 (A–F) Plot of the normalized volume V/Vfvs. time t for varying flow rates; (A) 25 μl min−1 (B) 35 μl min−1 (C) 50 μl min−1 (D) 75 μl min−1 (E) 100 μl min−1 (F) 150 μl min−1. The fitting to the error function eqn (6) is shown as the solid black line. | ||
From fittings of the droplet volume as a function of time shown in Fig. 5, the oversaturation pulse duration τ for different flow rates was obtained and plotted against Pe in Fig. 6. The plot revealed that the pulse duration indeed decreased with increases in Pe. Moreover, the fittings indicates τ ∼ Pe−1/2. This result demonstrates the mixing behaviour during solvent exchange is well described Taylor–Aris dispersion.20–23
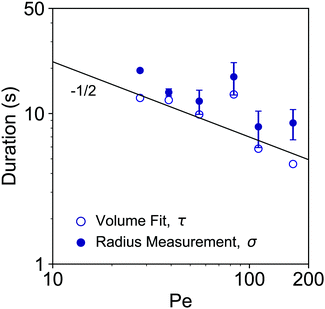 | ||
| Fig. 6 log–log plot of the growth durations as a function of Pe. The growth duration was determined by two approaches. The timescale τ obtained from the fitting of the droplet volume per unit area by error functions in Fig. 5 is labelled by open circle markers. The duration σ based on the temporal evolution of the individual droplet radius is labelled by the filled circle markers. The predicted slope of −1/2 is shown as solid black line. | ||
3.3 Growth time determined from temporal evolution of individual droplets
The growth time was also quantified by the evolution of individual droplet radii at different flow rates, as represented in Fig. 4A. Results for the additional flow rates are provided in the ESI† (Fig. S1). The droplets grew to a final (plateau) droplet size Rmax, determined by averaging values in the plateau. The corresponding growth duration, called σ, was estimated as the time required to achieve 0.9Rmax, as indicated by the fitting lines in Fig. S1 (ESI†). As a result, σ encompasses most of the growth duration while minimizing noise from the end of the experiment, where the change in droplet size becomes increasingly minor.The growth times σ of the droplets for different flow rates are plotted as a function of Pe number in Fig. 6, together with the previously identified time scales τ, showing reasonable agreement. The fitting of the data shows good agreement with τ ∼ σ ∼ Pe−1/2. This result further confirms the scaling of growth time with the Pe number based on fitting of the droplet volume by error functions in Fig. 5. Note that the values for τ are slightly lower than those for σ obtained from the direct droplet radius measurements. This is reasonable as τ represents the time scale of the Gaussian peak width (oversaturation pulse width), not necessarily encompassing the entire growth duration.
3.4 Dynamics of droplet coalescence
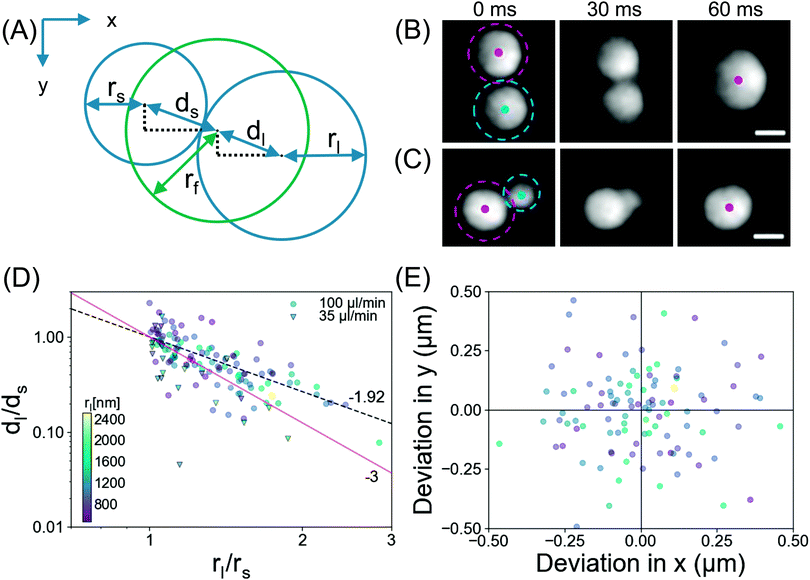
Now we provide more analysis of the droplet coalescence, based on the data from the TIRF measurements. As demonstrated in Fig. 3, after the surface coverage reaches a certain threshold, coalescence is the determinant process in droplet growth. Representative snapshots in Fig. 7B and C show two coalescence events at Q = 100 μl min−1 with an interval of 30 ms. The images reveal bridging of the droplets, as reported for larger droplets in literature.29–31Fig. 7B shows coalescence between droplets of similar sizes, rs = 1.34 μm, rl = 1.57 μm. Here the final droplet position was observed to be in the middle of the two parent droplets. Fig. 7C shows coalescence between droplets of dissimilar sizes, rs = 0.97 μm, rl = 1.47 μm, where the final droplet position was nearer to the larger parent droplet.To quantify the droplet positions, the relevant centroids and sizes of the smaller, larger and final droplets during the coalescence process were determined as depicted in Fig. 7A. Assuming a constant contact angle mode (thus r3 ∼ V), the theoretical centre of mass was determined from the radii of the parent droplets. The ratio of displacement for the large/small droplet is plotted against the size ratio of large/small in Fig. 7D. The experimental data for displacement was fitted (dashed black line) with the power law, dl/ds ∼ (rl/rs)−p, yielding an exponent p = 1.92 (standard error = 0.18, R2 = 0.68). The fitting of the power law indicates that there is a coalescence preference, namely the final droplet is located closer to the larger parent. This observation resembles the behavior of microdroplets.32–34 Also in our latest work, we showed that nanodroplets around the rim of a microcap demonstrated a coalescence preference with a similar exponent p = 2.08.35 The coalescence preference was attributed to the balance of the capillary force (F = 2πγrmin) which brings the droplet together, against the force required to overcome the contact angle hysteresis. The strength of the latter depends on the contact area of the droplet with the substrate,36 (F/rn2), thus dl/ds ∼ (rl/rs)−2, yielding the theoretical exponent of p = 2. This agrees well with the observed exponent determined here (p = 1.92) and in ref. 35 (p = 2.08).
To examine whether the preference in the droplet position shift is related to the direction or rate of the external flow, we define the final position from the centre of mass calculation in x and y directions as shown in Fig. 7E. Based on the experimental data for coalescence during exchange at Q = 35 μl min−1 and Q = 100 μl min−1, we did not observe any correlation between the position shift of the droplets and the direction or rate of the flow. Therefore, the droplet coalescence seemed to be independent of the flow conditions.
4 Conclusions
The nucleation and growth of surface nanodroplets by solvent exchange on a homogeneous substrate was revealed by TIRF with high temporal and spatial resolution. During the solvent exchange surface droplets nucleated along the flow direction. In subsequent droplet growth, the surface coverage and droplet number exhibited a rapid increase at early stage and reached plateaus at later stages, whose values depend on the flow rate. The duration of droplet growth, determined in two different ways, scales as ∼Pe−1/2, as one would expect from Taylor–Aris dispersion. At sufficient surface coverage, droplets coalesce. The coalescence process exhibited a preference in position shift according to the relative droplet sizes. In addition, the position shift at droplet coalescence was independent of flow rate and direction. The quantitative understanding of droplet growth with time and position shifting rules will further enable the modelling of the solvent exchange process as well as aid the experimental design for controlling droplet morphology. In particular, the improved understanding of droplet growth dynamics will facilitate future use of droplet templates for engineering functional surface structures. The findings of this work may also be applied to the understanding of microphase formation in general. Beyond this, the experimental methodology utilized herein invites future studies in areas such as the wetting behaviour of submicron droplets.Conflicts of interest
There are no conflicts to declare.Acknowledgements
We thank Hao Hao for assistance in the analysis of droplet coalescence. X. H. Z. acknowledges the support from the Australian Research Council (FT120100473, LP140100594) and from Start-up Fund from the Faculty of Engineering and funding support of Future Energy Systems in University of Alberta. We also acknowledge the RMIT MicroNano Research Facility for providing access to equipment and resources. This work was supported by the Netherlands Center for Multiscale Catalytic Energy Conversion (MCEC), an NWO Gravitation programme funded by the Ministry of Education, Culture and Science of the government of the Netherlands. Open Access funding provided by the Max Planck Society.Notes and references
- K. Stephan, Heat transfer in condensation and boiling, Berlin, Springer-Verlag, 1992 Search PubMed.
- D. Beysens, A. Steyer, P. Guonoun, D. Fritter and C. M. Knobler, Phase Transitions, 1991, 31, 219–446 CrossRef.
- D. Beysens, Physique 7, 2006, 7, 1082–1100 CrossRef.
- J. Ju, H. Bai, Y. Zheng, T. Zhao, R. Fang and L. Jiang, Nat. Commun., 2012, 3, 1247 CrossRef PubMed.
- U. H. F. Bunz, Adv. Mater., 2006, 18, 973–989 CrossRef.
- N. Noor, J. Koll, C. Abetz, H. Notzke and V. Abetz, Sci. Rep., 2017, 7, 8050 CrossRef PubMed.
- N. Miljkovic, D. J. Preston, R. Enright and E. N. Wang, Appl. Phys. Lett., 2014, 105, 013111 CrossRef.
- N. Miljkovic, R. Enright, Y. Nam, K. Lopez, N. Dou, J. Sack and E. N. Wang, Nano Lett., 2013, 13, 179–187 CrossRef PubMed.
- A. Theberge, F. Courtois, Y. Schaerli, M. Fischlechner, C. Abell, F. Hollfelder and W. Huck, Angew. Chem., Int. Ed., 2010, 49, 5846–5868 CrossRef PubMed.
- J. Shemesh, T. B. Arye, J. Avesar, J. H. Kang, A. Fine, M. Super, A. Meller, D. E. Ingber and S. Levenberg, Proc. Natl. Acad. Sci. U. S. A., 2014, 111, 11293–11298 CrossRef PubMed.
- M. Kuang, L. Wang and Y. Song, Adv. Mater., 2014, 26, 6950–6958 CrossRef PubMed.
- D. Kang, C. Pang, S. M. Kim, H. S. Cho, H. S. Um, Y. W. Choi and K. Y. Suh, Adv. Mater., 2012, 24, 1709–1715 CrossRef PubMed.
- A. Piqué, Appl. Phys. A: Mater. Sci. Process., 2011, 105, 517–528 CrossRef.
- H. Li, Q. Yang, G. Li, M. Li, S. Wang and Y. Song, ACS Appl. Mater. Interfaces, 2015, 7, 9060–9065 Search PubMed.
- Y. Yamada, T. Ikuta, T. Nishiyama, K. Takahashi and Y. Takata, Langmuir, 2014, 30, 14532–14537 CrossRef PubMed.
- B. Dyett, H. Yu and X. Zhang, Eur. Phys. J. E: Soft Matter Biol. Phys., 2017, 40, 26 CrossRef PubMed.
- H. Yu, S. Peng, L. Lei, J. W. Zhang, T. L. Greaves and X. Zhang, ACS Appl. Mater. Interfaces, 2016, 8, 22679–22687 Search PubMed.
- D. Lohse and X. Zhang, Rev. Mod. Phys., 2015, 87, 981 CrossRef.
- X. Zhang, Z. Lu, H. Tan, L. Bao, Y. He, C. Sun and D. Lohse, Proc. Natl. Acad. Sci. U. S. A., 2015, 112, 9253–9257 CrossRef PubMed.
- H. Yu, S. Maheshwari, J. Zhu, D. Lohse and X. Zhang, Lab Chip, 2017, 17, 1496–1504 RSC.
- R. Aris, Proc. R. Soc. London, Ser. A, 1956, 67–77 CrossRef.
- R. Aris, Proc. R. Soc. London, Ser. A, 1959, 538–550 CrossRef.
- G. Taylor, Proc. R. Soc. London, Ser. A, 1953, 186–203 CrossRef.
- C. Xu, H. Yu, S. Peng, Z. Lu, L. Lei, D. Lohse and X. Zhang, Soft Matter, 2017, 13, 937–944 RSC.
- D. Axelrod, Methods Cell Biol., 1989, 30, 245–270 CrossRef PubMed.
- C. U. Chan and C. D. Ohl, Phys. Rev. Lett., 2012, 109, 1–5 CrossRef PubMed.
- C. U. Chan, M. Arora and C.-D. Ohl, Langmuir, 2015, 31, 7041–7046 CrossRef PubMed.
- M. Lessel, O. Baumchen, M. Klos, H. Hahl, R. Fetzer, M. Paulus, R. Seemanna and K. Jacobs, Surf. Interface Anal., 2014, 47, 557–564 CrossRef.
- J. Eggers, J. R. Lister and H. A. Stone, J. Fluid Mech., 1999, 401, 293–310 CrossRef.
- J. Hernández-Sánchez, L. Lubbers, A. Eddi and J. H. Snoeijer, Phys. Rev. Lett., 2012, 109, 184502 CrossRef PubMed.
- A. Eddi, K. Winkels and J. H. Snoeijer, Phys. Rev. Lett., 2013, 111, 144502 CrossRef PubMed.
- B. M. Weon and J. H. Je, Phys. Rev. Lett., 2012, 108, 224501 CrossRef PubMed.
- Y. Kim, S. J. Lim, B. Gim and B. M. Weon, Sci. Rep., 2014, 5, 7739 CrossRef PubMed.
- R. Chen, H. W. Yu, L. Zhu, R. M. Patil and T. Lee, Am. Inst. Chem. Eng., 2017, 63, 1441–1450 CrossRef.
- B. Dyett, H. Hao, D. Lohse and X. Zhang, Soft Matter, 2018, 14, 2628–2637 RSC.
- F. Chu, X. Wu, Y. Zhu and Z. Yuan, Int. J. Heat Mass Transfer, 2017, 111, 836–841 CrossRef.
Footnote |
| † Electronic supplementary information (ESI) available. See DOI: 10.1039/c8sm00705e |
| This journal is © The Royal Society of Chemistry 2018 |

