H-Bonded anion–anion complexes in fentanyl citrate polymorphs and solvates†
Rafael
Barbas
 a,
Rafel
Prohens
 *ab,
Antonio
Bauzá
 c,
Antonio
Franconetti
 c and
Antonio
Frontera
 *c
*c
aUnitat de Polimorfisme i Calorimetria, Centres Científics i Tecnològics, Universitat de Barcelona, Baldiri Reixac 10, 08028 Barcelona, Spain. E-mail: rafel@ccit.ub.edu
bCenter for Intelligent Research in Crystal Engineering, S.L., Spain
cDepartament de Química, Universitat de les Illes Balears, Crta. de Valldemossa km 7.5, 07122 Palma (Illes Balears), Spain. E-mail: toni.frontera@uib.es
First published on 27th November 2018
Abstract
Herein we report the experimental observation (X-ray characterization) of two different binding modes in H-bonded anion–anion complexes (anion = citrate) in N-(1-(2-phenylethyl)-4-piperidinylium)-N-phenyl-propanamide-citrate (fentanyl citrate). High level DFT calculations indicate that both types of anion–anion complexes (one with two and the other with four H-bonds) are thermodynamically unstable but kinetically stable with respect to the isolated anions with activation barriers as high as 14 kcal mol−1.
Fentanyl (F) is a synthetic opioid analgesic first developed in the early 1970s which is 50 to 100 times more potent than morphine but with a greater margin of cardiovascular safety.1 Due to its very low solubility in water (81 μg mL−1), the more water-soluble fentanyl citrate salt is used in injection formulations.2 It is well known that the crystalline form and hydration state, as well as the interactions between substances at the molecular level affect the properties of active pharmaceutical ingredients (APIs).3 Changes in properties of APIs strongly influence the chemical stability, solubility, and finally performance of the dosage form.4 Therefore, it is considered important to understand the molecular behaviour of APIs in the solid state.5
The investigation of anion–anion complexes has attracted considerable attention in recent years. In particular, anion–anion hydrogen-bonded cluster minima in the absence of solvent have been reported and studied theoretically.6 The existence of a dissociation barrier makes these minima stable, although their overall binding energy is repulsive.6c,d Obviously, purely electrostatic forces dominate the interaction that is repulsive in the case of systems with the same charge. Recent analysis reported in the literature evidences that the nature of the [R–COOH⋯HOOC–R]2− H-bonds in these minima structures is identical to those in neutral systems in terms of geometry and attractive electrostatic contributions between the carboxylic groups embraced in the HB interaction, which are precisely responsible for the existence of such minima.7
At long distances, the repulsion between both anions is stronger than the H-bonding. However, at distances close to the sum of van der Waals radii the formation of a kinetically stable anti-electrostatic assembly is feasible. For example, phosphate aggregates have dissociation barriers as large as ∼17 kcal mol−1,6e,f thus explaining the formation of phosphate dimers [H2PO4⋯H2PO4]2− in near-saturated solutions.8 Moreover, it has been reported that hydrogen oxalate forms hydrogen bonded chains in the solid state.9 Furthermore, the X-ray structure of an anion–anion hydrogenfumarate complex that is stabilized by H-bonds and a combination of anion/lp–π interactions that is trapped between two secondary squaramide receptors has been recently reported.10 High level ab initio calculations showed that the anion–anion complex was thermodynamically unstable but kinetically stable with respect to the isolated anions with an activation barrier close to 6 kcal mol−1.
Here we report the synthesis and solid state X-ray characterization of three fentanyl citrate solid forms (1–3), see Scheme 1b. In the three structures the citrate anions form either self-assembled dimers (1,2) or an infinite 1D supramolecular chain (3) governed by H-bonded interactions. Two different types of anion–anion complexes are observed in the solid state (see Scheme 1c and d) which have been studied using DFT calculations. The kinetic stability of such anion–anion complexes has been analysed and, remarkably, they exhibit high dissociation barriers.‡
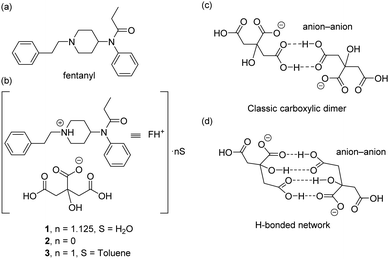 | ||
| Scheme 1 (a) Structure of fentanyl. (b) Solid forms of fentanyl citrate 1–3 reported herein. (c and d) H-Bonding patterns of the anion–anion assemblies observed in compounds 1 and 2. | ||
With the initial objective of extending the knowledge about the solid form landscape of this important drug compound, an extensive polymorph screening has been performed (ESI† contains details of the methodologies followed). As a result, six crystal forms (three anhydrous polymorphs, two hydrates and one toluene solvate) have been isolated and the crystal structures of anhydrous form I, the monohydrate and the toluene solvate have been solved by single crystal X-ray diffraction.
It should be mentioned that the X-ray structure of compound 2 was previously reported by Duchanp et al.,11 though its 3D coordinates are not available in the Cambridge Structural Database (CSD). Moreover, compound 3 (toluene solvate) was also reported;12 however, the X-ray structure reported herein is of better quality since it has been elucidated at low temperature (100 K) and exhibits a better resolution factor.
The crystal structures of fentanyl citrate salts 1 and 2 are shown in Fig. 1. Both present self-assembled citrate dimers that are connected to FH+ units by H-bonds through the piperidinylium groups. In the case of compound 1, the anion–anion complex is stabilized by two H-bonds that are formed between the carboxylic groups. In case of compound 2, the complex is stabilized by the formation of four H-bonds where two carboxylic, two hydroxyl and two carboxylate groups are involved (see Fig. 1b).
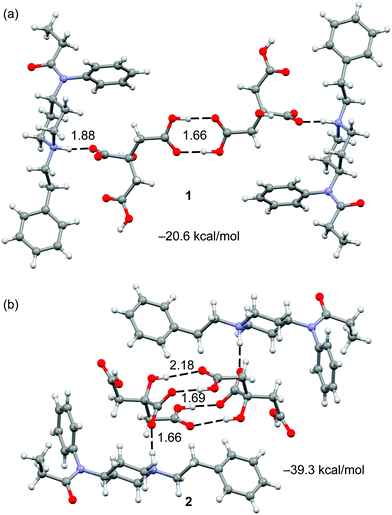 | ||
| Fig. 1 Self assembled dimers present in the X-ray structures of 1 (a) and 2 (b) with indication of the H-bond arrays. Distances in Å. | ||
The crystal structure of fentanyl citrate salt 3 is shown in Fig. 2. In this case the citrate anions form infinite 1D chains. The H-bond network that connects the citrate anions in 3 is similar to that represented in Fig. 1b for 2 (see Fig. S1, ESI†). The presence of channels formed by the fentanyl moieties that are of adequate size and shape to accommodate an infinite zigzag chain of citrate anions is remarkable (see Fig. 2c). The anions also interact with the fentanyl moieties by means of charge-assisted H-bonds with the piperidinylium groups.
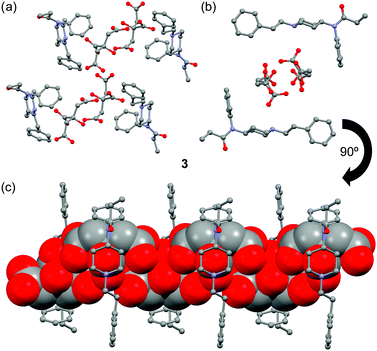 | ||
| Fig. 2 (a) Partial view of the X-ray structure of 3. (b) Detail of the channel that is formed in the crystal structure of 3. (c) Detail of the citrate chains (in spacefill format) inside the channel. | ||
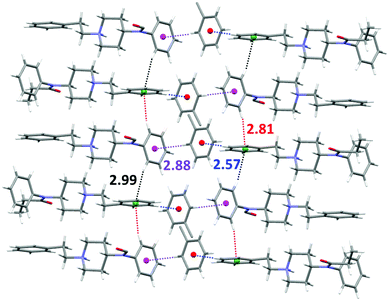
On the other hand, layers of toluene molecules establish weak CH⋯π interactions with both the aromatic rings of the fentanyl molecule in an alternate manner. Thus, the toluene molecules interact simultaneously as C–H acceptors with the benzyl ring (dH-centroid 2.57 Å) and as C–H donors (dH-centroid 2.88 Å) with the N-phenylamide ring. Moreover, the fentanyl molecules form one-dimensional self-assembled chains via C–H⋯π interactions (dH-centroid 2.81 Å and 2.99 Å). The complete network of CH⋯π interactions is shown in Fig. 3.
As aforementioned, the theoretical study has been focused on the analysis of the anti-electrostatic H-bonds that are established between the citrate anions. We have computed (see ESI† for details) the interaction energies using high level DFT calculations (PBE0-D3/def2-TZVP). Fig. 4 shows the optimized geometries of the two different anion–anion complexes present in forms 1 and 2, which are true minima in the potential energy surface (PES). Their interaction energies are also indicated in the figure. The simple COOH⋯HOOC binding mode leads to the most stable anion–anion complex that is 11.5 kcal mol−1 higher in energy than the separated monomers. The H-bonding network observed in 2, where four H-bonds are formed (see Fig. 4b), is 3.7 kcal mol−1 less favored than the classical carboxylic acid dimer binding motif (see Fig. 4a). This is mostly due to the different distance between the negative charges, which is longer in the anion–anion complex observed in 1 (dO⋯O = 12.7 Å in 1 and 5.9 Å in 2).
 | ||
| Fig. 4 Two different binding modes for the anion–anion complexes: classical H-bonding array in 1 (a) and H-bonding network in 2 (b). Distances in Å. | ||
Interestingly, when the counterions are included in the calculations, the binding energies become negative (favorable, see Fig. 1) and the assembly with the four H-bonds is significantly more favorable (18.7 kcal mol−1) than that where only the classical carboxylic acid dimer is formed. The H-bonding distances are shorter in the optimized dimers than in the X-ray structures, especially in the dimer with the H-bonding network. This is due to the fact that crystal packing effects are not considered in the calculations.
The observation of a metastable structure exhibiting positive interaction energy is only feasible if a local minimum exists in the PES along with an associated dissociation barrier that avoids the monomers to spontaneously separate. The dissociation scan plots for the two binding modes described above for compounds 1 and 2 are shown in Fig. 5. Interestingly, the dissociation barriers are large in both cases (11.8 kcal mol−1 in 1 14.1 kcal mol−1 in 2), thus suggesting a marked kinetic stability of the anion–anion citrate dimers. We have also computed the barriers taking into consideration the solvent effects (see ESI†) as recommended by Riley and Tran13 to better simulate the crystal environment and the kinetic barriers increase to 17.9 kcal mol−1 for 1 and 22.2 kcal mol−1 for 2. The kinetic stability is stronger in 2 because four H-bonds are broken in the TS. Interestingly, the C⋯C distances in the TS are very long (6.148 Å, for 1 and 8.643 Å for 2) and correspond to approximately 4 Å for the OH⋯O distance. At C⋯C distances longer than 9 Å the H-bonds are completely broken and the dissociation path converges to the imaginary curve (red dashed line) that corresponds to the potential energy of two isolated negative point charges located at the position of the carboxylate groups. At C–C distances shorter than 8 Å the dissociation path and the local minimum are situated below this imaginary curve due to the stabilization of the H-bonds.
 | ||
| Fig. 5 Dissociation path of the anionic complexes 1 (left) and 2 (right) in the gas phase (see ESI† for details). ΔE and d stand for the interaction energy and the C⋯C distance indicated in the figure, respectively. Red dashed lines correspond to the potential energy curve of two isolated negative point charges located at the position of the carboxylate groups. | ||
Finally, we have also performed an NCI plot index analysis to characterize the anti-electrostatic H-bonds in both types of dimers. The NCI plot is a useful and powerful index because it facilitates the visualization and identification of non-covalent interactions easily and efficiently.14 It is based on the peaks that appear in the reduced density gradient at low densities (see ref. 15 for a more comprehensive treatment). In essence, upon the formation of a supramolecular complex, there is a significant change in the reduced density gradient at the critical points in between molecules due to the annihilation of the density gradient at these points. Therefore, the NCI plot index assesses host–guest complementarity in supramolecular complexes efficiently. That is, it helps to visualize the extent to which noncovalent interactions stabilize a complex. The information that the NCI plot provides is fundamentally qualitative showing which molecular regions interact. The color scheme is a red-yellow-green-blue scale with red for repulsive (ρ+cut) and blue for attractive (ρ−cut). The yellow and green surfaces represent weak repulsive and weak attractive forces, respectively. The representations of the NCI plots computed for the citrate anion–anion self-assembled dimers are shown in Fig. 6. In the self-assembled dimer of 1, two dark blue isosurfaces are detected that characterize the classical COOH⋯HOOC H-bonds. Therefore, the nature of these H-bonds is strongly attractive and counteracts the electrostatic repulsion between the negative charges. This result explains the deep local minimum found in Fig. 5(left) and the kinetic stability of the dimer. For the self-assembled dimer observed in compound 2 a more complicated NCI plot representation was obtained (see Fig. 6b). As expected the COOH⋯−OOC are stronger (darker blue) than those involving the hydroxyl group (OH⋯O![[double bond, length as m-dash]](https://www.rsc.org/images/entities/char_e001.gif) C). The NCI plot also reveals the presence of an extended green isosurface (weak interaction) between the COOH groups, thus suggesting the existence of some type of π-stacking interaction between the π-systems of the COOH groups. This intricate combination of interactions (four H-bonds and π-stacking) explains the larger dissociation barrier obtained for compound 2.
C). The NCI plot also reveals the presence of an extended green isosurface (weak interaction) between the COOH groups, thus suggesting the existence of some type of π-stacking interaction between the π-systems of the COOH groups. This intricate combination of interactions (four H-bonds and π-stacking) explains the larger dissociation barrier obtained for compound 2.
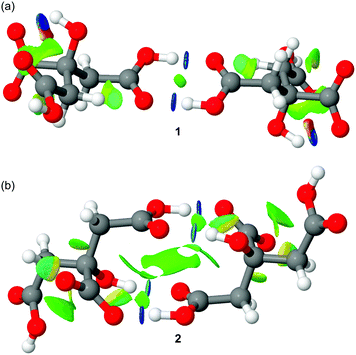 | ||
| Fig. 6 Distribution of bond critical points (CPs, green spheres) and bond paths connecting them. Intramolecular bond CPs and bond paths have been omitted for clarity. | ||
In conclusion, we have reported the X-ray structures of three fentanyl citrate salts that exhibit anion–anion complexes stabilized by H-bonds. The formation of the complexes is thermodynamically disfavored since they are higher in energy than the separated monomers (anions). However, they are kinetically stable with large dissociation barriers. Since carboxylate salts are very common in the formulation of pharmaceutical drugs, we envisage that the results published herein may be relevant, since the anion–anion interactions can help to understand some of the solid state characteristics affecting the properties of active pharmaceutical ingredients.
We thank the MINECO/AEI (project CTQ2017-85821-R FEDER funds) for financial support. A. F. thanks MINECO/AEI from SPAIN for a “Juan de la Cierva” contract. We thank Antoni Caparrós and Susana Portillo (Kern Pharma) for providing us with fentanyl citrate and Dr Mercè Font-Bardia (University of Barcelona) for X-ray measurements.
Conflicts of interest
There are no conflicts to declare.Notes and references
- R. S. Vardanyan and V. J. Hruby, Future Med. Chem., 2014, 6, 385–412 CrossRef CAS PubMed.
- N. Ogawa, T. Furuishi, H. Nagase, T. Endo, C. Takahashi, H. Yamamoto, Y. Kawashima, T. Loftsson, M. Kobayashi and H. Ueda, J. Pharm. Pharmacol., 2016, 68, 588–598 CrossRef CAS.
- (a) Y. Aso, S. Yoshioka, T. Miyazaki and T. Kawanishi, Chem. Pharm. Bull., 2009, 57, 61–64 CrossRef CAS; (b) Y. Aso, S. Yoshioka, T. Miyazaki, T. Kawanishi, K. Tanaka, S. Kitamura, A. Takakura, T. Hayashi and N. Muranushi, Chem. Pharm. Bull., 2007, 55, 1227–1231 CrossRef CAS; (c) S. Yoshioka and Y. Aso, J. Pharm. Sci., 2007, 96, 960–981 CrossRef CAS; (d) B. Rodríguez-Spong, C. P. Price, A. Jayasankar, A. J. Matzger and N. Rodríguez-Hornedo, Adv. Drug Delivery Rev., 2004, 56, 241–274 CrossRef; (e) A. Jayasankar, L. Roy and N. Rodríguez-Hornedo, J. Pharm. Sci., 2010, 99, 3977–3985 CrossRef CAS.
- K. Yamamoto, W. Limwikrant and K. Moribe, Chem. Pharm. Bull., 2011, 59, 147–154 CrossRef CAS.
- N. Ogawa, C. Takahashi and H. Yamamoto, J. Pharm. Sci., 2015, 104, 942–954 CrossRef CAS.
- (a) F. Weinhold, Angew. Chem., Int. Ed., 2017, 56, 14577–14581 CrossRef CAS; (b) T. J. Mooibroek, CrystEngComm, 2017, 19, 4485–4488 RSC; (c) A. Bauzá, A. Frontera and T. J. Mooibroek, Nat. Commun., 2017, 8, 14522 CrossRef; (d) A. Bauza, A. Frontera, T. J. Mooibroek and J. Reedijk, CrystEngComm, 2015, 17, 3768–3771 RSC; (e) S. R. Kass, J. Am. Chem. Soc., 2005, 127, 13098–13099 CrossRef CAS; (f) I. Mata, I. Alkorta, E. Molins and E. Espinosa, ChemPhysChem, 2012, 13, 1421–1424 CrossRef CAS; (g) I. Mata, I. Alkorta, E. Molins and E. Espinosa, Chem. Phys. Lett., 2013, 555, 106–109 CrossRef CAS; (h) F. Weinhold and R. A. Klein, Angew. Chem., Int. Ed., 2014, 53, 11214–11217 CrossRef CAS; (i) I. Mata, E. Molins, I. Alkorta and E. Espinosa, J. Phys. Chem. A, 2015, 119, 183–194 CrossRef CAS.
- (a) G. Frenking and G. F. Caramori, Angew. Chem., Int. Ed., 2015, 54, 2596–2599 CrossRef CAS; (b) I. Alkorta, I. Mata, E. Molins and E. Espinosa, Chem. – Eur. J., 2016, 22, 9226–9234 CrossRef CAS.
- M. K. Cerreta and K. A. Berglund, J. Cryst. Growth, 1987, 84, 577–588 CrossRef CAS.
- (a) M. Mascal, C. E. Marjo and A. J. Blake, Chem. Commun., 2000, 1591–1592 RSC; (b) P. Macchi, B. B. Iversen, A. Sironi, B. C. Chakoumakos and F. K. Larsen, Angew. Chem., Int. Ed., 2000, 39, 2719–2721 CrossRef CAS; (c) T. Steiner, Chem. Commun., 1999, 2299–2300 RSC; (d) D. Braga, F. Grepionia and J. J. Novoa, Chem. Commun., 1998, 1959–1960 RSC.
- R. Prohens, A. Portell, M. Font-Bardia, A. Bauzá and A. Frontera, Chem. Commun., 2018, 54, 1841–1844 RSC.
- D. J. Duchamp, E. C. Olson and C. G. Chidester, Am. Cryst. Association, Series 2, 1977, 5, 83 Search PubMed.
- O. M. Peeters, N. M. Blaton, C. J. De Ranter, A. M. van Herk and K. Goubitz, J. Cryst. Mol. Struct., 1979, 9, 153–161 CrossRef.
- K. E. Riley and K.-A. Tran, Faraday Discuss., 2017, 203, 47–60 RSC.
- J. Contreras-García, E. R. Johnson, S. Keinan, R. Chaudret, J.-P. Piquemal, D. N. Beratan and W. Yang, J. Chem. Theory Comput., 2011, 7, 625–632 CrossRef.
- E. R. Johnson, S. Keinan, P. Mori-Sanchez, J. Contreras-Garcia, A. J. Cohen and W. Yang, J. Am. Chem. Soc., 2010, 132, 6498–6506 CrossRef CAS PubMed.
Footnotes |
| † Electronic supplementary information (ESI) available: Experimental protocols and DFT calculation details. Crystal data for 1–3. CCDC 1877765, 1877766 and 1877768. For ESI and crystallographic data in CIF or other electronic format see DOI: 10.1039/c8cc09028a |
| ‡ Procedure for the preparation of crystals of 1–3 suitable for X-ray crystallography and DFT protocols: see ESI.† |
| This journal is © The Royal Society of Chemistry 2019 |

