 Open Access Article
Quantifying proton NMR coherent linewidth in proteins under fast MAS conditions: a second moment approach†
Alexander A.
Malär
a,
Susanne
Smith-Penzel
a,
Gian-Marco
Camenisch
a,
Thomas
Wiegand
 a,
Ago
Samoson
bc,
Anja
Böckmann
 *d,
Matthias
Ernst
 *a and
Beat H.
Meier
 *a
*a
aPhysical Chemistry, ETH Zürich, Vladimir-Prelog-Weg 2, 8093 Zurich, Switzerland. E-mail: maer@ethz.ch; beme@ethz.ch
bSchool of Information Technologies, Tallinn University of Technology, Tallinn, Estonia. E-mail: ago.samoson@ttu.ee
cNMR Institute MTÜ, Tallinn, Estonia
dInstitut de Biologie et Chimie des Protéines, Bases Moléculaires et Structurales des Systèmes Infectieux, Labex Ecofect, UMR 5086 CNRS, Université de Lyon, 7 passage du Vercors, 69367 Lyon, France. E-mail: a.bockmann@ibcp.fr
First published on 7th August 2019
Abstract
Proton detected solid-state NMR under fast magic-angle-spinning (MAS) conditions is currently redefining the applications of solid-state NMR, in particular in structural biology. Understanding the contributions to the spectral linewidth is thereby of paramount importance. When disregarding the sample-dependent inhomogeneous contributions, the NMR proton linewidth is defined by homogeneous broadening, which has incoherent and coherent contributions. Understanding and disentangling these different contributions in multi-spin systems like proteins is still an open issue. The coherent contribution is mainly caused by the dipolar interaction under MAS and is determined by the molecular structure and the proton chemical shifts. Numerical simulation approaches based on numerically exact direct integration of the Liouville–von Neumann equation can give valuable information about the lineshape, but are limited to small spin systems (<12 spins). We present an alternative simulation method for the coherent contributions based on the rapid and partially analytic calculation of the second moments of large spin systems. We first validate the method on a simple system by predicting the 19F linewidth in CaF2 under MAS. We compare simulation results to experimental data for microcrystalline ubiquitin (deuterated 100% back-exchanged at 110 kHz and fully-protonated at 125 kHz). Our results quantitatively explain the observed linewidth per-residue basis for the vast majority of residues.
Introduction
Due to technological and conceptual advancements over the past two decades, solid-state NMR spectroscopy has become an important technique in structural biology.1–6 Most of these studies have used 13C detection, but recent improvements in magic-angle spinning (MAS) lead to sufficiently narrow proton-resonance lines in order to obtain high spectral resolution of perdeuterated and full back-exchanged and also fully-protonated proteins.7–15 Still, even at the fastest spinning frequencies available today, the dipolar interaction is not perfectly averaged out, and the resonance lines are, at least for small proteins, broader than in solution state.16 The limits of spectral resolution remain, therefore, an open question.17–22It is well-known23,24 that the total linewidth Δtot of a peak, measured as full width at half maximum (FWHM) can be separated into different contributions. For protons in proteins and organic solids we distinguish: (i) the coherent contribution Δcoh, which is described by the spin-system Hamiltonian and arises largely due to homonuclear dipolar couplings as well as isotropic and anisotropic chemical shifts; (ii) the incoherent contribution Δincoh due to stochastic processes (relaxation and chemical exchange); (iii) the inhomogeneous contribution Δinhomo which arises from sample and magnetic field heterogeneities. The first two can be reduced by increasing the MAS frequency νr and are usually collected under the term homogeneous linewidth Δhomo. The third one can only be influenced by sample preparation techniques, probe design or shim coil currents. In summary we can write
| Δtot(νr) = Δhomo(νr) + Δinhomo = Δcoh(νr) + Δincoh(νr) + Δinhomo | (1) |
In this work, we present an alternative approach, which computes analytically or semi-analytically the linewidth using a moment expansion. This approach goes back to the moment expansion formulas derived by van Vleck.37,38 Such a moment expansion has later been used both in solution-state NMR39 and in solid-state NMR. In solids, it has been used to analyze the CaF2 lineshape with a high precision.40 It has been proposed that in combination with slow spinning it could be used to extract chemical-shift tensor information from resolved sideband structure41 and it was used in more recent times for REDOR curve fitting42 and as a systematic tool for NMR powder pattern analysis, in particular in the field of material sciences.43,44 In a related approach “effective dipolar couplings” for given sites have been calculated instead of second moments, and it has been shown that the two measures are proportional.19 Applications of the van Vleck approach for MAS have been discussed by Brunner et al., Zorin et al. and Schnell and Spiess.19,45–48
Here we adapt the method of moments to proton linewidth calculations in proteins in the fast spinning limit where the isotropic chemical-shift differences are larger than the remaining dipolar linewidth for the majority of the (coupled) spins, leading to a well-resolved proton spectrum. We will use the van Vleck formula in combination with second-order Floquet theory to derive analytical expressions for second moments of a homonuclear dipolar-coupled three-spin system under MAS, which can afterwards be used to predict second moment and linewidth for each individual resonance.
We will validate the approach, by comparing to experimental results for CaF2 and apply the method to deuterated (and fully back-exchanged) and fully-protonated (UL) ubiquitin where the homogeneous contribution from residual dipolar couplings has been shown to dominate the linewidth.15 The proton network is very different between the two protein samples. In the deuterated (and 100% back-exchanged) case it is significantly diluted, since only HN protons and exchangeable sidechain protons are present, which has a strong impact on the coherent linewidth.
The paper is organized as follows: (i) a theoretical section (“Theoretical concepts (I)–(IV)”), where we introduce the second-moment approach under MAS for the purely-dipolar case, validate it on CaF2, extend it to include the effects of chemical shifts and compare its site-specific predictions with analogous results, using standard Liouville–von Neumann-based methods on ubiquitin. (ii) An experimental application section (“Results and discussion (I) and (II)”), where we apply the method to quantify the coherent linewidth for ubiquitin and compare it to experimental results. Combining these findings with an estimation of incoherent contributions, obtained from experimental relaxation measurements, the goal of this section consists in gaining further quantitative insight into the different linewidth contributions for a model protein.
Theoretical concepts
(I) Analytical calculation of second moments for the pure dipole case
For proton-detected protein spectra, the experimental spectral line is often close to a Lorentzian or Gaussian and will, in the following, be approximated by a Gaussian line. In this case, the spectral lineshape of spin k, S(ωk), is fully characterized by the second moment M2:38 | (2) |
 | (3) |
 | (4a) |
 both as the initial density operator and detection operator.
If all NI spins are equivalent, the double sum in eqn (4a) can be reduced to:49
 | (4b) |
Under sample spinning the Hamiltonian of eqn (4a) becomes time dependent and can be expanded in a Fourier series:
 | (5) |
 are the Fourier coefficients of the Hamiltonian. In order to calculate analytical expressions for M2, we replace the time-dependent Hamiltonian by an equivalent time-independent second-order effective Hamiltonian
  , which can be calculated based on average Hamiltonian theory50 or Floquet theory:51–53
 | (6) |
The Fourier expansion of the dipolar Hamiltonian of a homonuclear three-spin system under magic-angle spinning is
 | (7) |
 ,
,  , and
, and  between the non-commuting interactions need to be considered. The same considerations are valid for other terms
  . The spatial components ω(n)kq are calculated by sequential coordinate transformations from the principal-axis systems (PAS) of the dipolar couplings into the rotor-fixed frame (MAS) into the laboratory frame (LAB), using Wigner rotation matrices
  .
. | (8) |
 , which transforms the PAS value of one dipolar interaction, into the PAS system of the second interaction. Here θkq,kj denotes the opening angle between the two dipolar couplings, which can be calculated by means of the scalar product between the inter-spin vectors
 ![[r with combining right harpoon above (vector)]](https://www.rsc.org/images/entities/i_char_0072_20d1.gif) kj of the interactions
kj of the interactions | (9) |
 | (10) |
(II) Validation on calcium fluoride (CaF2)
Calcium fluoride was frequently used for the validation of moment-based linewidth simulation approaches and contains magnetically equivalent 19F nuclei arranged in a simple cubic lattice. The second moment of static CaF2 single crystals has been calculated in the original van Vleck paper and found to coincide well with experimental measurements.37,55 We have measured a set of CaF2 spectra for a powder sample at MAS frequencies ranging from 8 to 55 kHz and extracted their respective linewidths using a Gaussian fit (blue squares in Fig. 2). We now use the approach explained in the previous section to obtain the analytical powder-averaged expressions for the total second moment Mkqj2 of a three-spin system in frequency units squared (Hz2). Using a symbolic mathematical program (Mathematica, Wolfram, Champaign, USA), we obtain: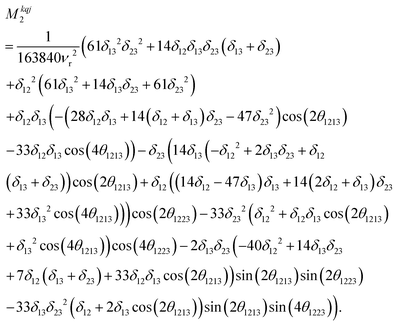 | (11) |
 is the anisotropy of the dipolar coupling where the factor of 2π comes from the conversion of angular frequency to frequency. Summing over all possible three-spin systems and dividing by the number of resonant spins NI yields the second moment:
 | (12) |
 | (13) |
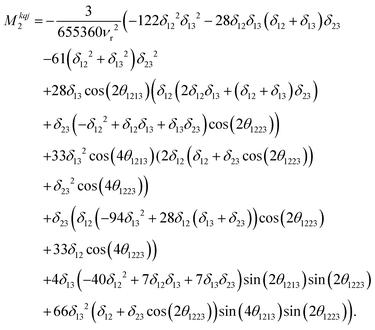 | (14) |
 | (15) |
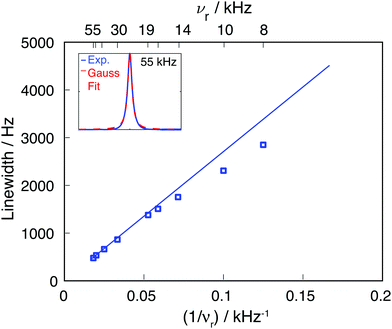 | ||
| Fig. 2 Comparison of experimental 19F CaF2 linewidth as function of the MAS frequency (blue squares) and the linewidth obtained by using an M2(FxIkx) approach (blue line). The inset shows the experimental line at 55 kHz MAS and the corresponding Gaussian fit (the fits for the remaining MAS frequencies are given in Fig. S1, ESI†). | ||
Calculating Mk2(FxIkx) for the central 19F spin in the CaF2 crystal containing 12 × 12 × 12 unit cells, leads to the blue curve in Fig. 2, which agrees well with the experimental data. The somewhat larger deviations between experimental and simulated νr dependence of the linewidth at slow spinning frequencies arise from the fact that the Gaussian fit of the experimental 19F line is biased by an increased overlap between center-band and spinning sidebands (as it can be seen in Fig. S1, ESI†).
(III) Inclusion of isotropic chemical-shift information in the M2 simulations
Since the isotropic chemical-shift term is not modulated by the MAS rotation it can be simply added to the effective Hamiltonian, leading to . We neglect contributions to the second moment by the chemical-shift anisotropy (CSA) and heteronuclear dipolar-coupling terms, as well as by heteronuclear dipolar/CSA homonuclear dipolar cross terms. Indeed, heteronuclear couplings and CSA terms are inhomogeneous interactions41 and can be neglected for fast spinning as they lead to sharp sidebands outside the window considered, whereas their cross terms with homonuclear dipolar couplings might have a significant contribution for large heteronuclear dipolar couplings/CSA (larger than the ones generally observed in the systems considered here), and are harder to evaluate in practice, since information about CSA tensor orientation is required.
The signal S(ω) under combined dipole and isotropic shift Hamiltonian can be calculated for a particular set of Euler angles (α,β,γ) by numerically diagonalizing it's matrix representation according to ![[H with combining tilde]](https://www.rsc.org/images/entities/i_char_0048_0303.gif) = V†HDD+CSV, where
= V†HDD+CSV, where ![[H with combining tilde]](https://www.rsc.org/images/entities/i_char_0048_0303.gif) denotes the diagonalized Hamiltonian. The intensities and the frequencies of the transitions of spin k in the eigenbase of the Hamiltonian are given by Iil = (
denotes the diagonalized Hamiltonian. The intensities and the frequencies of the transitions of spin k in the eigenbase of the Hamiltonian are given by Iil = (![[F with combining tilde]](https://www.rsc.org/images/entities/i_char_0046_0303.gif) kx)il(
kx)il(![[F with combining tilde]](https://www.rsc.org/images/entities/i_char_0046_0303.gif) kx)li and ωil =
kx)li and ωil = ![[H with combining tilde]](https://www.rsc.org/images/entities/i_char_0048_0303.gif) ii −
ii − ![[H with combining tilde]](https://www.rsc.org/images/entities/i_char_0048_0303.gif) ll, respectively. Here,
ll, respectively. Here, ![[F with combining tilde]](https://www.rsc.org/images/entities/i_char_0046_0303.gif) kx represents the Fkx operator in the eigenbase of the Hamiltonian.
kx represents the Fkx operator in the eigenbase of the Hamiltonian.
The second moment M2 relative to the isotropic chemical shift of the spin of interest k is calculated from the (stick) spectrum as23
 | (16) |
In the weak-coupling case (effective couplings smaller than the chemical-shift difference of the coupled spins), it is thus possible to sort out dipolar-split transitions belonging to spin k. With intermediate and strong couplings, this is no longer the case. The strong-coupling regime applies if the transitions of spin k overlap with transitions of another resonance, which is, in addition, strongly coupled to k. In such a case, the calculation of individual linewidths of different spins becomes meaningless. However, under fast MAS conditions (νr ≥ 100 kHz), the weak coupling approximation requires that the dipolar-coupled spins have a chemical-shift difference exceeding 0.05–0.1 ppm. Fig. S2 in the ESI† shows that at 110 kHz MAS, the majority of spins in deuterated 100% back-exchanged ubiquitin lies in the weak-coupling regime and only 966 out of 150![[thin space (1/6-em)]](https://www.rsc.org/images/entities/char_2009.gif) 348 three-spin systems (0.6%) fall into the intermediate coupling regime, where the chemical-shift inclusion may be biased. Note that the statistics is not expected to get worse for larger proteins because only spins in the immediate neighborhood can lead to strong coupling effects.
348 three-spin systems (0.6%) fall into the intermediate coupling regime, where the chemical-shift inclusion may be biased. Note that the statistics is not expected to get worse for larger proteins because only spins in the immediate neighborhood can lead to strong coupling effects.
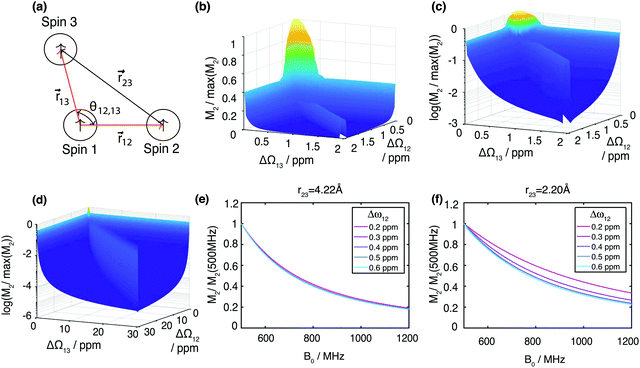
Calculating the local second moment and performing a numerical powder average over the Euler angles (α,β,γ) gives a scaling factor  for the reduction of a given three-spin second moment contribution due to the chemical-shift offset effect. The corresponding scaling of the second moment for a three-proton system with the spatial geometry (r12, r13, r23) = (2.79 Å, 2.85 Å, 4.23 Å) as function of the chemical-shift differences ΔΩ12, ΔΩ13 is shown in Fig. 1(b–d). We observe a significant reduction in the second moment of the line of spin one for non-vanishing chemical-shift differences compared to the case of no chemical-shift differences, which is more pronounced if the two passive spins two and three are also spectrally separated from each other. Such findings are in agreement with Liouville–von Neumann (LvN) simulations both for three- and for five-spin systems (see examples in Fig. S3, ESI†) and have also been noticed by Brunner et al.46 Within the above geometry and setting ΔΩ13 = 0.3 ppm, we obtain ε = 0.14 (for ΔΩ12 = 0.01 ppm) and ε = 0.04 (for ΔΩ12 = 1 ppm) for a Larmor frequency of 850 MHz. In the case where both ΔΩ12 and ΔΩ13 are very large (in the order of MHz) we find ε ≈ 0 (extreme weak coupling/heteronuclear case).
For increasing magnetic field strength, we expect a stronger truncation of the dipolar couplings. This is illustrated in Fig. 1(e), which shows the magnetic-field dependence of the second moment, simulated for Larmor frequencies between 500 MHz to 1200 MHz, for the same geometry and ΔΩ13 = 0.8 ppm. We observe the expected linewidth decrease with increasing field. Fig. 1(f) shows the same dependence for a stronger coupled geometry (r23 = 2.20 Å). In particular we notice that the improvement with higher fields gets less steep the stronger the couplings are compared to chemical-shift differences (in particular refer to the ΔΩ13 = 0.2 ppm curve).
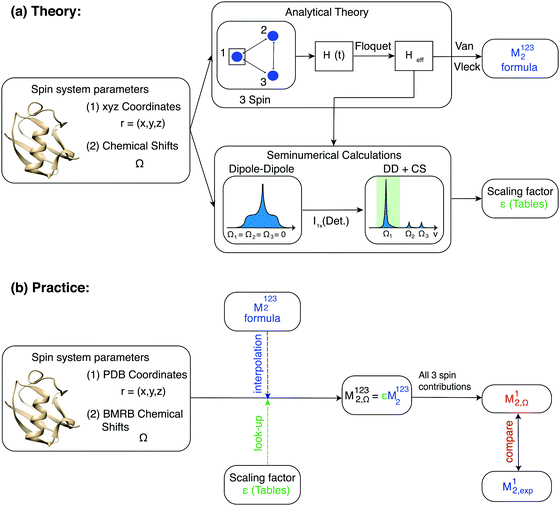
For numerical efficiency we pre-calculated the scaling factors ε obtained by numerically diagonalizing the three-spin effective Hamiltonian as a function of the parameters (r12, r13, θ12,13, ΔΩ12, ΔΩ13) (see Material and methods). A schematic overview of the second moment approach is given in Fig. 3.
(IV) Numerical results and comparison to brute-force Liouville–von Neumann simulations on ubiquitin
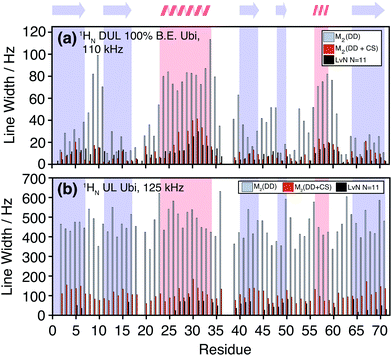
The M2 method is computationally much less demanding than exact LvN calculations as the calculation does not involve the diagonalization of many-spin matrices. For deuterated 100% back-exchanged ubiquitin, the simulated residue-specific linewidths obtained by summation over one protein molecule can be obtained in less than a minute on a laptop computer and even the simulations for the fully-protonated protein do not require more than ten minutes. The presented results have been obtained by including the 200–250 spins closest to the spin-of interest (usually lying within a sphere of 10 to 12 Å), within a calculation time of 15–20 minutes on a laptop. As a comparison, the numerical integration of the LvN equation for N = 12 spins take approximately 17–18 hours, even being fully parallelized for the powder average loop (537 orientations) and distributed over 12 processors (Intel Xeon E5-2680v3 2.5–3.3 GHz, Matlab version 9.1). Furthermore, the M2 simulations only require the explicit construction of spin matrices for a three-spin system, while constructing the ε table, so no particular memory requirements arise. Convergence tests for M2 as a function of the number of spins are described in Fig. S3 and S4 (ESI†). In the deuterated case, we need to consider a sphere with rs ≈ 5–10 Å (6–10 spins), while in the fully-protonated case rs needs to be around 5–6 Å, which corresponds already to 30–60 spins.Fig. 4 shows a comparison between the linewidth obtained by site-specific second-moment analysis with and without chemical-shift terms, and LvN simulations for the HN protons in deuterated 100% back-exchanged ubiquitin at 110 kHz MAS (Fig. 4(a)) and fully-protonated ubiquitin at 125 kHz MAS (Fig. 4(b)). For the deuterated molecule, the exchangeable side-chain protons were not included (vide infra). For the LvN approach N = 11 spins were used in the simulations: inclusion of an additional spin broadens the linewidths by only a small amount (increasing N might however still have an effect on the lineshape).
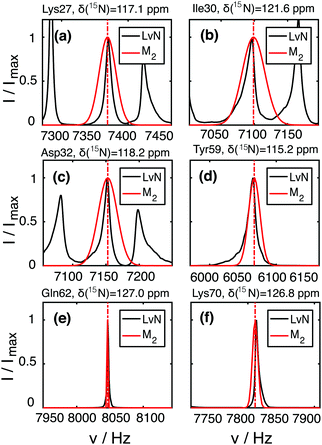
In the deuterated case, LvN and M2 + CS simulations agree in general trends and magnitude over the entire protein with some deviations in one or the other direction. The pure dipolar M2 are, in all cases, significantly larger than the LvN and are clearly not suited for predictions in proteins. The linewidth is extracted from the LvN calculations by direct fitting of the simulated spectral line with a Gaussian model. When the numerically calculated line is broad, the corresponding peak becomes often asymmetric and a simple Gaussian or Lorentzian fit is not adequate (see examples in ESI,† Fig. S6). Situations in which the LvN linewidths are narrower than the M2 + CS linewidths could hint that not enough spins have been included in the former approach. Fig. S8 in the ESI† shows a comparison of second moments obtained by M2, M2 + CS simulation and by extracting it from the spectral lineshape of the numerical LvN spectra. Overall, we notice a good agreement between linewidths obtained by a Gaussian fit and by calculating the second moment from the simulated spectra. Even though, M2 and LvN-calculated second moments agree reasonably well, we note that the LvN lineshapes are often not Gaussian and asymmetric (Fig. 5 and Fig. S6, ESI†), in contrast to those obtained from an M2 approach, which are by definition Gaussian and symmetric as also typically observed in experiments (vide infra). The asymmetry seems to decrease and the linewidth to increase, the more spins are considered (Fig. S7, ESI†) and might vanish if many more spins could be included into the LvN calculation (though this cannot be verified due to the lack of computation power). It is, however, well known that the effect of spin diffusion, a many-body effect not easily described in smaller spin systems,56 has a considerable effect on lineshapes even in the fast-spinning regime.57 Furthermore, as shown in ref. 19 asymmetry can also arise as a consequence of the “termination” of small spin system clusters and lineshapes become symmetrical if the network is “closed” such that there are no edges.
In the fully-protonated case, M2 and LvN simulations do not agree so well with the LvN lines always being significantly narrower. Using the results from the M2 convergence tests (vide supra), this behavior is most likely attributable to not considering enough spins to reach convergence in the calculation. Fig. 4 also shows the large effect that the inclusion of chemical shifts has on the predicted linewidths, both in the deuterated and in the UL case. In fact, as it is shown in Fig. 1(b), Fig. S2 and S3 (ESI†), as soon as spins are slightly detuned (0.05–0.1 ppm chemical-shift difference), most ubiquitin spins fall into a weak-coupling regime under fast MAS conditions, where chemical-shift scaling factors are smaller than 0.1. This is also illustrated in the scatter plots in Fig. S9 (ESI†), which shows how the pairs (M2,ε) are distributed in the deuterated and fully-protonated case.
Results and discussion
(I) Deuterated 100% back-exchanged ubiquitin at 110 kHz MAS
Fig. 6 shows a comparison between the experimental site-specific homogeneous linewidths (T2′) of the HN protons in deuterated 100% back-exchanged ubiquitin at 110 kHz MAS and the results from M2 simulations with chemical-shift inclusion. First of all, one may notice that the second moment method is able to predict in general qualitative and quantitative experimental trends surprisingly well without using any adjustable parameters. The simulations tend to give for most residues linewidths, which stay below the experimental ones, leaving room for additional line broadening effects (vide infra for further quantitative details). Coherent contributions are higher within α-helices and loop regions, compared to β-sheets, as noticed earlier.11 Convergence of the M2 method is reached by inclusion of all spins within a sphere of ca. 10 Å. In Fig. S10 (ESI†) we show the MAS dependence of the simulated coherent linewidth for a selection of representative residues. In agreement with an extrapolation from previously documented experimental findings for deuterated 100% back-exchanged ubiquitin, MAS frequencies of ∼300 kHz are required to reach amide proton linewidths comparable to those of a solution-state NMR sample (6–9 Hz).15 These results are also in agreement with similar documented results obtained by simulations for selectively methyl-labeled proteins.21 It should be noted that larger proteins have broader solution linewidth due to slower rotational tumbling.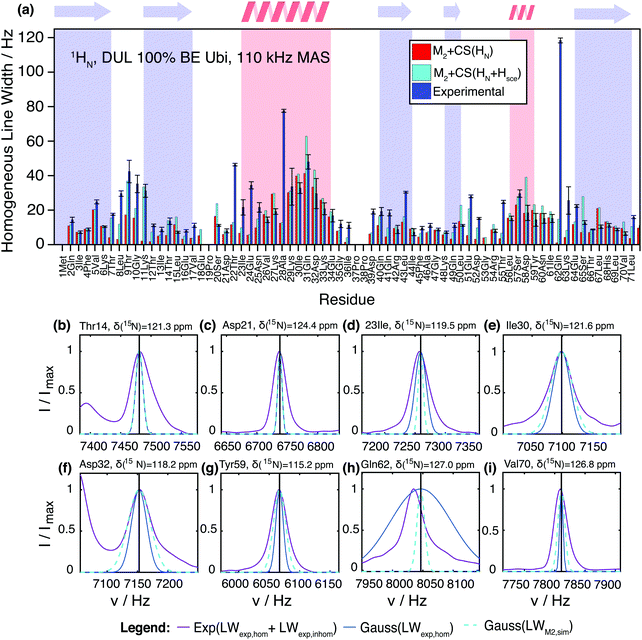 | ||
| Fig. 6 (a) Comparison of the experimentally-determined site-specific homogeneous linewidths (blue) in deuterated 100% back-exchanged ubiquitin at 110 kHz MAS and corresponding coherent linewidths obtained from the M2 simulations including chemical-shift effects (red). The cyan bars show the estimation of the coherent linewidth, if in addition to the amide protons also side-chain protons from exchangeable groups are taken into account. In general, these side-chains protons need to be considered unless they exchange with rate constants faster than the inverse of the dipolar coupling. In such a situation, “self-decoupling” of these side-chain protons would occur and these particular protons need not to be considered. (b–i) Comparison of the total (homogeneous + inhomogeneous) experimental (solid purple) lineshape and simulated coherent M2 (dashed cyan) linewidth represented by a Gaussian line for a selection of residues in deuterated 100% back-exchanged ubiquitin at 110 kHz (exchangeable side-chain atoms included in the analysis). Note that the shown experimental peaks are broader than the homogeneous linewidth given in Fig. 6(a), due to sample and magnetic-field inhomogeneities (a comparison between homogeneous and inhomogeneous linewidths is given in Fig. S12, ESI†). To give an impression of the size of the homogeneous contribution to the experimental linewidth, we plot as well a Gaussian with the FWHM as obtained from the site-specific T2′ measurements (solid blue), even though this of course does not correspond to the real experimental lineshape. | ||
Though the Gaussian assumption for the lineshape is a crude approximation, we can see from Fig. 6(b–i) that in many cases, it reproduces the experimental lineshape quite well. There are a few situations in which the M2 simulated linewidth slightly (e.g., residues Leu15, Ser20, Val26, Ile30, Lys33, Asp58, Val70), or for residues Lys27 and Leu67 even significantly, exceeds the experimental linewidth. This could be due to imprecisions in the HN coordinates of the PDB structure, which are introduced into the X-ray structure by molecular dynamic minimization (Fig. S13, ESI†). Another explanation could be fast dynamics that partially averages the dipolar interaction.
So far, we have neglected the exchangeable side-chain protons in the M2 calculations, which are in principle present in the experimental sample, due to exchange processes with the crystal water molecules, which are an essential part of the hydrated ubiquitin crystal. It is not entirely clear if such protons (namely those of hydroxyl, carboxyl, and amide groups) need to be considered for the calculation. In principle, one would have to include them in the M2 calculations; however, in the case of fast chemical exchange with water (fast compared to the dipole coupling), the exchange process decouples the interaction and the protons should not be included in the M2 calculations. In the intermediate exchange regime, more complex lineshape effects may appear. Therefore, two sets of residue-specific M2 values were calculated, one with and one without the exchangeable side-chain protons. Adding the Ser-OH, Thr-OH, Tyr-OH, His-NH, Asn-NH2, Gln-NH2, Arg-NH2, Lys-NH3 side-chain protons to the M2 calculation and assuming slow exchange leads to the cyan bars in Fig. 6. For some residues, this leads to a significant contribution to the coherent linewidth. In particular, we notice that for Thr7(7), Thr9(9), Lys11(12), Asn25(25), Gln41(41), Asp52(27), Glu51(59), Glu64(65), Leu71(40) it could be a reasonable explanation for most of the previously missing linewidth. (The number in parenthesis indicates the residue number of the spatially closest Hsce for each HN; Section S8 in the ESI† gives a systematic overview over HN and Hsce distance distributions.) In a few cases, namely Ser20(20), Gln31(41), Leu50(59), Asp58(55), Ser65(65), adding exchangeable side-chain protons leads to an overestimation of the linewidth for deuterated ubiquitin. The reasons could be fast exchange with solvent water or errors in side-chain proton coordinates, since these coordinates are difficult to predict.
Fig. 7(a) quantifies the remaining discrepancies between simulation and experiment. For 34 residues, the predicted coherent linewidth using M2 + CS simulations on all HN protons differs by less than 10 Hz from the experimental value. In 15 cases, including HN + Hsce contributions leads to deviations smaller than 10 Hz. In 6 cases the inclusion of Hsce makes the prediction worse than in the simple HN case. Finally, 10 outliers remain, where prediction and measurement differ by more than 20 Hz.
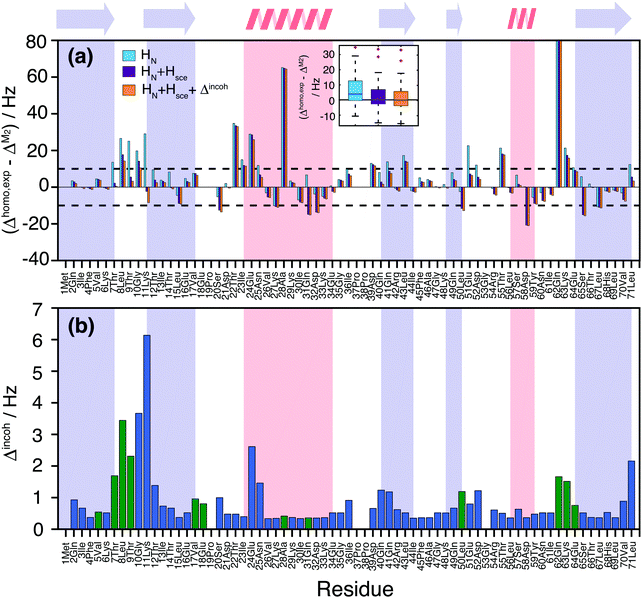 | ||
| Fig. 7 (a) Site-specific difference between experimental and M2 predicted linewidths for the deuterated 100% back-exchanged ubiquitin considering all HN (light blue), HN + Hsce (violet), HN + Hsce and the incoherent contributions plotted in part (b) (orange). The black dashed horizontal lines mark the ±10 Hz deviance limits, the inset contains boxplots illustrating the spread of the simulation vs. experiment deviations for all three simulated cases; (b) incoherent contributions Δincoh estimated from experimental order parameters and correlation times, solving a stochastic LvN equation for a two-site hop model (see Materials and methods section). Blue bars have been obtained from the available literature data,58 while green bars have been obtained from the previously missing experimental values that we measured in this work (Fig. S16 and S17, ESI†). | ||
We neglected until now incoherent contributions, as they are generally small in ubiquitin,58,59 with the notable exception of few amino acids. In order to explicitly consider incoherent contributions to the linewidth, one can estimate them using order parameters and correlation times from 15N R1ρ(νr) relaxation data. Part of the data was taken from the literature,58 and completed with additional measurements of missing residues (see Materials and methods and Fig. S16 and S17 in ESI†). One can observe an enhanced relaxation contribution to the expected linewidth in the first loop region Thr7, Leu8, Thr9, Gly10, Lys11, Thr12, at the beginning of helix one, and in the last loop. Estimated incoherent contributions are on the order of 2–6 Hz (Fig. 7(b)), which can explain some of the missing linewidth for these residues.
It should be noted that additional dynamic processes can be present, which lead to a further modulation of the dipolar interaction and/or the isotropic chemical shift59 and which are not considered in the incoherent contribution of Fig. 7(b). In particular, it is known that residues Thr9, Ile23, Asn25, Lys33, Thr55, and Val70 undergo chemical exchange between two conformations.60,61 This could account for the faster relaxation rates observed for residues Thr22, Ile23, Glu24 and Thr55. Gln62 is somewhat separated but at the other end of a loop contacting the exchanging region. It has the broadest experimental homogeneous linewidth but is one of the narrowest resonances in the simulation (Fig. 5(c) and 6). Still the broadening observed seems too large to be explained by the isotropic chemical exchange effect. The additional contributions to the lineshape of residues Ala28, Asp39, Leu43, and Lys63 remain unexplained at this point in time.
Finally, Fig. 8 presents a summary of our current understanding of deuterated (100% back-exchanged) ubiquitin linewidths, based on coherent effects from HN, HN + Hsce and shows in red the ten cases where additional effects need to be considered.
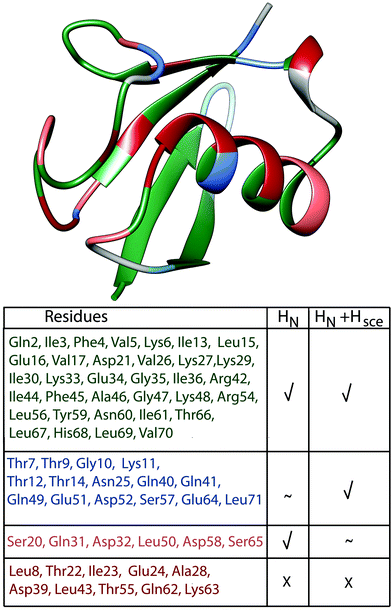 | ||
| Fig. 8 Classification of ubiquitin residues in groups and their location on the crystal structure. The classification is based on the bars in Fig. 7(a), residues have been classified as “explained”, when experimental and simulated values deviate by less than 10 Hz. Residues where we can explain the linewidth by coherent effects (HN) are marked in green (absolute value of light blue bars ≤10 Hz); residues where the inclusion of exchangeable side-chain protons explains the missing linewidth or substantially improves the deviance between experiment and simulation compared to the HN case are marked in blue (HN + Hsce, absolute value of violet bars ≤10 Hz, while for the light blue bars it is ≥10 Hz or the simulation improves compared to the HN case by more than 3 Hz); residues, where including side-chain protons is detrimental are marked in light pink (absolute value of light blue bars ≤10 Hz and of the violet bars ≥10 Hz). Residues where we cannot explain the linewidth are marked in red (absolute value of all 3 bars in Fig. 7(a) ≥10 Hz). | ||
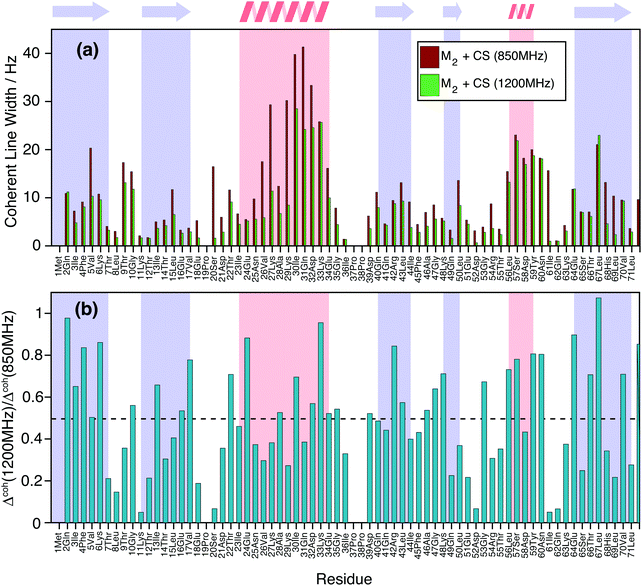
Finally, Fig. 9(a) shows how the simulated coherent ubiquitin HN linewidths could still profit from a higher magnetic field (Larmor frequencies of 1200 MHz vs. 850 MHz) due to the larger spectral separation (see also Fig. 1(e and f)). Each site shows a different improvement (Fig. 9(b)), since the steepness of the curve encoding the ratio between the second moment at different fields depends on the parameters of the individual three-spin systems contributing to the linewidth (Fig. 1(e and f)). On average we observe a decrease of around 50% in the simulated homogeneous linewidths between these two fields.
(II) Fully-protonated ubiquitin at 125 kHz MAS
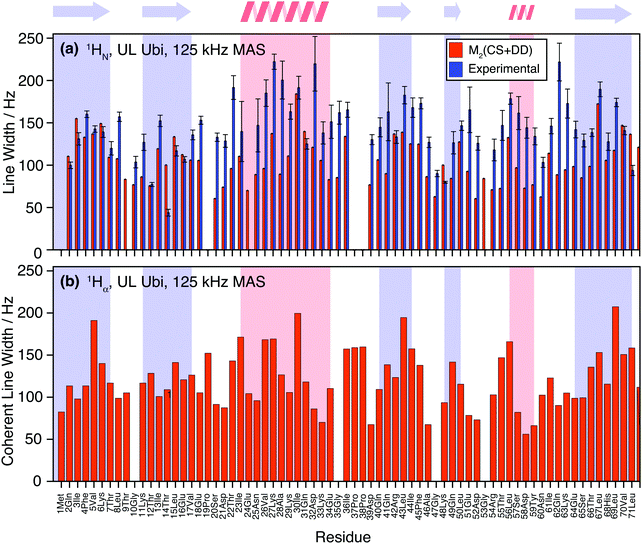
Fig. 10(a) shows the comparison between the homogeneous experimental linewidth (T2′) and the simulated coherent contributions to the linewidth for fully-protonated ubiquitin at 125 kHz MAS. Here the exchangeable side-chain protons are always included in the calculations. Still “self -decoupling” of some resonances through exchange may take place but such effects are expected to be minor due to the large number of non-exchangeable protons in fully-protonated molecules. In general, the M2 simulations are able to predict the order of magnitude and general behavior of the experimental linewidth fairly well. Simulated data for the HA resonances are provided in Fig. 10(b). The predicted linewidths are similar than for the amide protons.Fig. 11 quantifies the differences between experimental and predicted coherent contribution for the fully-protonated case. The absolute deviations are larger than in the deuterated case, but the relative errors are mostly below 50%. The average deviation over the whole protein is around 38 Hz at an average linewidth of 99 Hz. It is important to note that in the fully-protonated case homonuclear 1H–1H dipolar couplings give a stronger contribution to not only the coherent but also the incoherent proton linewidth than for the perdeuterated case. Therefore, the interpretation in terms of dynamics is more complicated.62 Most simulated linewidths tend to lie below the experimental result with a few exceptions like Gln2, Lys6, Thr14, Leu15, Gln31, Lys48, Leu71. The discrepancies between simulated and experimental linewidth could be attributed to: (i) errors in the proton coordinates; (ii) lack of information on chemical shifts of side-chain protons. Since not all side-chain proton chemical shifts are known, the missing chemical shifts have been replaced by the average BMRB chemical shifts leading to degenerate chemical shifts; (iii) slow motions within the molecule can lead to additional line broadening; (iv) the incoherent contribution of 1H–1H interactions.
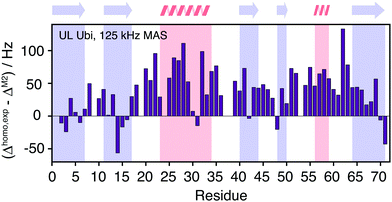 | ||
| Fig. 11 Site-specific difference between experimental and calculated linewidths for fully protonated ubiquitin. | ||
Conclusions
In this work we presented an efficient simulation method for predicting coherent proton linewidths in proteins in MAS solid-state NMR under the assumption of a Gaussian lineshape. The method is based on semi-analytical second-moment calculations. The residual linewidth contribution evaluated here arises from second-order homonuclear dipolar interactions, which are significantly truncated by isotropic chemical-shift differences. The calculation of M2 is computationally much less expensive than standard simulation methods based on numerical integration of the LvN equation, and can easily be evaluated until convergence is reached, which makes it suitable for studying biological macromolecules, also in their fully protonated form. The simulated linewidths agree very well with the experimental linewidth in deuterated 100% back-exchanged and also rather well in fully protonated UL ubiquitin. The simulations indicate that the presence of back-exchanged side-chain protons is a significant source of coherent line-broadening in deuterated proteins. The broadening by incoherent relaxation effects is estimated as less than 6 Hz in ubiquitin (calculated based on T1ρ data given in ref. 58) and significantly below this value for most residues (for details on the calculation refer to the Materials and methods section). For ten out of the 68 studied residues, the experimental lines are significantly broader than predicted, for two, Ala28 and Glu62 an additional broadening exceeding 50 Hz is detected. It is important to stress that the dipolar couplings are very sensitive to the positioning of the protons particularly in CH2 groups.19 Thus atomic resolution structures are mandatory and even if these are available, further optimizations of proton coordinates and standardization of distances might improve calculations. As we showed in this work, simulated linewidths are also strongly dependent on the chemical-shift differences in particular when the effective couplings come into the order of magnitude of the chemical-shift differences of the coupled spins. Such strong coupling cases are rare in deuterated proteins but could become prominent in materials containing CH2 groups (small distances and almost degenerate chemical shifts).Because of the low computational cost and the good convergence, the second-moment method can be used for predicting and understanding the coherent contribution to proton linewidths under fast magic-angle spinning in biological systems, drugs and organic and inorganic materials. It allows to identify spots where interesting additional coherent contributions exist. In cases where the simulated contribution strongly deviates from its experimental counterpart, it shows that the dipolar coupling network alone is not strong enough to fully explain the width of the proton resonance and other effects (e.g. incoherent or exchange) contributions need to be considered and investigated.
Materials and methods
(I) Sample preparation
Two different samples of [13C,15N] uniformly-labeled ubiquitin have been prepared. The first one is perdeuterated and has 100% back-exchanged amide protons, the second one is fully protonated. Ubiquitin was overexpressed in E. coli using deuterated 13C glucose and D2O for the perdeuterated form and purified as described in ref. 63. It was crystallized in H2O in the presence of protonated 2-methyl-2,4-pentanediol (MPD), following the procedure described in ref. 64 and 65.(II) NMR spectroscopy
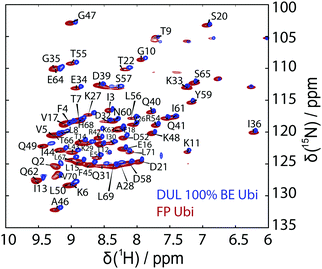
19F MAS NMR experiments were performed at 11.7 and 14.1 T using 1.3 mm (the MAS frequency was varied between 30.0 and 55.0 kHz) and 3.2 mm triple resonance probes (the MAS frequency was varied between 8.0 and 19.0 kHz), respectively. The 3.2 mm probe was equipped with a home-built 19F/27Al insert. The spectra at 14.1 T were recorded with the EASY background suppression scheme.66 The relaxation delay was set to 5 s and the 19F rf field strength was set to 100 kHz.Solid-state NMR site-specific T2′(1H) experiments have been recorded at a magnetic field strength of 20 T (corresponding to a proton Larmor frequency of 850 MHz) and at magic-angle spinning frequencies of 110 kHz (0.7 mm triple-resonance Bruker probe) for the deuterated 100% back-exchanged protein and at 125 kHz MAS (0.6 mm triple-resonance probe) for the fully-protonated protein. The magic angle has been set according to the on-sample method described in ref. 67. These T2′ experiments have already been described in detail11 and consist of a series of eight HN correlation spectra with an additional Hahn echo refocusing pulse on protons with variable delay. The residue-specific peak intensities in the relaxation curve have been fitted with the open-source software INFOS68 to extract the T2′ relaxation times. Latter have then been converted into homogeneous proton linewidths (FWHM) given by 1/(πT2′), which we refer to as the (homogeneous) experimental linewidths. We compare the simulation results in this work to those obtained from T2′ times, rather than those obtained by directly fitting the peaks in the HN spectrum, which contain further inhomogeneous contributions (e.g. shim). Fig. 12 shows the experimental hNH correlation spectra together with the peak assignment used for extracting the site-specific relaxation-time constants.
We used the method described in ref. 58 to measure the missing site-specific R1ρ(ωr), correlation times τi and order parameters Si for residues 7–9, 17, 18, 28, 31, 50, 62–64 (for further information see the ESI†). Site-specific R1ρ(ωr) measurements have been performed at 60 kHz, 90 kHz and 110 kHz MAS with a spin-lock rf-field amplitude of 13 kHz. The relaxation decays have again been fitted with INFOS and the data has been interpreted, using the simplified model-free approach presented in ref. 58, error bars have been obtained using bootstrapping methods.
(III) Computational details
Second-moment based and standard numerical methods both require as an input the Cartesian positional coordinates of each atom. For CaF2 we took the coordinates from the AMCSD data base (AMCSD code: 0008645) and made the 12 × 12 × 12 supercell with VESTA.69 For each proton in ubiquitin, we extracted the Cartesian coordinates from the ubiquitin crystal structure deposited in the protein data bank (PDB ID: 3ONS). With the Cartesian coordinates we then calculated the distances rkq to all other protons Hq, according toNote that the 3ONS structure has been determined by X-ray crystallography and does not contain precise information on proton positions. We inserted the proton positions in VMD70 and post-optimized them using MD simulations with NAMD,71 which slightly improves 1H linewidth predictions (see ESI,† Section S7).
For simulation of a deuterated 100% back-exchanged sample we took into account only the other amide protons HN,q of the backbone or exchangeable sidechain protons when indicated, while for simulation of a protonated sample, we calculated the distances to all Hq, including all aliphatic and aromatic protons.
The distances were then sorted in descending order to identify the N − 1 spins closest to the spin of interest and then used to calculate δkq for all  spin pairs. The Euler angles of each dipolar interaction were extracted by reading the structure file into VMD and then used together with δkq to calculate the spatial components ω(l)kq based on eqn (9) and the full expression of the systems Hamiltonian
  in the LAB frame (eqn (7)). Second moments M2 were calculated from the coupling constants δkq and the opening angles θkq,kj. The isotropic chemical shift σiso,k for each proton was obtained from the Biological Magnetic Resonance Data Bank (BMRB) file of ubiquitin (BMRB entry 1776972). In case of missing chemical shifts, we assigned the corresponding proton to its average chemical-shift value from the BMRB statistics. The three proton positions in CH3 groups have been replaced by an averaged proton coordinate along the methyl-group principal axis, accounting for the fast CH3 rotation.
For ubiquitin we ran LvN simulations with N = 10–12 spins programmed in MATLAB (The MathWorks 2016, version 9.1). Throughout this work, we used 537 orientations, calculated according to the method explained in ref. 73. Results have been validated by comparison with the output of an analogous implementation of the calculation in the C++ library GAMMA.25
For M2 calculations with chemical-shift information, we encoded the effect in chemical-shift scaling factors (CSSF), obtained by comparing the result for M2 calculations with and without chemical-shift differences between each resonance. We then generated CSSF tables for the five-dimensional parameter space spanned by (r12,r13,θ12,13,ΔΩ12,ΔΩ13) in a general three-spin system and obtained tables for the spatial-spectral grid (ΔΩ12,ΔΩ13) = [0![[thin space (1/6-em)]](https://www.rsc.org/images/entities/char_2009.gif) :
:![[thin space (1/6-em)]](https://www.rsc.org/images/entities/char_2009.gif) 0.025
0.025![[thin space (1/6-em)]](https://www.rsc.org/images/entities/char_2009.gif) :
:![[thin space (1/6-em)]](https://www.rsc.org/images/entities/char_2009.gif) 0.02, 0.25
0.02, 0.25![[thin space (1/6-em)]](https://www.rsc.org/images/entities/char_2009.gif) :
:![[thin space (1/6-em)]](https://www.rsc.org/images/entities/char_2009.gif) 0.05
0.05![[thin space (1/6-em)]](https://www.rsc.org/images/entities/char_2009.gif) :
:![[thin space (1/6-em)]](https://www.rsc.org/images/entities/char_2009.gif) 1, 1
1, 1![[thin space (1/6-em)]](https://www.rsc.org/images/entities/char_2009.gif) :
:![[thin space (1/6-em)]](https://www.rsc.org/images/entities/char_2009.gif) 0.2
0.2![[thin space (1/6-em)]](https://www.rsc.org/images/entities/char_2009.gif) :
:![[thin space (1/6-em)]](https://www.rsc.org/images/entities/char_2009.gif) 10] ppm (in total 71 × 71 points), (r12,r13) = [1
10] ppm (in total 71 × 71 points), (r12,r13) = [1![[thin space (1/6-em)]](https://www.rsc.org/images/entities/char_2009.gif) :
:![[thin space (1/6-em)]](https://www.rsc.org/images/entities/char_2009.gif) 8
8![[thin space (1/6-em)]](https://www.rsc.org/images/entities/char_2009.gif) :
:![[thin space (1/6-em)]](https://www.rsc.org/images/entities/char_2009.gif) 0.2
0.2![[thin space (1/6-em)]](https://www.rsc.org/images/entities/char_2009.gif) :
:![[thin space (1/6-em)]](https://www.rsc.org/images/entities/char_2009.gif) 8.2, 9
8.2, 9![[thin space (1/6-em)]](https://www.rsc.org/images/entities/char_2009.gif) :
:![[thin space (1/6-em)]](https://www.rsc.org/images/entities/char_2009.gif) 16] Å; (in total 45 × 45 points), θ12,13 = 0.05:π in 66 points. The bandwidth around the spin-of interest used for the tabulation process was 50 Hz. The actual calculation for M2 with chemical-shift inclusion computes the second moment for each three-spin system in the protein and corrects it by multiplication with the CSSF given by the tabulated value associated with the closest match to the input system parameters. This speeds up computations, compared to directly diagonalizing each three-spin system for every new calculation and makes application of M2 + CS simulations to new molecules easy and straightforward. All analytical computations for the M2 derivation have been performed with Mathematica (Wolfram Research, Inc., version 9.0, Champaign, IL (2017)). All numerical simulation programs have been written in MATLAB (The MathWorks 2016, version 9.1). The most important software code for this work (calculation of M2 of deuterated 100% back-exchanged and UL ubiquitin as well as the calculation of chemical-shift scaling factors) have been commented and included in the ESI,† Section S10.
16] Å; (in total 45 × 45 points), θ12,13 = 0.05:π in 66 points. The bandwidth around the spin-of interest used for the tabulation process was 50 Hz. The actual calculation for M2 with chemical-shift inclusion computes the second moment for each three-spin system in the protein and corrects it by multiplication with the CSSF given by the tabulated value associated with the closest match to the input system parameters. This speeds up computations, compared to directly diagonalizing each three-spin system for every new calculation and makes application of M2 + CS simulations to new molecules easy and straightforward. All analytical computations for the M2 derivation have been performed with Mathematica (Wolfram Research, Inc., version 9.0, Champaign, IL (2017)). All numerical simulation programs have been written in MATLAB (The MathWorks 2016, version 9.1). The most important software code for this work (calculation of M2 of deuterated 100% back-exchanged and UL ubiquitin as well as the calculation of chemical-shift scaling factors) have been commented and included in the ESI,† Section S10.
(IV) Estimation of incoherent contributions
Site-specific incoherent contributions have been estimated from the experimental order parameters and correlation times by numerically simulating the HN linewidth due to the N–H motion, interpreted in the context of a two-site hop model74 with opening angle and correlation time τi, solving a stochastic LvN equation according to the methods explained in ref. 75–77.
Conflicts of interest
The authors declare no competing interests.Acknowledgements
We thank Riccardo Cadalbert for the ubiquitin sample preparation, as well as Andreas Hunkeler and Alexander Däpp for technical support. The brute-force LvN were performed on the Euler cluster of ETHZ. This research was supported by ETH Zürich and the Swiss National Science Foundation (SNF) (grant numbers 200020_159707 and 20020_178792). A. S. has been supported by Estonian research project PUT 1534. This project has received funding from the European Research Council (ERC) under the European Union's Horizon 2020 research and innovation program (grant agreement no. 741863, FASTER).References
- F. Castellani, B. van Rossum, A. Diehl, M. Schubert, K. Rehbein and H. Oschkinat, Nature, 2002, 420, 98–102 CrossRef CAS PubMed.
- C. Wasmer, A. Lange, H. Van Melckebeke, A. B. Siemer, R. Riek and B. H. Meier, Science, 2008, 319, 1523–1526 CrossRef CAS PubMed.
- M. T. Colvin, R. Silvers, B. Frohm, Y. Su, S. Linse and R. G. Griffin, J. Am. Chem. Soc., 2015, 137, 7509–7518 CrossRef CAS PubMed.
- J. P. Demers, B. Habenstein, A. Loquet, S. Kumar Vasa, K. Giller, S. Becker, D. Baker, A. Lange and N. G. Sgourakis, Nat. Commun., 2014, 5, 4976 CrossRef CAS PubMed.
- M. D. Tuttle, G. Comellas, A. J. Nieuwkoop, D. J. Covell, D. A. Berthold, K. D. Kloepper, J. M. Courtney, J. K. Kim, A. M. Barclay, A. Kendall, W. Wan, G. Stubbs, C. D. Schwieters, V. M. Lee, J. M. George and C. M. Rienstra, Nat. Struct. Mol. Biol., 2016, 23, 409–415 CrossRef CAS PubMed.
- M. A. Walti, F. Ravotti, H. Arai, C. G. Glabe, J. S. Wall, A. Bockmann, P. Guntert, B. H. Meier and R. Riek, Proc. Natl. Acad. Sci. U. S. A., 2016, 113, E4976–E4984 CrossRef CAS PubMed.
- A. Böckmann, M. Ernst and B. H. Meier, J. Magn. Reson., 2015, 253, 71–79 CrossRef PubMed.
- J. R. Lewandowski, J.-N. Dumez, Ü. Akbey, S. Lange, L. Emsley and H. Oschkinat, J. Phys. Chem. Lett., 2011, 2, 2205–2211 CrossRef CAS.
- M. J. Knight, A. L. Webber, A. J. Pell, P. Guerry, E. Barbet-Massin, I. Bertini, I. C. Felli, L. Gonnelli, R. Pierattelli, L. Emsley, A. Lesage, T. Herrmann and G. Pintacuda, Angew. Chem., Int. Ed., 2011, 50, 11697–11701 CrossRef CAS PubMed.
- E. Barbet-Massin, A. J. Pell, J. S. Retel, L. B. Andreas, K. Jaudzems, W. T. Franks, A. J. Nieuwkoop, M. Hiller, V. Higman, P. Guerry, A. Bertarello, M. J. Knight, M. Felletti, T. Le Marchand, S. Kotelovica, I. Akopjana, K. Tars, M. Stoppini, V. Bellotti, M. Bolognesi, S. Ricagno, J. J. Chou, R. G. Griffin, H. Oschkinat, A. Lesage, L. Emsley, T. Herrmann and G. Pintacuda, J. Am. Chem. Soc., 2014, 136, 12489–12497 CrossRef CAS PubMed.
- S. Penzel, A. A. Smith, V. Agarwal, A. Hunkeler, M. L. Org, A. Samoson, A. Bockmann, M. Ernst and B. H. Meier, J. Biomol. NMR, 2015, 63, 165–186 CrossRef CAS PubMed.
- J. Stanek, L. B. Andreas, K. Jaudzems, D. Cala, D. Lalli, A. Bertarello, T. Schubeis, I. Akopjana, S. Kotelovica, K. Tars, A. Pica, S. Leone, D. Picone, Z. Q. Xu, N. E. Dixon, D. Martinez, M. Berbon, N. El Mammeri, A. Noubhani, S. Saupe, B. Habenstein, A. Loquet and G. Pintacuda, Angew. Chem., Int. Ed., 2016, 55, 15504–15509 CrossRef CAS PubMed.
- L. B. Andreas, K. Jaudzems, J. Stanek, D. Lalli, A. Bertarello, T. Le Marchand, D. Cala-De Paepe, S. Kotelovica, I. Akopjana, B. Knott, S. Wegner, F. Engelke, A. Lesage, L. Emsley, K. Tars, T. Herrmann and G. Pintacuda, Proc. Natl. Acad. Sci. U. S. A., 2016, 113, 9187–9192 CrossRef CAS PubMed.
- G. David, M. L. Fogeron, M. Schledorn, R. Montserret, U. Haselmann, S. Penzel, A. Badillo, L. Lecoq, P. Andre, M. Nassal, R. Bartenschlager, B. H. Meier and A. Bockmann, Angew. Chem., Int. Ed., 2018, 57, 4787–4791 CrossRef CAS PubMed.
- S. Penzel, A. Oss, M.-L. Org, A. Samoson, A. Böckmann, M. Ernst and B. H. Meier, J. Biomol. NMR, 2019, 73, 19–29 CrossRef CAS PubMed.
- V. Agarwal, S. Penzel, K. Szekely, R. Cadalbert, E. Testori, A. Oss, J. Past, A. Samoson, M. Ernst, A. Böckmann and B. H. Meier, Angew. Chem., Int. Ed., 2014, 53, 12253–12256 CrossRef CAS PubMed.
- S. Ray, E. Vinogradov, G. J. Boender and S. Vega, J. Magn. Reson., 1998, 135, 418–426 CrossRef CAS PubMed.
- C. Filip, S. Hafner, I. Schnell, D. E. Demco and H. W. Spiess, J. Chem. Phys., 1999, 110, 423–440 CrossRef CAS.
- V. E. Zorin, S. P. Brown and P. Hodgkinson, J. Chem. Phys., 2006, 125, 144508 CrossRef PubMed.
- K. Xue, R. Sarkar, C. Motz, S. Asami, D. C. R. Camargo, V. Decker, S. Wegner, Z. Tosner and B. Reif, Sci. Rep., 2017, 7, 7444 CrossRef PubMed.
- K. Xue, R. Sarkar, C. Motz, S. Asami, V. Decker, S. Wegner, Z. Tosner and B. Reif, J. Phys. Chem. C, 2018, 122, 16437–16442 CrossRef CAS.
- A. A. Malär, S. Dong, G. Kehr, G. Erker, B. Meier and T. Wiegand, ChemPhysChem, 2019, 20, 672–679 CrossRef PubMed.
- A. Abragam, The Principles of Nuclear Magnetism, Oxford University Press, Oxford, 1961 Search PubMed.
- J. Cavanagh, W. J. Fairbrother, A. G. Palmer, M. Rance and N. J. Skelton, in Protein NMR Spectroscopy, ed. J. Cavanagh, W. J. Fairbrother, A. G. Palmer, M. Rance and N. J. Skelton, Academic Press, Burlington, 2nd edn, 2007, pp. 1–28 Search PubMed.
- S. A. Smith, T. O. Levante, B. H. Meier and R. R. Ernst, J. Magn. Reson., Ser. A, 1994, 106, 75–105 CrossRef CAS.
- M. Bak, J. T. Rasmussen and N. C. Nielsen, J. Magn. Reson., 2000, 147, 296–330 CrossRef CAS PubMed.
- P. Hodgkinson and L. Emsley, Prog. Nucl. Magn. Reson. Spectrosc., 2000, 36, 201–239 CrossRef CAS.
- H. J. Hogben, M. Krzystyniak, G. T. Charnock, P. J. Hore and I. Kuprov, J. Magn. Reson., 2011, 208, 179–194 CrossRef CAS PubMed.
- Z. Tosner, R. Andersen, B. Stevensson, M. Eden, N. C. Nielsen and T. Vosegaard, J. Magn. Reson., 2014, 246, 79–93 CrossRef CAS PubMed.
- I. Kuprov, N. Wagner-Rundell and P. J. Hore, J. Magn. Reson., 2007, 189, 241–250 CrossRef CAS PubMed.
- I. Kuprov, J. Magn. Reson., 2008, 195, 45–51 CrossRef CAS PubMed.
- M. C. Butler, J.-N. Dumez and L. Emsley, Chem. Phys. Lett., 2009, 477, 377–381 CrossRef CAS.
- J. N. Dumez, M. C. Butler and L. Emsley, J. Chem. Phys., 2010, 133, 224501 CrossRef PubMed.
- H. J. Hogben, P. J. Hore and I. Kuprov, J. Chem. Phys., 2010, 132, 174101 CrossRef CAS PubMed.
- I. Kuprov, J. Magn. Reson., 2016, 270, 124–135 CrossRef CAS PubMed.
- U. Sternberg, R. Witter, I. Kuprov, J. M. Lamley, A. Oss, J. R. Lewandowski and A. Samoson, J. Magn. Reson., 2018, 291, 32–39 CrossRef CAS PubMed.
- J. H. Van Vleck, Phys. Rev., 1948, 74, 1168–1183 CrossRef.
- M. Mehring, Principles of high-resolution NMR in solids, Springer-Verlag, Berlin, 2nd, rev. and enl. edn, 1983 Search PubMed.
- H. Dolhaine, M. Engelhardt, G. Hägele and W. Kückelhaus, J. Magn. Reson., 1980, 41, 1–16 CAS.
- G. W. Parker and F. Lado, Phys. Rev. B: Condens. Matter Mater. Phys., 1974, 9, 22–28 CrossRef CAS.
- M. M. Maricq and J. S. Waugh, J. Chem. Phys., 1979, 70, 3300–3316 CrossRef CAS.
- M. Bertmer and H. Eckert, Solid State Nucl. Magn. Reson., 1999, 15, 139–152 CrossRef CAS PubMed.
- R. Goc, Solid State Nucl. Magn. Reson., 1998, 13, 55–61 CrossRef CAS PubMed.
- B. Herreros, A. W. Metz and G. S. Harbison, Solid State Nucl. Magn. Reson., 2000, 16, 141–150 CrossRef CAS PubMed.
- E. Brunner, J. Chem. Soc., Faraday Trans., 1990, 86, 3957–3960 RSC.
- E. Brunner, D. Freude, B. C. Gerstein and H. Pfeifer, J. Magn. Reson., 1990, 90, 90–99 CAS.
- E. Brunner, J. Chem. Soc., Faraday Trans., 1993, 89, 165–169 RSC.
- I. Schnell and H. W. Spiess, J. Magn. Reson., 2001, 151, 153–227 CrossRef CAS PubMed.
- G. A. Webb, Org. Magn. Reson., 1979, 12, IV CrossRef.
- U. Haeberlen and J. S. Waugh, Phys. Rev., 1968, 175, 453–467 CrossRef CAS.
- M. Leskes, P. K. Madhu and S. Vega, Prog. Nucl. Magn. Reson. Spectrosc., 2010, 57, 345–380 CrossRef CAS PubMed.
- I. Scholz, J. D. van Beek and M. Ernst, Solid State Nucl. Magn. Reson., 2010, 37, 39–59 CrossRef CAS PubMed.
- G. Floquet, Ann. Sci. Ecole Norm. Sup., 1883, 12, 47–88 CrossRef.
- R. Challoner and C. A. McDowell, J. Magn. Reson., 1992, 98, 123–133 CAS.
- G. E. Pake and E. M. Purcell, Phys. Rev., 1948, 74, 1184–1188 CrossRef.
- N. Bloembergen, Physica, 1949, 15, 386–426 CrossRef CAS.
- M. Ernst, A. Verhoeven and B. H. Meier, J. Magn. Reson., 1998, 130, 176–185 CrossRef CAS PubMed.
- N. A. Lakomek, S. Penzel, A. Lends, R. Cadalbert, M. Ernst and B. H. Meier, Chemistry, 2017, 23, 9425–9433 CrossRef CAS PubMed.
- D. Marion, D. F. Gauto, I. Ayala, K. Giandoreggio-Barranco and P. Schanda, ChemPhysChem, 2019, 20, 276–284 CrossRef CAS PubMed.
- F. Massi, M. J. Grey and A. G. Palmer III, Protein Sci., 2005, 14, 735–742 CrossRef CAS PubMed.
- N. Salvi, S. Ulzega, F. Ferrage and G. Bodenhausen, J. Am. Chem. Soc., 2012, 134, 2481–2484 CrossRef CAS PubMed.
- P. Rovó and R. Linser, J. Phys. Chem. B, 2017, 121, 6117–6130 CrossRef PubMed.
- J. Sass, F. Cordier, A. Hoffmann, M. Rogowski, A. Cousin, J. G. Omichinski, H. Löwen and S. Grzesiek, J. Am. Chem. Soc., 1999, 121, 2047–2055 CrossRef CAS.
- T. I. Igumenova, A. E. McDermott, K. W. Zilm, R. W. Martin, E. K. Paulson and A. J. Wand, J. Am. Chem. Soc., 2004, 126, 6720–6727 CrossRef CAS PubMed.
- M. Schubert, T. Manolikas, M. Rogowski and B. H. Meier, J. Biomol. NMR, 2006, 35, 167–173 CrossRef CAS PubMed.
- C. Jaeger and F. Hemmann, Solid State Nucl. Magn. Reson., 2014, 57-58, 22–28 CrossRef CAS PubMed.
- S. Penzel, A. A. Smith, M. Ernst and B. H. Meier, J. Magn. Reson., 2018, 293, 115–122 CrossRef CAS PubMed.
- A. A. Smith, J. Biomol. NMR, 2017, 67, 77–94 CrossRef CAS PubMed.
- K. Momma and F. Izumi, J. Appl. Crystallogr., 2011, 44, 1272–1276 CrossRef CAS.
- W. Humphrey, A. Dalke and K. Schulten, J. Mol. Graphics, 1996, 14, 33–38 CrossRef CAS PubMed.
- J. C. Phillips, R. Braun, W. Wang, J. Gumbart, E. Tajkhorshid, E. Villa, C. Chipot, R. D. Skeel, L. Kale and K. Schulten, J. Comput. Chem., 2005, 26, 1781–1802 CrossRef CAS PubMed.
- K. Y. Huang, G. A. Amodeo, L. Tong and A. McDermott, Protein Sci., 2011, 20, 630–639 CrossRef CAS PubMed.
- V. B. Cheng, H. H. Suzukawa Jr. and M. Wolfsberg, J. Chem. Phys., 1973, 59, 3992–3999 CrossRef CAS.
- R. J. Wittebort and A. Szabo, J. Chem. Phys., 1978, 69, 1722–1736 CrossRef CAS.
- R. Kubo, J. Math. Phys., 1963, 4, 174–183 CrossRef.
- D. Abergel and A. G. Palmer III, Concepts Magn. Reson., Part A, 2003, 19A, 134–148 CrossRef CAS.
- A. A. Smith, E. Testori, R. Cadalbert, B. H. Meier and M. Ernst, J. Biomol. NMR, 2016, 65, 171–191 CrossRef CAS PubMed.
Footnote |
| † Electronic supplementary information (ESI) available. See DOI: 10.1039/c9cp03414e |
| This journal is © the Owner Societies 2019 |

