Laser focusing geometry effects on laser-induced plasma and laser-induced breakdown spectroscopy in bulk water
Ye
Tian
 *,
Lintao
Wang
,
Boyang
Xue
,
Qian
Chen
and
Ying
Li
Optics and Optoelectronics Laboratory, Ocean University of China, Qingdao 266100, P. R. China. E-mail: ytian@ouc.edu.cn
First published on 1st November 2018
Abstract
The influences of laser focusing geometry on laser-induced plasma and laser-induced breakdown spectroscopy (LIBS) in bulk water are investigated by using fast imaging and spectroscopic techniques. Comparisons between different focusing geometries (spherical aberrations and focusing angles) are performed in terms of breakdown thresholds, plasma morphologies, emission distributions, pulse-to-pulse plasma fluctuations, and the corresponding LIBS signals. It is shown that spherical aberrations lead to an increase in the threshold energy of breakdown, to a formation of multiple elongated plasmas with weak emissions, and to a decrease in the signal intensity as well as LIBS stability. With aberration minimized focusing, larger focusing angles produce a lower breakdown threshold, a compact plasma with stronger emissions, and a higher signal intensity as well as higher LIBS stability. In particular, we demonstrate that with the minimized spherical aberrations and large focusing angles, the intensities of plasma emission continue to increase at higher laser energies and no clear saturation is observed. The present results suggest that a relatively large focusing angle should be applied for LIBS measurement in bulk water, and the spherical aberrations should be eliminated.
1. Introduction
With the advances in measurement technology and vehicle platforms such as manned submersibles and remotely operated vehicles (ROVs), in situ chemical sensors based on laser spectroscopy are now playing an important role in the determination of chemical information of seawater.1,2 Laser-induced breakdown spectroscopy (LIBS) is a type of atomic emission spectroscopy (AES) that uses a laser-induced plasma as the hot vaporization, atomization, and excitation source. The optical emissions from the plasma are thus used for chemical analysis purposes.3–5 In principle, LIBS enables a noninvasive and real-time measurement in bulk water because the laser-induced plasma both prepares (vaporizes) and excites the water sample, and only optical access to and from the water medium is required.6 This makes underwater LIBS7–10 an attractive sensing technique for in situ analysis of seawater, with specific advantages of multi-elemental and stand-off analysis capabilities. Over the past few years, several underwater LIBS instruments have been developed and deployed for submarine applications.1,11–14 And recently, more attention has been paid to deep-sea environments such as hydrothermal vent regions where the concentrations of metal elements are extremely high.15–20Although LIBS has demonstrated its versatility and attractive features, from the analytical point of view, laser-induced plasma in liquid is far from the ideal case for spectroscopic analysis compared with that in gas environments.21 Due to the incompressible nature of water with high thermal conductivity, the generated plasma in water suffers from strong confinement and quenching effects, which can significantly degrade the quality of LIBS signals and cause strong pulse-to-pulse fluctuations.22 To overcome this problem, most studies of underwater LIBS are devoted to the improvement of laser irradiation schemes such as using double-pulse23–28 or long-pulse lasers.29–33 In the double-pulse method, a first pulse is used to create a cavitation bubble into which a second pulse is delivered, allowing mechanisms similar to LIBS occur in gases. However, this method was shown not to be applicable under high pressure conditions in deep-sea because the bubble growth in water can be strongly suppressed by the external high pressure.34–37 Sakka and Thornton et al. reported the benefits of a single long-pulse laser with a duration of 150 ns for both submerged solid targets29–32 and bulk solutions analysis.33 The signal enhancement of the long-pulse laser was attributed to the more efficient coupling of laser pulse energy into mechanical effects during the breakdown process in water.33
However in laser irradiation schemes, less attention has been paid on how to focus the laser beam.38,39 The focusing geometry of the laser beam determines the spatial distribution of the delivered laser irradiance along the focal volume, which could be critical for the plasma formations as well as LIBS properties especially in bulk solution analysis. In our previous studies, we have investigated the LIBS performance of different focusing arrangements (single and double lens with different focal lengths) from a practical application point of view38 and demonstrated the key role of the laser focusing angle in the stabilization of laser-induced plasmas.39 The purpose of the present work is to make a systematic and fundamental study of the effects of laser focusing geometry (i.e. spherical aberration and focusing angle) on the laser-induced plasma and LIBS measurement in bulk water. Different focusing configurations with varying spherical aberrations and focusing angles will be used to evaluate the focusing geometry effects. With fast imaging and spectroscopic techniques, comparisons between different focusing conditions will be performed in terms of breakdown thresholds, plasma morphologies, emission distributions, pulse-to-pulse plasma fluctuations, and the corresponding LIBS signals. We will especially show the laser energy dependences of the plasma emissions under different focusing conditions.
2. Experimental
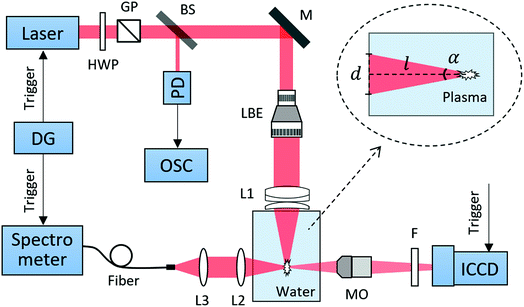
The experimental setup for plasma generation and emission detection is shown in Fig. 1. A Q-switched Nd:YAG laser (Beamtech Optronics, Dawa 200) was operated at a fundamental wavelength of 1064 nm, with a pulse duration of 10 ns and a repetition rate of 10 Hz. The laser beam passed through a half-wave plate (HWP) and a Glan prism (GP). This ensemble allowed a fine adjustment of the laser energy delivered into the water medium. A portion (∼8%) of each laser pulse passing through the beam splitter (BS) was sent to a photodiode (PD) connected with an oscilloscope (OSC) to monitor the laser energy. The laser beam was expanded with a laser beam expander (LBE) and then focused into a quartz cuvette filled with water solution. Different focusing angles were realized by varying the beam expanding ratio before focusing. The beam expansion in this experiment also allowed us to avoid the laser-induced damage of the cuvette at high laser energies. The focusing lens (L1) consists of an achromatic doublet (f = 60 mm) and a meniscus lens (f = 100 mm) in order to minimize the spherical aberrations. For a comparative study of the aberration effect, L1 could be replaced by a single plano-convex lens (f = 45 mm) which has a similar focal length as the double-combination lens. The focusing angle α was thus determined by measuring the diameter d of the beam on the cuvette wall and the laser transmission distance l in the water, as shown in the inset in Fig. 1.For the plasma emission detection system, the plasma was magnified by using a micro-objective (MO, 10×) due to the small size of plasma confined in water. The plasma image was directly captured using an ICCD camera (Andor Technology, iStar DH 720) equipped with a neutral density filter (F) in front to avoid detector saturation. Plasma images taken with the ICCD camera could provide the information of plasma morphologies, plasma emission distributions and pulse-to-pulse plasma fluctuations, with a high spatial resolution of 3.6 μm. For the spectroscopic measurement, the plasma emission was collected with a pair of fused silica plano-convex lenses L2 (f = 60 mm) and L3 (f = 40 mm), and the spectrum was then recorded by using a spectrometer (Avantes, Avaspec-ULS2048) in a wavelength range from 260 to 820 nm. The use of such a spectrometer is suitable for underwater LIBS applications with a compact optical layout, and it maintains a relatively large optical throughput to have good LIBS signals. The timings of the laser, ICCD and spectrometer were controlled by using a delay generator (Stanford Research Systems, DG 535).
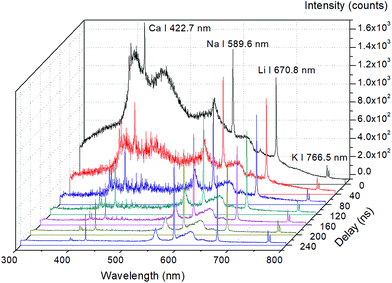
The water solutions in this experiment were made from CaCl2, NaCl, LiCl, and KCl dissolved in deionized water, with the concentrations of 1000 ppm Ca, 100 ppm Na, 100 ppm Li, and 100 ppm K to get a well-resolved spectral line and alleviate the self-absorption effect. Typical temporal evolution of the LIBS spectrum is shown in Fig. 2. We can see that the emission lines of Ca, Na, Li and K can be clearly distinguished in the spectrum. At the beginning of the plasma evolution (before 40 ns), a strong continuum emission dominates the spectrum, while it decreases very fast during the rapid cooling of the plasma in water. The optimal detection delay was thus set as 200 ns to have good signal-to-noise ratios of the spectral lines. For plasma imaging measurement, the same delay of 200 ns was used for comparison purposes. Each spectrum or image was recorded with an accumulation of 100 laser shots. 100 single-shot spectra or images were also acquired to evaluate the pulse-to-pulse fluctuations of the plasma under different focusing conditions.
3. Results and discussion
3.1 Breakdown thresholds under different focusing conditions
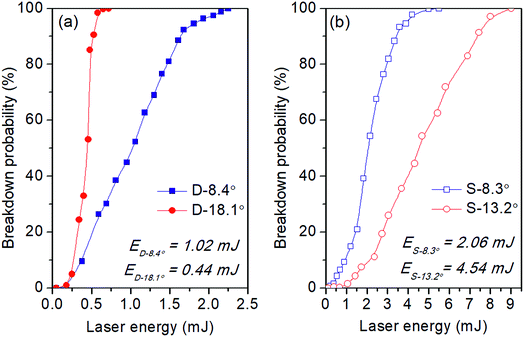
The influences of the laser focusing geometry were first investigated in terms of the breakdown threshold. The breakdown threshold determines the minimum energy required for underwater LIBS measurement, and it plays a key role in both the experimental characterization of laser-induced breakdown and the theoretical modeling.40 The LIBS threshold energy in bulk water is defined as the probability of breakdown. This is because, for cascade breakdown that leads to plasma formation in liquid, cascade initiation requires one or more free electrons to be present in the focal volume at the beginning of the laser pulse. The free electrons can be produced either by linear heating of the impurities in water or by multiphoton ionization. The uncertainty of finding seed electrons in the breakdown volume at any particular time makes cascade breakdown a probabilistic process.40 Therefore in this work, the breakdown threshold was determined from the frequency of plasma formation as the energy was raised from subthreshold to superthreshold levels. 500 laser shots were examined for each energy. The value of the breakdown threshold was thus defined as the energy at which a 50% breakdown probability is achieved. The occurrence of breakdown was detected by the observation of plasma radiation with the help of an ICCD camera.In order to evaluate the effect of aberrations on plasma formation, two types of laser focusing lens were used and compared: a double-combination lens (AC254-060-C and LE1234-C, Thorlabs) with minimized spherical aberrations (L1 shown in Fig. 1) and a single plano-convex lens (GCL-010161B, Daheng Optics) with relatively large aberrations. Two different focusing angles were used in each case. The breakdown probabilities as a function of laser energy are plotted in Fig. 3. First we can see that the threshold energy of the double lens (Fig. 3a) is clearly lower than that of the single lens (Fig. 3b). When increasing the focusing angles, the threshold energy is further reduced from 1.02 to 0.44 mJ for the double lens, whereas it is increased from 2.06 to 4.54 mJ for the single lens. This indicates the strong influence of spherical aberrations on plasma formation in water. For aberration minimized focusing, the laser spot size is smaller at larger focusing angles assuming diffraction limited conditions, which corresponds to a lower threshold energy. However for single lens focusing, spherical aberrations become more pronounced with larger focusing angles, which will significantly degrade the focal quality and lead to a corresponding increase in the threshold energy.41 The influence of spherical aberrations at superthreshold energies will be described in the next section with the spectral and imaging results. Here from the practical point of view, we mention that by using the aberration minimized focusing and a large focusing angle (red line in Fig. 3a), we can realize a 100% breakdown with the energies as low as 1 mJ. This could be helpful for an underwater LIBS instrument to be downsizing and power saving especially in deep-sea applications.
3.2 Plasma emissions as a function of laser energy
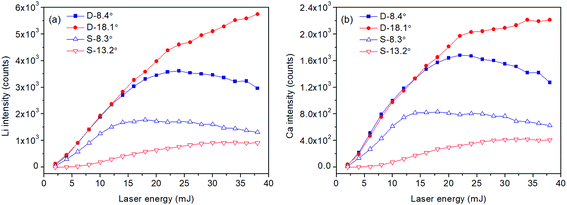
At laser energies above the breakdown threshold, we investigated in this section the laser energy dependences of the LIBS signals and plasma emission images under different focusing conditions. Fig. 4 shows the spectral intensity of the Li I 670.8 nm line (Fig. 4a) and Ca I 422.7 nm line (Fig. 4b) as a function of laser energy ranging from 2 to 38 mJ. First we can see that for each energy, the line intensities are always higher with the double lens focusing than those with the single lens focusing. This means that spherical aberrations can lead to a considerable decrease in the LIBS signals. The behaviors of Li and Ca lines are quite similar, as well as Na and K lines which are not shown here.As for the laser energy dependence, we can find that at small focusing angles (blue lines), the line intensity increases until a maximum intensity is reached at 24 mJ for the double lens (D-8.4°) and 18 mJ for the single lens (S-8.3°). Above this value, the intensity becomes saturated and decreases gradually up to 38 mJ. This indicates that a strong plasma shielding occurs at high laser energies, which means that higher laser energy does not lead to a higher LIBS signal. Such a tendency is in accordance with our previous work performed by using a 532 nm laser42 and the work of Michel et al.17 and Hou et al.15 However in this work, we further show that with the aberration minimized focusing, the line intensity can be stronger and less likely to suffer from plasma shielding effects. And moreover, by enlarging the focusing angle (D-18.1° in Fig. 4), the line intensity continues to increase and no clear saturation is observed. With the single lens focusing and a large focusing angle (S-13.2° in Fig. 4), in contrast, the line intensity decreases dramatically due to the much more pronounced spherical aberrations at large focusing angles.
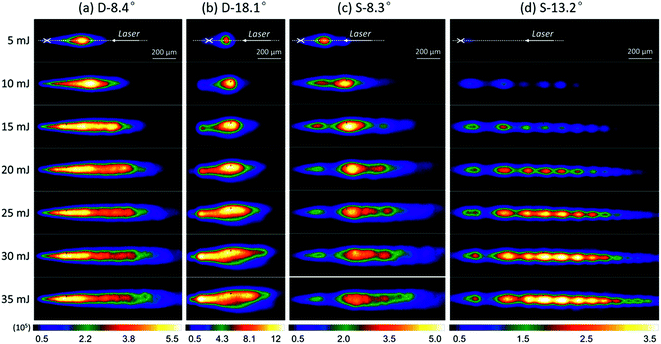
In order to elucidate the laser energy dependence more clearly, we further used the fast imaging technique to show the plasma morphologies and emission distributions. Fig. 5 shows the plasma images as a function of laser energy obtained with the four studied focusing conditions. The images were recorded with the same parameters as the spectra, i.e., 200 ns delay and an average of 100 laser shots. The gate width of the ICCD was set as 100 ns. In each image, the laser was incident from the right. The position of the laser beam waist (crosshairs in Fig. 5) was determined from the site where the plasma initially started, since the irradiance threshold of breakdown will be first reached at the focal point.43 In Fig. 5, we can see first that under all the studied focusing conditions, the plasma length is longer as the laser energy increases, while the left side of the plasma is always ended at the beam waist. This can be explained by using the moving breakdown model44 even though it may not be applicable for large focusing angles according to the work of Vogel et al.45 In the moving breakdown regime, the breakdown occurs independently at each location in the focal volume as soon as the laser irradiance exceeds the threshold value. The plasma forms first at the laser focal point and then spreads as the threshold irradiance is achieved at points farther up the beam path. Therefore, the region beyond the laser focus is “shielded” by the absorption of the laser light in the plasma.
From Fig. 5, we can also see the obvious difference between different focusing conditions. More homogeneous plasmas with stronger emissions are observed with the aberration minimized focusing of the double lens. At a larger focusing angle (D-18.1°), the plasmas are much brighter and more compact and show stronger expansion behaviors. Notice that different color scales were used here for a clear presentation. However, the aberration affected plasmas produced with the single lens are longer and weaker and show inhomogeneous emission distributions that often consist of several parts. Especially at S-13.2° in Fig. 5d, we can see that the elongated plasmas consist of a series of regular plasma cores, with each core located in a fixed position. These plasma cores are actually caused by the presence of local intensity maxima (known as “hot spots”)46 in the focal region of the severely aberrated beam. Future studies are still needed to make a comparison between the plasma core and hot spot distributions calculated by the ray tracing method. Here we mention that these observations give direct evidence of the spherical aberration effect on multiple plasma formations in bulk water, owing to the high spatial resolutions of imaging used in this work.
The plasma images are also in good agreement with the spectral results in Fig. 4. For example, with the single lens of 8.3° (Fig. 5c), the emission intensity is shown to be saturated at 20 mJ and then reduces gradually as the laser energy increases. In contrast, with the aberration minimized focusing, no obvious saturation occurs especially at a large angle of 18.1° (Fig. 5b), where a compact plasma with much intense emissions can be observed. These results confirmed the fact that spherical aberrations make localized energy deposition into a medium more difficult, lead to an elongated plasma with weak emissions, and therefore lead to a decrease in the LIBS signals. In addition, it should be noted that the elongated plasma gives rise to a deviation of the emission collection geometry, which can also reduce the LIBS signals.
We remark that for the practical LIBS measurement, the most straightforward way to enhance the signal is to enhance the laser energy. Unfortunately, different from the solid target analysis in gas environments,47 LIBS in bulk water suffers more easily and greatly from the plasma shielding and signal saturation effects. However, we demonstrate in this work the strong correlation between the laser energy plot of LIBS signals and the laser focusing geometry. By minimizing the spherical aberrations and using a large focusing angle, we can finally get high LIBS signals at high laser energies. This gives us the possibility to improve the limit of detection (LOD) for trace element analysis by considering the conjugation effects of laser focusing geometry and laser energy, compared with our previous work that used a single fixed laser energy.38 A detailed description of the influence of the laser focusing angle will be given in Section 3.4.
3.3 Pulse-to-pulse plasma fluctuations
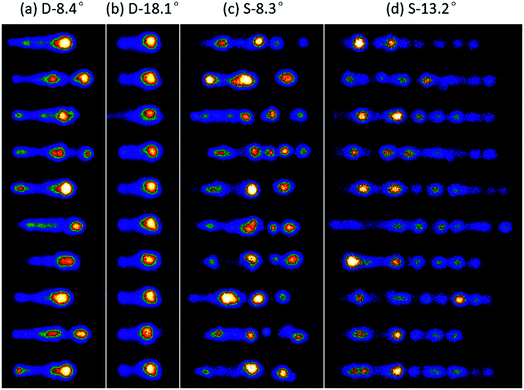
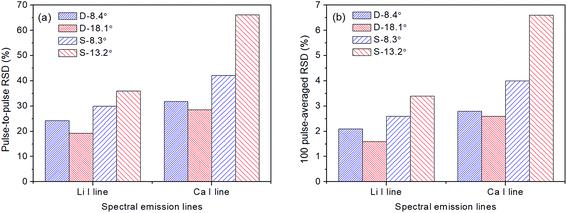
In this section, we evaluated the pulse-to-pulse fluctuations of plasma emissions which are directly related to the stabilities of LIBS signals. The above four focusing conditions were also used here with a fixed laser energy of 10 mJ. For each focusing condition, 100 single-shot plasma images were acquired and 10 of them were randomly selected and are shown in Fig. 6. First, we can see that the pulse-to-pulse fluctuations with the single lens are much stronger than those with the double lens. At a small focusing angle of the single lens (S-8.3°), the plasmas show a clear discrete structure that consists of several plasma cores. Both the positions of the plasma core and its emission intensities vary greatly from one laser pulse to another. The formation of discrete and irregular plasmas can be attributed to the multiple independent breakdowns triggered by impurities in water,48 together with the presence of hot spots in the focal region caused by spherical aberrations.41 At a larger focusing angle (S-13.2°), more plasma cores are formed with a much regular distribution, which means that aberrations dominate the multiple plasma formation in this case. This is consistent with the fact that aberrations become more pronounced with larger focusing angles. Accordingly, by minimizing the spherical aberrations, the pulse-to-pulse fluctuations are greatly reduced as shown in Fig. 5a and b. Especially at a large angle of 18.1°, we can get a rather stable plasma with a single core fixed at the focal region. In addition, the single-shot plasma images presented here also explained the emission distributions of the averaged plasmas observed in Fig. 5.The stabilities of plasmas determine the stabilities of LIBS signals. We calculated the relative standard deviation (RSD) of the spectral lines to confirm the focusing geometry effects on LIBS stabilities. Fig. 7a shows the pulse-to-pulse RSDs of the line intensities of Li I 670.8 nm and Ca I 422.7 nm under the four studied focusing conditions. Each RSD was calculated from 100 single-shot spectra. As expected, lower RSDs are obtained with the aberration minimized focusing for both Li and Ca lines, and the RSDs are further reduced by increasing the focusing angle, while in the case of single lens focusing, a larger focusing angle increases the RSDs due to the increased spherical aberrations at large focusing angles. The 100 pulse-averaged RSDs of the two lines are also shown in Fig. 7b. Each RSD was calculated from 10 spectra and each spectrum was an average of 100 laser shots. We can see that the RSDs are significantly reduced by spectrum averaging, while the behaviors between different focusing geometries remain the same. These results demonstrated the key role of laser focusing geometry in the improvement of LIBS stabilities. We specify that in the best case (D-18.1° in Fig. 7b), the RSDs can be reduced as low as 1.6% for Li and 2.6% for Ca. In the published literature of underwater LIBS, the RSDs commonly ranged from 6% to 30%.7,28,33,49–51 Note that the RSDs in Fig. 7 are calculated without any spectrum normalization approach.
3.4 Plasma characteristics as a function of laser focusing angle
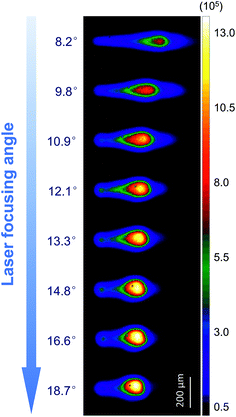
The results observed above suggest that with minimized spherical aberrations and large focusing angles, both stronger signals and higher stabilities can be achieved for LIBS in bulk water. In order to have a deeper understanding of the focusing angle effect, we obtained the plasma images as a function of focusing angle at a fixed energy of 10 mJ. The results are shown in Fig. 8. We can see that the plasma morphologies depend strongly on the focusing angle. At a larger focusing angle, a compact conical plasma can be produced in water with a shorter plasma length and a larger emission area. This is in agreement with the moving breakdown model where the breakdown occurs independently at the focal volume as soon as the laser irradiance surpasses the threshold.44,45 With the same laser energy, a larger focusing angle will have a smaller focal volume with a shorter Rayleigh range, which corresponds to a shorter plasma. In Fig. 8, we can also see that the emission intensities are greatly enhanced by increasing the focusing angle. For example, for the brightest plasma area, the emission intensity of 18.7° is about two times higher than that of 8.2°, with a count value of 7.38 × 10⁵vs. 1.41 × 10⁶. Besides, the compact plasma with stronger emissions means not only a higher signal but also an easier emission collection for the LIBS measurement.The results in Fig. 8 can be elucidated from the plasma shielding point of view. For plasma growth in bulk water, plasma shielding occurs in regions farther up the laser focal point along the beam path due to the moving breakdown regime. For a nanosecond laser pulse, plasma shielding may be dominantly contributed by the impurities in water48 or the presence of hot spots in the focal region41 that lead to multiple plasma formations. Such behavior of plasma shielding is thought to be negative for LIBS measurement because it tends to quench the heating of the initial plasma created in the focal region and cause an earlier decay of plasma emissions. Our results, however, showed the effects of laser focusing geometry to compress the shielding region and to control the plasma morphology as well as the emission distribution. The bright and compact plasma produced with large focusing angles means a more efficient absorption of the laser pulse energy by the initial plasma, which leads to a more efficient excitation and ionization of the plasma in the focal region.
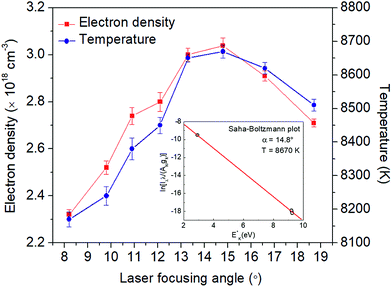
Such statements can be further confirmed by the physical properties of plasmas at different focusing angles. Fig. 9 shows the electron density and plasma temperature as a function of laser focusing angle. The electron density was calculated from the Stark broadening of the Ca I 422.7 nm line with a Lorentzian fit, and a broadening coefficient value of 6.30 × 10⁻⁴ nm was used from ref. 52. The plasma temperature was calculated from the Saha–Boltzmann plot of the Ca lines, including Ca I 422.7 nm and Ca II 393.4/396.8 nm lines. No other lines were available for temperature determination because of the relatively low Ca concentration used in this work, and no obvious self-absorption or self-reversal phenomena were observed from these lines. A typical Saha–Boltzmann plot used for estimating the temperature is given as the inset in Fig. 9 at a focusing angle of 14.8°. As we can see in Fig. 9, both the electron density and temperature increase as the focusing angle increases up to 14.8°. The decrease trend after 14.8° may be caused by either the increasing aberrations at larger focusing angles or the vignetting of the laser beam with quite a large beam expansion before focusing. Nevertheless, the results presented here clearly demonstrated that a relatively large focusing angle should be applied for LIBS measurement in bulk water. Note that spherical aberrations should be definitely eliminated in this case.
4. Conclusions
In conclusion, we have investigated laser focusing geometry effects on laser-induced plasma and LIBS in bulk water by using fast imaging and spectroscopic techniques. It is shown that both spherical aberrations and the focusing angle play an important role in breakdown thresholds, plasma morphologies, emission distributions, pulse-to-pulse plasma fluctuations, and the corresponding LIBS signals. Spherical aberrations lead to an increase in the threshold energy of breakdown, to a formation of multiple elongated plasmas with weak emissions, and to a decrease in the signal intensity as well as LIBS stability. With aberration minimized focusing, larger focusing angles produce a lower breakdown threshold, a compact plasma with stronger emissions, and a higher signal intensity as well as higher LIBS stability. In particular, we demonstrate that with the minimized spherical aberrations and large focusing angles, the intensities of plasma emission continue to increase at higher laser energies and no clear saturation is observed. The present results suggest that a relatively large focusing angle should be applied for LIBS measurement in bulk water, and the spherical aberrations should be eliminated.Conflicts of interest
There are no conflicts to declare.Acknowledgements
This work was financially supported by the National Natural Science Foundation of China (No. 61705212), National Key Research and Development Program of China (No. 2016YFC0302101), China Postdoctoral Science Foundation (No. 2017M610449 and 2018T110712), Shandong Provincial Natural Science Foundation, China (No. ZR2017BF020), and Shandong Postdoctoral Innovation Project (No. 201701013).References
- B. Thornton, T. Takahashi, T. Sato, T. Sakka, A. Tamura, A. Matsumoto, T. Nozaki, T. Ohki and K. Ohki, Deep Sea Res., Part I, 2015, 95, 20–36 CrossRef CAS.
- X. Zhang, P. M. Walz, W. J. Kirkwood, K. C. Hester, W. Ussler, E. T. Peltzer and P. G. Brewer, Deep Sea Res., Part I, 2010, 57, 297–306 CrossRef CAS.
- D. W. Hahn and N. Omenetto, Appl. Spectrosc., 2012, 66, 347–419 CrossRef CAS PubMed.
- Z. Wang, T. B. Yuan, Z. Y. Hou, W. D. Zhou, J. D. Lu, H. B. Ding and X. Y. Zeng, Front. Phys., 2014, 9, 419–438 CrossRef.
- D. A. Cremers and L. J. Radziemski, Handbook of Laser-Induced Breakdown Spectroscopy, John Wiley & Sons, Chichester, UK, 2006 Search PubMed.
- D. A. Cremers, L. J. Radziemski and T. R. Loree, Appl. Spectrosc., 1984, 38, 721–729 CrossRef CAS.
- S. M. Angel, J. Bonvallet, M. Lawrence-Snyder, W. F. Pearman and J. Register, J. Anal. At. Spectrom., 2016, 31, 328–336 RSC.
- C. L. Goueguel, J. C. Jain, D. L. McIntyre, C. G. Carson and H. M. Edenborn, J. Anal. At. Spectrom., 2016, 31, 1374–1380 RSC.
- C. R. Bhatt, J. C. Jain, C. L. Goueguel, D. L. McIntyre and J. P. Singh, Spectrochim. Acta, Part B, 2017, 137, 8–12 CrossRef CAS.
- C. R. Bhatt, J. C. Jain and D. L. McIntyre, Spectrochim. Acta, Part B, 2018, 149, 42–47 CrossRef CAS.
- S. Guirado, F. J. Fortes, V. Lazic and J. J. Laserna, Spectrochim. Acta, Part B, 2012, 74, 137–143 CrossRef.
- S. Guirado, F. J. Fortes and J. J. Laserna, Talanta, 2015, 137, 182–188 CrossRef CAS PubMed.
- J. J. Guo, Y. Lu, K. Cheng, J. J. Song, W. Q. Ye, N. Li and R. E. Zheng, Appl. Opt., 2017, 56, 8196–8200 CrossRef PubMed.
- B. Thornton, T. Sakka, T. Takahashi, A. Tamura, A. Matsumoto and T. Ura, in IEEE Conference on Underwater Technology Symposium (UT), 2013, pp. 1–7 Search PubMed.
- H. M. Hou, Y. Tian, Y. Li and R. E. Zheng, J. Anal. At. Spectrom., 2014, 29, 169–175 RSC.
- H. M. Hou, Y. Li, Y. Tian, Z. H. Yu and R. E. Zheng, Appl. Phys. Express, 2014, 7, 032402 CrossRef.
- A. P. M. Michel, M. Lawrence-Snyder, S. M. Angel and A. D. Chave, Appl. Opt., 2007, 46, 2507–2515 CrossRef CAS PubMed.
- A. P. M. Michel and A. D. Chave, Appl. Opt., 2008, 47, G122–G130 CrossRef CAS PubMed.
- M. Lawrence-Snyder, J. P. Scaffidi, W. F. Pearman, C. M. Gordon and S. M. Angel, Spectrochim. Acta, Part B, 2014, 99, 172–178 CrossRef CAS.
- F. J. Fortes, S. Guirado, A. Metzinger and J. J. Laserna, J. Anal. At. Spectrom., 2015, 30, 1050–1056 RSC.
- A. De Giacomo, M. Dell'Aglio, O. De Pascale and M. Capitelli, Spectrochim. Acta, Part B, 2007, 62, 721–738 CrossRef.
- V. Lazic and S. Jovićević, Spectrochim. Acta, Part B, 2014, 101, 288–311 CrossRef CAS.
- A. De Giacomo, M. Dell'Aglio, A. Casavola, G. Colonna, O. De Pascale and M. Capitelli, Anal. Bioanal. Chem., 2006, 385, 303–311 CrossRef CAS PubMed.
- A. Casavola, A. De Giacomo, M. Dell'Aglio, F. Taccogna, G. Colonna, O. De Pascale and S. Longo, Spectrochim. Acta, Part B, 2005, 60, 975–985 CrossRef.
- A. De Giacomo, M. Dell'Aglio, F. Colao, R. Fantoni and V. Lazic, Appl. Surf. Sci., 2005, 247, 157–162 CrossRef CAS.
- B. Y. Xue, N. Li, Y. Lu, Y. D. Li and R. E. Zheng, Appl. Phys. Lett., 2017, 110, 101102 CrossRef.
- V. Lazic, J. J. Laserna and S. Jovićević, Spectrochim. Acta, Part B, 2013, 82, 42–49 CrossRef CAS.
- V. Lazic, J. J. Laserna and S. Jovićević, Spectrochim. Acta, Part B, 2013, 82, 50–59 CrossRef CAS.
- T. Sakka, H. Oguchi, S. Masai, K. Hirata and Y. H. Ogata, Appl. Phys. Lett., 2006, 88, 061120 CrossRef.
- T. Sakka, S. Masai, K. Fukami and Y. H. Ogata, Spectrochim. Acta, Part B, 2009, 64, 981–985 CrossRef.
- T. Sakka, A. Tamura, A. Matsumoto, K. Fukami, N. Nishi and B. Thornton, Spectrochim. Acta, Part B, 2014, 97, 94–98 CrossRef CAS.
- B. Thornton, T. Sakka, T. Takahashi, A. Tamura, T. Masamura and A. Matsumoto, Appl. Phys. Express, 2013, 6, 082401 CrossRef.
- B. Thornton, T. Sakka, T. Masamura, A. Tamura, T. Takahashi and A. Matsumoto, Spectrochim. Acta, Part B, 2014, 97, 7–12 CrossRef CAS.
- M. Lawrence-Snyder, J. Scaffidi, S. M. Angel, A. P. M. Michel and A. Chave, Appl. Spectrosc., 2007, 61, 171–176 CrossRef CAS PubMed.
- A. P. M. Michel and A. D. Chave, Appl. Opt., 2008, 47, G131–G143 CrossRef CAS PubMed.
- A. De Giacomo, A. De Bonis, M. Dell'Aglio, O. De Pascale, R. Gaudiuso, S. Orlando, A. Santagata, G. S. Senesi, F. Taccogna and R. Teghil, J. Phys. Chem. C, 2011, 115, 5123–5130 CrossRef CAS.
- T. Takahashi, B. Thornton and T. Ura, Appl. Phys. Express, 2013, 6, 042403 CrossRef.
- J. J. Song, J. J. Guo, Y. Tian, B. Y. Xue, Y. Lu and R. E. Zheng, Appl. Opt., 2018, 57, 1640–1644 CrossRef PubMed.
- Y. Tian, B. Y. Xue, J. J. Song, Y. Lu and R. E. Zheng, Appl. Phys. Lett., 2016, 109, 061104 CrossRef.
- P. K. Kennedy, D. X. Hammer and B. A. Rockwell, Prog. Quantum Electron., 1997, 21, 155–248 CrossRef CAS.
- A. Vogel, K. Nahen, D. Theisen, R. Birngruber, R. J. Thomas and B. A. Rockwell, Appl. Opt., 1999, 38, 3636–3643 CrossRef CAS PubMed.
- Y. Tian, B. Y. Xue, J. J. Song, Y. Lu, Y. Li and R. E. Zheng, Appl. Phys. Express, 2017, 10, 072401 CrossRef.
- Y. Tian, B. Y. Xue, J. J. Song, Y. Lu and R. E. Zheng, Appl. Phys. Lett., 2015, 107, 111107 CrossRef.
- F. Docchio, P. Regondi, M. R. C. Capon and J. Mellerio, Appl. Opt., 1988, 27, 3661–3668 CrossRef CAS PubMed.
- A. Vogel, K. Nahen, D. Theisen and J. Noack, IEEE J. Sel. Top. Quantum Electron., 1996, 2, 847–860 CAS.
- L. R. Evans and C. Grey Morgan, Phys. Rev. Lett., 1969, 22, 1099–1102 CrossRef.
- Y. Tian, E. B. Sokolova, R. E. Zheng, Q. L. Ma, Y. P. Chen and J. Yu, Spectrochim. Acta, Part B, 2015, 114, 7–14 CrossRef CAS.
- T. Kovalchuk, G. Toker, V. Bulatov and I. Schechter, Chem. Phys. Lett., 2010, 500, 242–250 CrossRef CAS.
- T. Sato, B. Thornton, T. Takahashi, T. Sakka, T. Ohki and K. Ohki, in OCEANS 2015-Genova, IEEE, 2015, pp. 1–7 Search PubMed.
- V. Lazic, F. Colao, R. Fantoni and V. Spizzicchino, Spectrochim. Acta, Part B, 2005, 60, 1002–1013 CrossRef.
- V. Lazic, F. Colao, R. Fantoni, V. Spizzicchino and S. Jovićević, Spectrochim. Acta, Part B, 2007, 62, 30–39 CrossRef.
- H. R. Griem, Spectral Line Broadening by Plasmas, Academic, New York, 1974 Search PubMed.
| This journal is © The Royal Society of Chemistry 2019 |

