Unexpected surface interactions between fluorocarbons and hybrid organic inorganic perovskites evidenced by PM-IRRAS and their application towards tuning the surface potential†
Subha
Sadhu
 *ab,
Kyler
Aqueche
a,
Thierry
Buffeteau
 a,
Jean-Marc
Vincent
 a,
Lionel
Hirsch
 *b and
Dario M.
Bassani
 *a
*a
aUniv. Bordeaux, ISM, CNRS UMR5255, F-33405 Talence, France. E-mail: dario.bassani@u-bordeaux.fr; subha.sadhu@u-bordeaux.fr
bUniv. Bordeaux, IMS, CNRS, UMR 5218, Bordeaux INP, ENSCBP, F-33405 Talence, France. E-mail: lionel.hirsch@ims-bordeaux.fr
First published on 11th October 2018
Abstract
The chemical nature and orientation of fluorinated monolayers on CH3NH3PbI3 perovskites is probed through XPS and PM-IRRAS measurements. We show that even perfluoro-n-alkanes interact with the HOIP surface to form stable monolayers with well-defined orientation and that the surface potential of CH3NH3PbI3 can be easily tuned over a 150 mV range using various fluorinated porphyrin monolayers.
Conceptual insightsWe pioneer the use of a surface-specific IR spectroscopy technique to probe how molecules deposit on the surface of hybrid organic–inorganic perovskites. With over 20% power conversion efficiencies, the latter have emerged as one of the most promising next-generation photovoltaic materials. Although surface passivation can considerably improve their performance, there is as yet little understanding on how molecules interact with the ionic crystal due to the lack of suitable experimental techniques. We show that PM-IRRAS can be adapted to work on perovskites to provide information on the density and orientation of molecules on the surface as well as the chemical nature of the molecules, in much the same way as IR spectroscopy can be used to identify molecules in solution or in the solid state. Thanks to this technique, we were able to evidence the spontaneous formation of ordered monolayers of even simple fluorocarbons onto the perovskite surface. This surprising result evidences the existence of interactions between fluorine atoms and the hydrophilic surface. We further show that it is possible to harness these interactions to tune the surface potential of the material over a 150 mV range through the formation of a single monolayer. |
Introduction
In recent years, hybrid organic–inorganic perovskites (HOIPs) have emerged as novel materials for applications in photovoltaics1,2 and photoelectric applications such as photo-detectors and lasers.3,4 The high absorption cross section covering the entire visible range, fast exciton dissociation, and high charge-carrier mobility coupled with low fabrication cost are principal attributes fueling a worldwide interest in HOIP research.5–7 Methylammoniumleadtriiodide (MAPI) is one of the most investigated HOIPs, whose use in photovoltaic cells contributed to power conversion efficiencies reaching 22.1%.8 While the crystalline nature of HOIP materials is key to their outstanding performance, it also severely limits the possibilities for adjusting and fine-tuning their electronic properties in comparison to organic materials. Indeed, compositional variations of HOIPs are restricted by the necessity to respect relative size distributions between the ions while maintaining overall charge balance.Like other ionic crystals, perovskites possess under-coordinated ions and dangling bonds at the surface, causing defects and trap sites. For this reason, numerous groups have investigated passivation of the perovskite surface with the aim of improving performance by decreasing recombination and increasing charge injection to the electrode.9–11 Additionally, the hydrophilicity of the MAPI surface is very prone to absorb moisture which breaks down the crystal structure to release PbI2. This is a known pathway for degradation that drastically reduces device stability.12 Hence, passivating the surface using hydrophobic compounds that repel water presents several advantages, including the possible formation of a surface-localized bulk hetero junction.9,13–15
Despite the ample interest in using surface binding to improve the performance and stability of HOIP-based devices, there is a paucity of suitable techniques that are sensitive to probing molecular adlayers down to the single- and few-molecule layers on the HOIP surface. Widely used techniques such as X-ray photoelectron spectroscopy (XPS), electron microscopy, and NMR do not provide comprehensive information on the thickness, orientation, and the nature of interactions between the surface and the monolayer. In contrast, polarization-modulation infrared reflection absorption spectroscopy (PM-IRRAS) is a powerful technique widely used to characterize self-assembled monolayers (SAM) grafted onto gold surfaces.16–19 The PM-IRRAS method exploits the IRRAS advantages of the electric field enhancement and the surface selection rule (only transition moments with a non-zero projection normal to the surface are observable), combined with high sensitivity for surface absorption detection and the ability to do in situ experiments even in infrared absorbing isotropic media. The observed IR transitions can be readily correlated to the different functional groups of the molecules present on the surface, much the same way as IR spectroscopy can be used to identify molecules in solution or in the solid. The intensity of the PM-IRRAS bands is dependent on the quantity of molecules on the surface as well as to their orientation. This allows determination of the film thickness and orientation of the molecules (tilt angle of the vibrational transitions) by comparing the experimental spectrum with that calculated using the isotropic optical constants of the molecules (determined from polarized-ATR measurements). By combining tilt angles measured for different functional groups and knowing the conformation of the molecule, it is therefore possible to precisely determine the absolute orientation of the molecule on the surface.20,21
It occurred to us that HOIPs may be suitable for PM-IRRAS studies of adsorbed molecules. To investigate this, we turned our attention to fluorinated alkylthiols in view of harnessing possible thiol–Pb2+ interactions to assemble molecules on the HOIP surface as previously reported by Cao13 and Noel.9 The C–F bond is well-known to possess vibrational transitions exhibiting high oscillator strength around 1200 cm−1 where the perovskite does not absorb, thereby facilitating its identification. Our results demonstrate that PM-IRRAS performs extremely well on HOIP samples and that it can be used to identify and quantify molecules adsorbed on the surface of the perovskite. We compare our results with those from XPS measurements and further show that orientational information of the molecules on the surface can be obtained in real-time and used to follow the self-assembly process and ordering on the surface.
During the course of our investigation, we were very surprised to discover that simple fluorocarbons such as perfluoro-n-octane possessed significant affinity for the HOIP surface, leading to the formation of stable monolayers. This is highly unexpected in view of the hydrophilic nature of the MAPI surface and the hydrophobicity of fluorocarbons. We proceeded to apply this discovery to tuning the surface potential of HOIP samples by adsorbing fluorinated linear alkanes and porphyrins containing various metal ions.
Results and discussion
Fluorocarbons are well known for their water repelling properties and for generating a strong interfacial dipole moment due to the high electronegativity of fluorine.22 Thus, the presence of hydrophobic fluorine groups on the perovskite surface may lead to improvements in the stability and efficiency of HOIP-based devices by varying the surface potential of the active layer.23 Model HOIP devices were prepared for surface potential determination using a Kelvin probe set-up (Fig. 1A, see ESI† for details). The formation of pure tetragonal phase perovskite structure is confirmed from the X-ray diffraction (XRD) measurements which show the diffraction at 14.1°, 28.6° and 43.2°, corresponding to (110), (220) and (330) planes, respectively (Fig. 1B).9,24 We initially focused on 1H,1H,2H,2H-perfluorodecanethiol (PFDT, Fig. 1), which combines a perfluorooctyl chain with a thiol moiety. Model HOIP devices were fabricated on ITO substrates coated with poly(3,4-ethylenedioxythiophene)polystyrene sulfonate (PEDOT:PSS) according to a previously reported procedure.25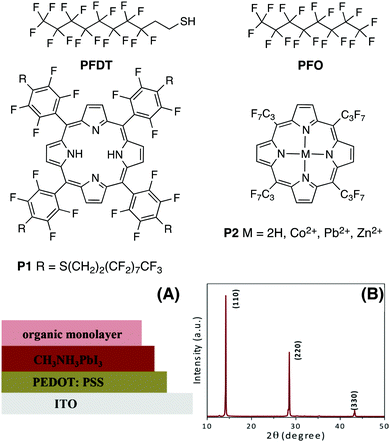 | ||
| Fig. 1 Structure of fluorinated derivatives, (A) architecture of devices for Kelvin probe studies, and (B) characteristic tetragonal phase XRD pattern of MAPI samples used. | ||
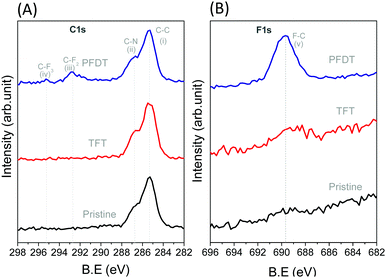
After fabrication of the perovskite layer, perfluorodecanethiol (PFDT) was dropcast on the device and allowed to incubate for 15 minutes. Then, the surface of the device was rinsed several times with trifluorotoluene (TFT) to remove the excess material. The presence of PFDT on the perovskite surface was confirmed by XPS (Fig. 2), which evidenced the presence of two additional peaks at 292.8 and 295.1 eV corresponding to the CF2 and CF3 of the perfluorocarbon chain, respectively, as well as the F 1s peak at 689.7 eV (Fig. 2B).26 Control experiments in which the HOIP devices were incubated with neat TFT showed no such peaks, confirming that they originate from PFDT. The Pb 4f and 5d spectra of pristine and PFDT-treated devices were also analyzed for possible indications of the formation of Pb–S bonds (Fig. S4, ESI†). In all cases, a symmetrical peak at 138.5 and 143.8 eV was observed for Pb 4f7/2 and 4f5/2, respectively, and also for Pb 5d5/2 and 5d3/2 (at 21 and 18 eV, respectively). Likewise, signals corresponding to the S 2p orbitals were not apparent (Fig. S5, ESI†), suggesting that the surface sulfur content is below the detection limit of XPS (ca. 0.5 atom % of 10 nm thick surface layer).27
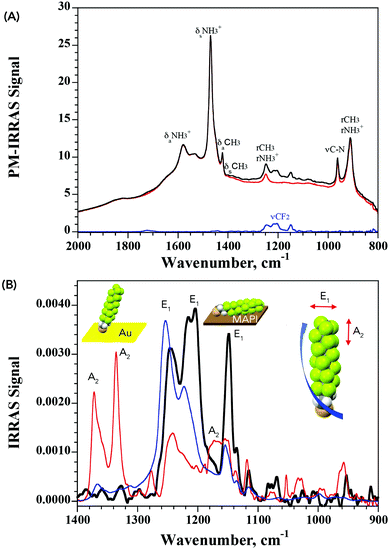
The lack of structural information from XPS prompted us to further analyze the nature of interaction of PFDT with the perovskite surface using PM-IRRAS. To date, this technique has not been applied to perovskite surfaces and our initial results using the device architecture shown in Fig. 1A were complicated by the occurrence of numerous internal reflections between the layers and by the non-metallic properties of the ITO substrate. To circumvent this, we fabricated perovskite films directly onto 200 nm gold-coated glass slides so as to have suitable metallic substrates.28 This provided us PM-IRRAS spectra with excellent signal-to-noise ratio over the 2000–800 cm−1 region that is of interest to visualize the CF2 vibrations, as can be seen in Fig. 3. The peak positions of different bands ascribable to the MA ions in the HOIP are summarized in Table S2 (ESI†) and match well with earlier published reports.29,30
It is well known that perfluoro-n-alkanes adopt a zig-zag helical conformation to reduce intramolecular repulsive interactions between vicinal fluorenes.31 This results in the coupling of the CF2 vibrations which group into modes that are along the helix axis (A2 symmetry) and modes that are perpendicular to the helix axis (E1 symmetry).32–37 Interestingly, our results from the PM-IRRAS measurements of PFDT on MAPI showed strong contributions from only the vibrational modes oriented perpendicularly to the helix axis (bands at 1244, 1210 and 1149 cm−1), indicative of a horizontal arrangement of the molecule on the surface of the perovskite. To confirm this, we compared this result with that obtained from a SAM of PFDT on gold, where it is known to organize in a dense monolayer with a small (20°) tilt angle.38 As expected for a near-vertical alignment, intense bands are observed for vibrational modes exhibiting A2 symmetry (at 1372 and 1335 cm−1), whereas those aligned perpendicularly to the helix axis are strongly suppressed. From this, we conclude that PFDT on MAPI adopts a surface-bound conformation in which the perfluoroalkane chain is lying flat on the perovskite surface.
The IRRAS spectrum of the surface-bound monolayer with an isotropic orientation of the PFDT molecules can be simulated from the isotropic optical constants obtained using the p- and s-polarized attenuated total reflection (ATR) spectra of a film of PFDT (Fig. S9, ESI†). We consider two limiting geometries of the molecules on the surface, either perpendicular or parallel. Assuming a compact monolayer in which the molecules are parallel to the surface (5 Å thickness) results in a simulated spectrum whose intensity is similar to that obtained experimentally and is significantly lower than that expected from a perpendicular geometry as observed for PFDT on Au (thickness: 17 Å).38 Thus, both the intensity and the observed vibrational modes are consistent with the formation of a single layer of horizontally arranged perfluoroalkane chains on the surface.
From the above study, it emerges that the fluoromethylene groups of the perfluoroalkyl chain in PFDT possess specific interactions with the HOIP surface that favor a horizontal arrangement. Indeed, it can be noted that there are noticeable differences in the energies and shape of the vibrational absorption bands between the experimental spectrum of PFDT on MAPI and that simulated from isotropic optical constants. Such differences are indicative of interactions between the fluorine atoms and the surface that weaken and elongate the C–F bond. To confirm the existence of such interactions, and to separate them from contributions from the thiol group, we investigated the possible formation of monolayers from perfluorooctane (PFO), a volatile perfluoro-n-alkane compound devoid of other chemical functionalities. The latter was drop-cast neat onto the surface of the MAPI and allowed to evaporate to dryness before the sample was analyzed. Much to our surprise, XPS analysis of these samples (Fig. S6, ESI†) evidenced clear signals from C 1s and F 1s orbitals, confirming the presence of PFO on the surface.
The IRRAS spectrum obtained from a sample of MAPI exposed to PFO is shown in Fig. 4, where the presence of CF2 vibrations associated with the fluorocarbon arranged flat on the surface are clearly visible. Comparison with the simulated spectrum of a 5 Å-thick PFO isotropic layer evidences important differences in shape and energy. A shift of ca. 20 cm−1 towards lower energies is observed, indicative of a weakening of the C–F bond as a result of specific interactions between the fluorine atoms with the perovskite surface. The origin of the attractive force between the fluorocarbon and the MAPI surface is not identified at present, but we may rule out the formation of C–F⋯I− halogen bonds since these would be destabilizing due to the electronegativity of the fluorine atoms. We may instead expect H-bonding between fluorine and the methylammonium cations,39 possibly providing multi-point interactions between the fluorocarbon chain(s) and the surface. The somewhat lower intensity of the experimentally observed IRRAS signal with respect to the simulated signal presumably reflects a sub-monolayer surface coverage.
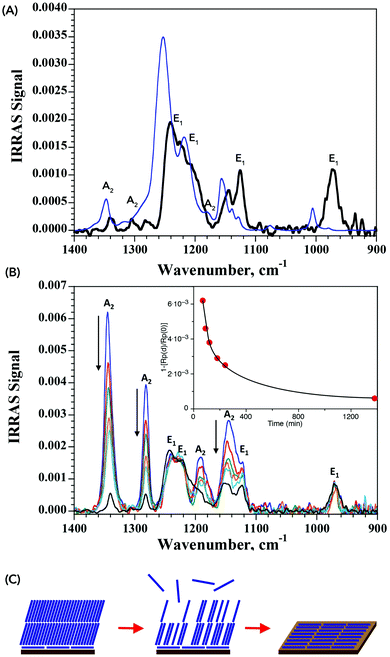 | ||
| Fig. 4 (A) IRRAS spectra of PFO on MAPI (black line) and simulated spectra for a 5 Å-thick isotropic PFO film (blue line). See Fig. 3 for band assignment. The difference between the two results from specific interactions between the fluorine atoms and the surface of the perovskite (B) time dependent IRRAS spectra of PFO on MAPI. Inset shows time evolution of the intensity at 1345 cm−1, evidencing the decrease of the A2 bands associated with a vertical arrangement of the PFO. (C) Schematic of the monolayer formation, illustrating the initial formation of a horizontally-aligned monolayer on top of which PFO accumulates vertically. The latter evaporates over time, leaving only the more stable horizontally-aligned monolayer. | ||
The PM-IRRAS technique allows in situ monitoring of the surface composition. We therefore proceeded to follow the formation of the PFO monolayer in real time. Samples were prepared by drop-casting the PFO on the surface of the HOIP substrate and incubating the latter under a PFO atmosphere to slow the evaporation step. The results are collected in Fig. 4B and show that at short evaporation times, signals for both horizontally- and vertically-aligned PFO are present, with the latter being more important. Over the course of a few hours, the bands associated with the vertically-aligned PFO decrease, whereas those for the horizontally-aligned PFO remain unchanged. After 23 h, only the bands for the horizontally-aligned PFO are visible and no further change occurs over the following 24 h. We interpret this as being indicative of a mechanism in which the initial horizontally-aligned PFO monolayer is rapidly formed upon contact between the PFO and the MAPI surface. Excess material then organizes more vertically on top of this initial monolayer so as to maximize fluorine–fluorine interactions. Over time, the excess material evaporates from the surface to leave only the horizontally-aligned PFO monolayer which is stable over time. The process is illustrated schematically in Fig. 4C.
To assess whether the surface treatment of the HOIP induces a structural or morphological modification, we performed XRD and scanning electron microscopy (SEM) measurements before and after incubation with PFO and PFDT. The incubated perovskite surfaces do not show the presence of any other diffraction peaks except those characteristic of tetragonal CH3NH3PbI3, demonstrating that there is no change in the crystal structure after surface passivation (Fig. S3, ESI†). The morphology of the perovskite surface also remains unchanged as evidenced by SEM measurements, except for the deposition of perfluorocarbon molecules between the grain boundaries (Fig. S12, ESI†).
We envisioned that the strong interactions observed between PFO or PFDT and the perovskite surface may provide a means for tuning the electronic properties of HOIP materials. To test this, we proceeded to compare the surface potential of pristine MAPI with that of samples exposed to PFO or PFDT. The samples were prepared according to the device architecture shown in Fig. 1 and tested in triplicate using a calibrated Kelvin Probe. The surface potential of pristine MAPI was determined to be 5.11 V, whereas that of PFO- and PFDT-treated samples were 5.14 and 5.16 V, respectively. The variations are beyond the experimental error and significant when one considers that they are induced by a single, 5 Å thick monolayer. To expand on this, we anticipated that the square-planar coordination sphere of porphyrins would make interesting ligands for placing different metal ions in contact with the perovskite surface. To this end, we initially tested compound P1 (Fig. 1), possessing PFDT-substituted fluorophenyl substituents in the meso positions.40 A solution of P1 in toluene (1 mM) was drop-cast onto the MAPI substrate and incubated for 15 min before being copiously rinsed with toluene. The PM-IRRAS spectrum of P1-passivated MAPI surface reveals essentially the presence of CF2 vibrations with E1 symmetry (1250, 1220 and 1150 cm−1) whereas the bands related to CF2 vibrations with A2 symmetry (1367 and 1332 cm−1) show weak intensity, indicating that the fluoromethylene chains lay flat on perovskite surface. A monolayer thickness of 8 Å is estimated (Fig. S10, ESI†), somewhat larger than the one calculated for the PFDT and PFO monolayers, presumably due to the greater steric bulk of P1. The presence of P1 on the MAPI perovskite surface induces a modification of its surface potential to 5.17 V, a value that is very similar to that observed upon treatment with PFDT. In retrospect, this is not surprising since PFDT constitutes a major portion of the composition of P1 and also because the meso-phenyl substituents are sufficiently bulky to prevent close contact between the surface and the porphyrin scaffold.
In light of the encouraging results obtained for P1, we selected to investigate 5,10,15,20-tetrakis(heptafluoro-propyl)porphyrin (P2, Fig. 1),41 which possesses less bulky meso-fluoroalkane substituents, and some of its divalent metallated derivatives (Co2+, Pb2+ and Zn2+, see ESI† for details on the synthesis and characterization). Both the free-base porphyrin and the metallated derivatives are freely soluble in toluene and this solvent was used for surface treatment through drop-casting of a 1 mM solution and copious rinsing to remove excess material. The presence of the porphyrin on the surface was confirmed by XPS which shows the presence of fluoromethyl and fluoromethylene groups from C 1s and F 1s in all samples (Fig. S7, ESI†). The N 1s spectra of perovskite samples treated with P2 (M = 2H) show an additional peak at lower binding energy (400.8 eV) corresponding to N bound to an sp2 carbon, whereas samples treated with P2 (M = Co2+, Pb2+ or Zn2+) possess an N 1s peak corresponding to the metal–N bond. As expected, the presence of Co 2p3/2, 2p1/2 and Zn 2p3/2 at 780.6, 795.8 and 1023 eV, respectively, are observed for the Co-P2 and Zn-P2 treated perovskite samples (Fig. S8, ESI†). The observed splitting energy between Co 2p3/2 and 2p1/2 is 15.2 eV, consistent with earlier reports.42 Although it is not possible to distinguish the Pb2+ of the metallated porphyrin from the perovskite PbI6 octahedra, the presence of Pb-P2 on the perovskite surface is indirectly confirmed by the C 1s, N 1s and F 1s spectra.
The surface potentials of the MAPI samples incubated with P2 and its metallated derivatives are shown in Fig. 5, along with the values for P1 and pristine MAPI for comparison. Interestingly, we see that the effect of P2 is opposite that of P1 by 150 mV and attribute this to the direct contact between the porphyrin heterocycle and the surface of the material. Metallation decreases the electron density on the heterocycle, and we therefore expect that the metallated porphyrins possess an effect that is intermediate between that of the free-base porphyrin and P1. This is indeed the case, with M = Co2+, Pb2+ or Zn2+ spanning the range 5.05–5.09 V.
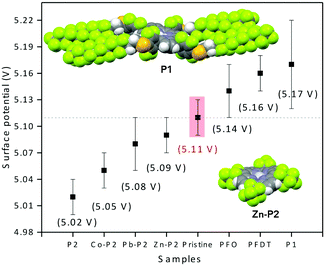 | ||
| Fig. 5 Surface potential determined from triplicate Kelvin probe measurements of pristine MAPI and following formation of monolayers with P1 and P2. The solid-state crystal structures of P140 and Zn-P2 evidence the importance of the steric bulk of the phenyl-PDTF substituents in P1 compared to the more accessible P2 scaffold. | ||
Conclusions
Our results have demonstrated that PM-IRRAS is a powerful technique to probe, at the molecular level, the formation of monolayers on the surface of HOIP materials. This provides direct information on the chemical nature of the monolayer as well as the molecular orientation with respect to the surface of the material. These are both crucial parameters for understanding the effect of surface modification strategies for the construction of efficient HOIP-based devices. Importantly, this technique does not require modification or contact with the sample, and also allows following the chemical processes in real time to obtain kinetic information on the mono- or multi-layer deposition step. Thanks to this technique, we were able to uncover that even molecules that are considered “inert”, i.e. perfluoro-n-alkanes, possess significant surface interactions to efficiently form stable monolayers on the surface of MAPI. This is counterintuitive considering the difference in hydrophobicity between the HOIP surface and fluorocarbons, and we tentatively attribute the origin of the monolayer stability to the formation of multiple hydrogen bonds between the electronegative fluorine atoms and the methylammonium cations, which are strong H-bond donors. This unexpected finding cautions against performing surface modification treatments without in-depth analysis of the surface as un-intended modifications may ensue. We also show that the surface potential of MAPI can be tuned through the formation of monolayers with well-defined composition. This can have a substantial effect on device properties by better matching the work function of the active layer with that of the electrode.Conflicts of interest
There are no conflicts to declare.Acknowledgements
We are grateful to financial support from the LabEx AMADEus (ANR-10-LABX-0042-AMADEUS through grant ANR-10-IDEX-0003-02) and the ANR Hypersol project. This work benefited from the facilities and expertise of CESAMO, UMR 5255 and we thank Dr A. Lecoudre for X-ray structure determination, B. Plano (IMS) for the SEM measurements, and P. Godard for help with the IR spectra. The Aquitaine government is thanked for supporting the equipment in CESAMO.References
- J.-P. Correa-Baena, A. Abate, M. Saliba, W. Tress, T. Jesper Jacobsson, M. Gratzel and A. Hagfeldt, Energy Environ. Sci., 2017, 10, 710–727 RSC
.
- S. Yun, Y. Qin, A. R. Uhl, N. Vlachopoulos, M. Yin, D. Li, X. Han and A. Hagfeldt, Energy Environ. Sci., 2018, 11, 476–526 RSC
.
- P. Docampo and T. Bein, Acc. Chem. Res., 2016, 49, 339–346 CrossRef CAS PubMed
.
- M. Crespo-Quesada, L. M. Pazos-Outón, J. Warnan, M. F. Kuehnel, R. H. Friend and E. Reisner, Nat. Commun., 2016, 12555 CrossRef CAS PubMed
.
- L. M. Herz, ACS Energy Lett., 2017, 2, 1539–1548 CrossRef CAS
.
- S. D. Stranks, G. E. Eperon, G. Grancini, C. Menelaou, M. J. P. Alcocer, T. Leijtens, L. M. Herz, A. Petrozza and H. J. Snaith, Science, 2013, 342, 341–344 CrossRef CAS PubMed
.
- W. S. Yang, J. H. Noh, N. J. Jeon, Y. C. Kim, S. Ryu, J. Seo and S. I. Seok, Science, 2015, 348, 1234–1237 CrossRef CAS PubMed
.
- K. Gao, Z. Zhu, B. Xu, S. B. Jo, Y. Kan, X. Peng and A. K. Y. Jen, Adv. Mater., 2017, 29, 1703980 CrossRef PubMed
.
- N. K. Noel, A. Abate, S. D. Stranks, E. S. Parrott, V. M. Burlakov, A. Goriely and H. J. Snaith, ACS Nano, 2014, 8, 9815–9821 CrossRef CAS PubMed
.
- L. Zuo, H. Guo, D. W. deQuilettes, S. Jariwala, N. De Marco, S. Dong, R. DeBlock, D. S. Ginger, B. Dunn, M. Wang and Y. Yang, Sci. Adv., 2017, 3, e1700106 CrossRef PubMed
.
- B. Chaudhary, A. Kulkarni, A. K. Jena, M. Ikegami, Y. Udagawa, H. Kunugita, K. Ema and T. Miyasaka, ChemSusChem, 2017, 10, 2473–2479 CrossRef CAS PubMed
.
- W. Huang, J. S. Manser, P. V. Kamat and S. Ptasinska, Chem. Mater., 2016, 28, 303–311 CrossRef CAS
.
- J. Cao, J. Yin, S. Yuan, Y. Zhao, J. Li and N. Zheng, Nanoscale, 2015, 7, 9443–9447 RSC
.
- K. T. Cho, Y. Zhang, S. Orlandi, M. Cavazzini, I. Zimmermann, A. Lesch, N. Tabet, G. Pozzi, G. Grancini and M. K. Nazeeruddin, Nano Lett., 2018, 18, 5467–5474 CrossRef CAS PubMed
.
- M. Leng, Y. Yang, Z. Chen, W. Gao, J. Zhang, G. Niu, D. Li, H. Song, J. Zhang, S. Jin and J. Tang, Nano Lett., 2018, 18, 6076–6083 CrossRef CAS PubMed
.
- M. A. Ramin, G. Le Bourdon, N. Daugey, B. Bennetau, L. Vellutini and T. Buffeteau, Langmuir, 2011, 27, 6076–6084 CrossRef CAS PubMed
.
- A. Méndez-Ardoy, N. Markandeya, X. Li, Y.-T. Tsai, G. Pecastaings, T. Buffeteau, V. Maurizot, L. Muccioli, F. Castet, I. Huc and D. M. Bassani, Chem. Sci., 2017, 8, 7251–7257 RSC
.
- C.-K. Liang, G. V. Dubacheva, T. Buffeteau, D. Cavagnat, P. Hapiot, B. Fabre, J. H. R. Tucker and D. M. Bassani, Chem. – Eur. J., 2013, 19, 12748–12758 CrossRef CAS PubMed
.
- T. Buffeteau, B. Desbat and J. M. Turlet, Appl. Spectrosc., 1991, 45, 380–389 CrossRef CAS
.
- M. A. Ramin, G. Le Bourdon, K. Heuzé, M. Degueil, C. Belin, T. Buffeteau, B. Bennetau and L. Vellutini, Langmuir, 2012, 28, 17672–17680 CrossRef CAS PubMed
.
- D. Blaudez, T. Buffeteau, B. Desbat, M. Orrit and J. M. Turlet, Thin Solid Films, 1992, 210–211, 648–651 CrossRef
.
- D. M. Lemal, J. Org. Chem., 2004, 69, 1–11 CrossRef CAS PubMed
.
- K. Asadi, Y. Wu, F. Gholamrezaie, P. Rudolf and P. W. M. Blom, Adv. Mater., 2009, 21, 4109–4114 CrossRef CAS
.
- W. Huang, J. S. Manser, S. Sadhu, P. V. Kamat and S. Ptasinska, J. Phys. Chem. Lett., 2016, 7, 5068–5073 CrossRef CAS PubMed
.
- Y. F. Chen, Y. T. Tsai, D. M. Bassani, R. Clerc, D. Forgacs, H. J. Bolink, M. Wussler, W. Jaegermann, G. Wantz and L. Hirsch, J. Mater. Chem. A, 2016, 4, 17529–17536 RSC
.
- M. Sansotera, W. Navarrini, L. Magagnin, C. L. Bianchi, A. Sanguineti, P. Metrangolo and G. Resnati, J. Mater. Chem., 2010, 20, 8607–8616 RSC
.
- M. S. Wagner, S. L. McArthur, M. Shen, T. A. Horbett and D. G. Castner, J. Biomater. Sci., Polym. Ed., 2002, 13, 407–428 CrossRef CAS PubMed
.
- T. Buffeteau, B. Desbat, D. Blaudez and J. M. Turlet, Appl. Spectrosc., 2000, 54, 1646–1650 CrossRef CAS
.
- J. Idígoras, A. Todinova, J. R. Sánchez-Valencia, A. Barranco, A. Borrás and J. A. Anta, Phys. Chem. Chem. Phys., 2016, 18, 13583–13590 RSC
.
- T. Glaser, C. Müller, M. Sendner, C. Krekeler, O. E. Semonin, T. D. Hull, O. Yaffe, J. S. Owen, W. Kowalsky, A. Pucci and R. Lovrinčić, J. Phys. Chem. Lett., 2015, 6, 2913–2918 CrossRef CAS PubMed
.
- C. W. Bunn and E. R. Howells, Nature, 1954, 174, 549 CrossRef CAS
.
- O. Zenasni, A. C. Jamison, M. D. Marquez and T. R. Lee, J. Fluorine Chem., 2014, 168, 128–136 CrossRef CAS
.
- H. Fukushima, S. Seki, T. Nishikawa, H. Takiguchi, K. Tamada, K. Abe, R. Colorado, M. Graupe, O. E. Shmakova and T. R. Lee, J. Phys. Chem. B, 2000, 104, 7417–7423 CrossRef CAS
.
- T. J. Lenk, V. M. Hallmark, C. L. Hoffmann, J. F. Rabolt, D. G. Castner, C. Erdelen and H. Ringsdorf, Langmuir, 1994, 10, 4610–4617 CrossRef CAS
.
- S. L. Hsu, N. Reynolds, S. P. Bohan, H. L. Strauss and R. G. Snyder, Macromolecules, 1990, 23, 4565–4575 CrossRef CAS
.
- C. Naselli, J. D. Swalen and J. F. Rabolt, J. Chem. Phys., 1989, 90, 3855–3860 CrossRef CAS
.
- J. F. Rabolt and B. Fanconi, Macromolecules, 1978, 11, 740–745 CrossRef CAS
.
- C. A. Alves and M. D. Porter, Langmuir, 1993, 9, 3507–3512 CrossRef CAS
.
- C. Dalvit, C. Invernizzi and A. Vulpetti, Chem. – Eur. J., 2014, 20, 11058–11068 CrossRef CAS PubMed
.
- A. Varotto, L. Todaro, M. Vinodu, J. Koehne, G.-Y. Liu and C. M. Drain, Chem. Commun., 2008, 4921–4923 RSC
.
- S. G. DiMagno, R. A. Williams and M. J. Therien, J. Org. Chem., 1994, 59, 6943–6948 CrossRef CAS
.
- A. Strydom and H. J. Strydom, Inorg. Chim. Acta, 1989, 159, 191–195 CrossRef
.
Footnote |
| † Electronic supplementary information (ESI) available: Synthesis and characterization of new compounds, details of PM-IRRAS, XPS, and X-ray diffraction measurements. CCDC 1866532. For ESI and crystallographic data in CIF or other electronic format see DOI: 10.1039/c8mh01119b |
| This journal is © The Royal Society of Chemistry 2019 |

