 Open Access Article
Synthesis of α′′-Fe16N2 ribbons with a porous structure†
Jinming
Liu
 a,
Guannan
Guo
 a,
Fan
Zhang
 ab,
Yiming
Wu
b,
Bin
Ma
 a and
Jian-Ping
Wang
 *ab
*ab
aDepartment of Electrical and Computer Engineering, University of Minnesota, 200 Union Street SE, Minneapolis, MN 55455, USA. E-mail: jpwang@umn.edu
bNiron Magnetics, 650 Taft St NE #400, Minneapolis, MN 55413, USA
First published on 12th March 2019
Abstract
The microstructure of FeCuB ribbons (∼20 μm thick) was modified to fabricate α′′-Fe16N2 at a temperature as low as 160 °C. The ribbon samples were heat treated first at a temperature reaching 930 °C and then quenched down to room temperature. During the heat treatment, ribbon samples were oxidized, and hydrogen reduction was then conducted to remove the oxygen from the ribbon samples. The reduced ribbon samples had a porous structure, which improved the nitrogen diffusion efficiency and decreased the fabrication temperature of α′′-Fe16N2 down to 160 °C. It was demonstrated that the techniques for microstructure control in this method including oxidation and reduction helped obtain the α′′-Fe16N2 phase with high coercivity, thus manifesting this could be a promising technique for low-temperature nitridation on ribbons in general.
Introduction
Permanent magnets (PMs) are widely used in the clean and renewable energy industry such as in electric motors1 and wind turbines.2 Rare-earth PMs such as Nd–Fe–B and SmCo5 are in high demand since they have a high maximum energy product and a large magnetocrystalline anisotropy.3 However, due to the concerns on the environmental degradation from mining rare-earth elements and cost issues,4 research on rare-earth-free PMs has been attracting much more attention.5,6 Magnetic materials with high saturation magnetization (Ms) and large magnetocrystalline anisotropy are good candidates. α′′-Fe16N2 has been reported as a ferromagnetic material with a high Ms (∼2.9 T).7 After 40 years of debate, the existence and the physical origin of the giant saturation magnetization in Fe16N2 were finally confirmed.8 It also possesses a large magnetocrystalline anisotropy (>1.0 × 10⁷ erg cm−3).8–10 More importantly, both Fe and N are abundant and much cheaper than rare-earth elements. There were several successful efforts to synthesize α′′-Fe16N2 nanoparticles (NPs) and powders in the past.11–15 Recently, α′′-Fe16N2 in bulk form with relatively high coercivity (Hc) were also reported.15,16 All these properties make α′′-Fe16N2 a promising candidate for rare-earth-free PMs.17The α′′-Fe16N2 phase was first reported by Jack in 1951.18 In his method, nitridation was performed at a high temperature (>600 °C) using a gas mixture of ammonia and hydrogen since γ-FeN only exists at a temperature above 592 °C, based on the Fe–N binary phase diagram.19 α′-Fe8N was then formed by quenching γ-FeN to the martensite starting temperature and then α′′-Fe16N2 could be obtained from α′-Fe8N after a low-temperature (<200 °C) tempering process. The formation of the martensite Fe8N phase was also reported by quenching the Fe-based nanocrystalline ribbons with γ′-Fe4N phase.20 However, the efficiencies of the α′-Fe8N and α′′-Fe16N2 phase transformations need to be further improved using these high-temperature nitridation processes.21,22 In the late 1990s, a low-temperature nitridation (<200 °C) method was proposed to fabricate α′′-Fe16N2 using α-Fe or iron oxide NPs as raw materials.23,24 In the following decades, many research groups reported similar results.13,25,26 Core–shell structured α′′-Fe16N2 NPs were also synthesized using the low-temperature nitridation method, where the oxide shells were used to magnetically isolate α′′-Fe16N2 NPs and enhance the Hc.11,27 Up to now, only NPs, however, are used for the low-temperature nitridation method since they have a much higher surface to volume ratio that provides a higher nitridation efficiency. There are no reports on using several tens of micrometer thick ribbons as the starting material for the low-temperature nitridation method.
There were many reports on the successful attempts to lower down the nitridation temperature. Tong et al. experimentally demonstrated that the nitridation temperature of iron with the modified nanostructured surface layer could be as low as 300 °C, which is much lower than the conventional nitridation temperature.28 In their experiment, surface mechanical attrition treatment was developed to generate a plastic deformation on the top surface layer of the bulk iron and a large number of grain boundaries were introduced, which enhanced the kinetics of nitridation at such a low temperature (300 °C). Grain boundaries could also be introduced in Fe ribbons via thermal treatment.29 Based on the Fe–N binary phase diagram,19 body-centered cubic (bcc) Fe will transform into the face-centered cubic (fcc) Fe at a temperature of around 910 °C and new grain boundaries could be generated due to the phase transformation happening around this temperature. The grain boundaries obtained from the thermal treatment would help in enhancing the nitridation efficiency drastically. The oxidation and reduction processes were proved to be an effective way to synthesize α′′-Fe16N2 by the low-temperature nitridation method.12
In this study, the oxidation and hydrogen reduction processes were used to modify the microstructure of melt-spun FeCuB ribbon samples, which were then used for the following low-temperature nitridation process to synthesize the α′′-Fe16N2 phase directly. Fig. S1 in the ESI† shows the process flow chart and the expected microstructure (schematic) of the ribbon samples prepared at each stage. Cu and B were added to the ribbon samples to control their initial microstructure. B was used to fine-tune the grain structure of the melt-spun ribbons.20 Meanwhile, based on the temperature–time-transformation (TTT) curve of Cu precipitation,30 Cu could precipitate during the quenching process and work as either pinning sites (in grains) or magnetic isolation sites (at grain boundaries).
During the heat treatment process in an ambient condition, the ribbon samples were oxidized. The oxidized ribbons were then reduced using pure hydrogen gas at a relatively low temperature between 300 and 350 °C. After the hydrogen reduction, ribbons are expected to form a foam-like porous structure, which helps nitrogen atoms to diffuse into the ribbon samples. The oxidation of iron-based ribbons and the subsequent reduction may also generate micro-channels in the ribbons, which further enhance the nitridation efficiency in the grains.
Experimental details
Fe ribbons with 3 wt% Cu and 2 wt% B were prepared by a melt spinning system. The thickness of the ribbon is around 20 μm. First, a box furnace was heated up to 930 °C. The ribbons were put into the box furnace for a few minutes (8–16 min) and then were quenched in room-temperature distilled water. During this quenching process, the phase is transformed from bcc-Fe to fcc-Fe19 and then back to bcc-Fe (or partial martensite phase), which would introduce new grain boundaries into the ribbon samples. Second, hydrogen reduction of the samples was carried out in a tube furnace at 300–350 °C for 2 h with a hydrogen flow rate of 40 sccm. The hydrogen reduction step is critical for the following nitridation process, and it could create micro-channels to enhance the nitrogen atom diffusion.12,31 After that, the nitridation process was carried out in the same furnace at 160 °C for 42–84 h with an ammonia flow rate of 40–80 sccm. The ammonia flow rate is used to modify the nitridation potential, which is defined as the partial pressure of ammonia over the partial pressure of hydrogen pNH3/pH23/2 in the tube furnace.19The crystal structures, the microstructures and the magnetic properties of the prepared ribbon samples were further characterized. The crystalline structures of the ribbon samples were examined by X-ray diffraction (XRD, Bruker 2D Discover D8). The microstructure of the ribbon samples was characterized using field-emission electron microscopy (FE SEM, Hitachi S-5000) and high-resolution transmission electron microscopy (HRTEM, FEI Tecnai G2 F30). The composition of the samples was determined by wavelength-dispersive X-ray spectroscopy (WDS). The magnetic properties were measured using a physical property measurement system (PPMS) with a vibrating sample magnetometer (Quantum Design).
Results and discussions
A. Crystalline structure analysis
The crystalline structures of the ribbon samples were characterized by XRD. Fig. 1 shows the XRD patterns of the raw ribbon sample, the quenched ribbon sample from 930 °C, and the ribbon sample after 350 °C/2 h hydrogen reduction. The primary phase of the raw ribbon sample is bcc Fe and there are also some other small diffraction peaks of iron oxide and boron oxide. The diffraction peak at around 69° is from the single crystal silicon holder used for the XRD measurement. The raw ribbons were heat treated at 930 °C and then quenched in room-temperature distilled water. Since the heat treatment was carried out in the air, the ribbon samples were also oxidized. Therefore, a reduction process was carried out to remove the oxygen from the ribbon sample to make it ready for the subsequent nitridation experiment. After the hydrogen reduction, the main phase became bcc Fe again.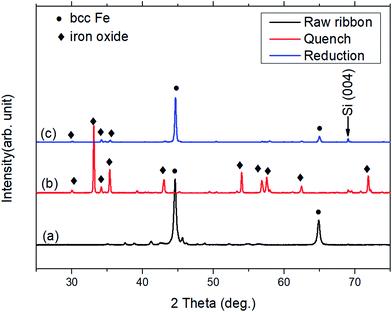 | ||
| Fig. 1 XRD pattern of (a) raw ribbon sample; (b) ribbon sample after quenching from 930 °C in room temperature distilled water; (c) quenched ribbon sample after hydrogen reduction. | ||
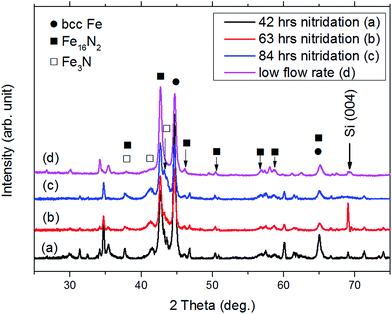
Fig. 2 shows the XRD patterns of the ribbon samples after the nitridation process. The nitridation temperature was 160 °C and the ammonia flow rate was 80 sccm for the studied samples (Fig. 2(a)–(c)). An over-nitrided Fe3N phase was observed even for samples with shorter nitridation time as 42 h. The high ammonia flow rate may provide very high nitridation potential for the ribbon producing the over-nitrided phase. To overcome this issue, a lower ammonia flow rate of 40 sccm was applied. The over-nitrided phase decreased drastically as shown in Fig. 2(d). Thus, the over-nitrided phase could be avoided by adjusting the nitridation potential. The X-ray diffraction patterns were also consistent with the published data where the α′′-Fe16N2 phases and the over-nitrided phases using the low-temperature nitridation method were reported.13,27 The over-nitrided phases were also reported in nanoparticle samples prepared by a low-temperature nitridation when the nitridation time was long (>42 h) and the nitridation temperature was relatively high (473 K).13 Other diffraction peaks in the patterns of nitrided ribbon samples were from iron oxide, boron oxide, or iron boron oxide, which could also be disclosed by the element mapping as shown in Fig. 4 below.
B. Microstructure study of the ribbon samples
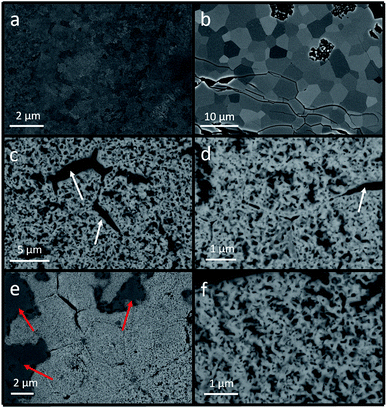
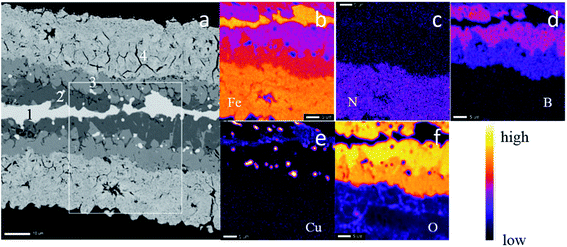
The microstructure of the ribbon samples is shown in Fig. 3. Fig. 3(a) is the SEM image of the raw ribbon sample. The raw ribbon sample was prepared by a melt-spinning system and the ribbon sample was quickly cooled and fine grains were observed compared with the oxidized ribbon sample. Fig. 3(b) is the SEM image of a quenched ribbon sample. During the heat treatment at 930 °C in an ambient condition, the grain boundary regions are oxidized; thus the grain structures can be clearly observed. Hydrogen reduction was conducted on the quenched sample to reduce iron oxides. Porous structures were obtained in the original grains as shown in Fig. 3(c) and (d). There were some black regions (marked with white arrows) in the hydrogen-reduced and nitrided ribbon sample, which could be due to the cracks inherited from the quenching step. The porous structures helped enhance the nitridation efficiency and more Fe16N2 phase could be obtained after the low-temperature nitridation.12 The low-temperature nitridation experiment was carried out on the ribbon samples after hydrogen reduction in the same furnace and the SEM images of the nitridation samples are shown in Fig. 3(e) and (f). The microstructure of the nitrided sample is similar to that of the reduced sample since the nitridation was carried out at a temperature as low as 160 °C. The dark grey areas (marked with red arrows) in Fig. 3(e) and (f) are due to the oxidation of the sample.In order to further investigate the microstructure of the nitrided samples, a cross-sectional SEM (X-SEM) image with elemental mapping was acquired as shown in Fig. 4. The thickness of the nitrided ribbon sample increased from 20 μm (thickness of the raw ribbon sample) to more than 50 μm, which could be due to the inward and outward growth of iron oxide during the heat treatment.32 There are four regions in the ribbon sample as labeled in the XSEM image in Fig. 4(a). The elemental analysis of each region on the white square area marked in Fig. 4(a) was characterized (Fig. 4(b)–(f)). Based on the elemental mapping figures, most of the iron was located at the surface porous layer (region 4) and the center layer (region 1) as shown in Fig. 4(b). Iron in region 1 was also observed in the quenched ribbon sample (not shown here), indicating that the oxidation was not through the ribbon. Most of the nitrogen stayed at the porous layer (region 4) as shown in Fig. 4(c), demonstrating that the porous structure was preferred for nitrogen diffusion at 160 °C. In addition, it was difficult for nitrogen atoms to diffuse into regions 1–3. As shown in Fig. 4(d), most of the boron was located at regions 2 and 3 and much less boron migrated into the porous region 4. The distribution of copper in the ribbon sample is shown in Fig. 4(e). Some copper clusters were observed in regions 1–3 and there was a small amount of copper diffused into the porous region 4. The oxygen was mainly located in regions 2 and 3. By comparing the elemental mapping of iron, boron, and oxygen, we can conclude that there were iron boron oxides in regions 2 and 3. The oxides did not have the porous structure and few nitrogen atoms could diffuse into these regions. The existence of iron boron oxides in regions 2 and 3 is also consistent with the oxide diffraction peaks in the XRD patterns shown in Fig. 2.
TEM images were used to further characterize the microstructure and the Fe16N2 phase of the nitrided samples. The TEM images focused on the region with the porous structure (region 4 in Fig. 4). Fig. 5(a) and (b) show those porous structures that are consistent with the SEM images shown in Fig. 3 and 4. A high-resolution TEM (HRTEM) image was obtained as shown in Fig. 5(c) and the lattice fringes were observed. Indexing the crystal structure was done by obtaining the fast Fourier transform (FFT) of a grain marked by the red box in Fig. 5(c). The FFT patterns matched well with a [1![[3 with combining macron]](https://www.rsc.org/images/entities/char_0033_0304.gif)
![[1 with combining macron]](https://www.rsc.org/images/entities/char_0031_0304.gif) ] zone axis diffraction pattern of α′′-Fe16N2 structure as shown in Fig. 5(d).
] zone axis diffraction pattern of α′′-Fe16N2 structure as shown in Fig. 5(d).
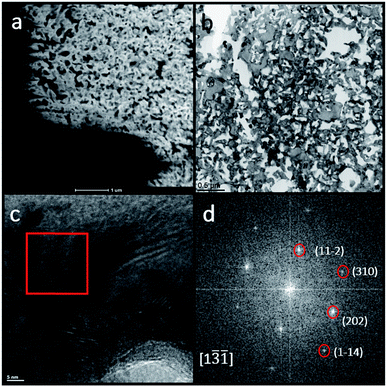 | ||
| Fig. 5 TEM images of the porous region of a nitrided ribbon sample: (a) STEM image; (b) bright field image; (c) high resolution TEM image; (d) FFT patterns of the red box region in (c). | ||
C. Magnetic properties
In-plane (IP) and out-of-plane (OP) hysteresis loops were measured by a VSM to characterize the magnetic properties of the ribbon samples prepared at different stages. IP loops were measured with the magnetic field parallel to the surface of the ribbon samples, while OP loops were measured with the magnetic field perpendicular to the surface. The definitions of IP and OP measurements are shown in Fig. 6(a). The hysteresis loops of the raw ribbon sample, quenched sample, and the reduced sample could be found in the ESI (Fig. S2†). The coercivity (Hc) of these samples is less than 100 Oe. The saturation magnetization (Ms) of the reduced ribbon sample is 160 emu g−1, which is about 30 emu g−1 lower than that of the raw ribbon sample (∼190 emu g−1). This could be explained by the existence of a boron oxide layer in the reduced ribbon sample. Hysteresis loops of the nitrided sample are shown in Fig. 6(a). The in-plane coercivity (IP) Hc and the specific saturation magnetization (Ms) of the nitrided sample are 880 Oe and 145 emu g−1, respectively. The lower Ms of the nitrided ribbon sample compared to that of the reduced ribbon sample might be due to the existence of some iron oxide phases in the region 4 as shown in Fig. 4 where iron nitride phases formed. The Ms and the Hc of the ribbon samples at each step are summarized in the ESI Fig. S3.† The Ms of the nitrided ribbon sample should be around 170 emu g−1 by subtracting the contribution of boron oxide since the weight ratio of N is ∼3 wt% for Fe16N2 and the mass of the sample before and after nitridation is close. Based on the elemental mapping images shown in Fig. 4, the α′′-Fe16N2 phase located at region 4 overlapped with the porous structure. The relative low Ms of the nitrided sample is due to partial oxidation of the porous region as shown in Fig. 3(e) and (f). Ribbon samples with different nitriding parameters were prepared to investigate the relationship between the Hc and the relative phase ratio of α′′-Fe16N2 as shown in Fig. 6(b). Herein, we define the relative phase ratio of α′′-Fe16N2 as the intensity ratio of α′′-Fe16N2 (202) over the sum of the intensities of α′′-Fe16N2 (220) and bcc-Fe (110). It was found that Hc increased with the ratio of α′′-Fe16N2, manifesting that the enhanced Hc was due to the hard-magnetic phase α′′-Fe16N2.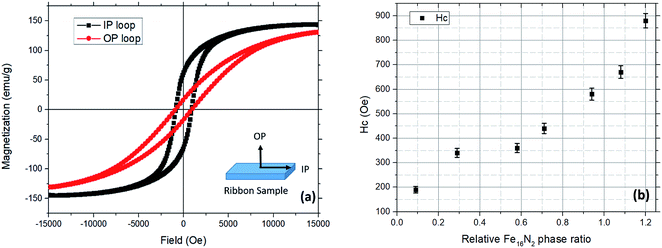 | ||
| Fig. 6 (a) Typical hysteresis loops of the ribbon sample after nitridation. (b) Coercivity versus Fe16N2 phase ratio (Fe16N2 (202)/bcc Fe (110)). | ||
The magnetic anisotropy constant of the nitrided sample was estimated using the law of approach to saturation.33,34 The magnetization curve was measured using an applied magnetic field of up to 50 kOe. The effective magnetic anisotropy constant was estimated to be 3.6 × 10⁶ erg cm−3. Details of the calculations could be found in the ESI.† This effective anisotropy was smaller than that reported by other groups (∼1.0 × 10⁷ erg cm−3).25 Besides α′′-Fe16N2, there were some other phases with relatively low magnetocrystalline anisotropy such as α-Fe and iron oxide in the nitrided ribbon sample as shown in both the XRD patterns and the XSEM elemental mappings. These phases are exchange coupled with the α′′-Fe16N2 phase and the effective magnetic anisotropy of the whole sample was lower than what it should be.
Conclusions
α′′-Fe16N2 phase was successfully obtained from melt-spun FeCuB ribbons by an integrated oxidation, reduction and nitridation process. The nitridation temperature of FeCuB ribbons after reduction was decreased to as low as 160 °C, which is much lower than that of the conventional case (>600 °C). The phase ratio of α′′-Fe16N2 could be controlled by modifying the nitridation parameters. A small amount of Fe3N phase was observed in the nitrided samples, which could also be reduced/eliminated by adjusting the nitridation potential. A porous structure was observed for the nitrided ribbon sample. The coercivity of the nitrided ribbon samples was found to be 880 Oe. It was also found that the coercivity increased with the increase in the volume of the α′′-Fe16N2 phase. The relatively low coercivity could be attributed to the exchange coupling between the magnetic hard phase α′′-Fe16N2 and other magnetic soft phases such as bcc Fe and iron oxide. Quenching and nitridation parameters could be further optimized to obtain pure α′′-Fe16N2 phase.Conflicts of interest
Dr Jian-Ping Wang has equity and royalty interests in and serves on the Board of Directors and the Scientific Advisory Board, for Niron Magnetics Inc., a company involved in the commercialization of FeN magnet. Jian-Ping Wang took an approved leave of absence from the University of Minnesota with a 70% appointment working at Niron from Feb 9th, 2018 to August 27th, 2018. The University of Minnesota also has equity and royalty interests in Niron Magnetics Inc. These interests have been reviewed and managed by the University of Minnesota in accordance with its Conflict of Interest policies.Acknowledgements
Parts of this work were carried out in the Characterization Facility, University of Minnesota, which is partially supported by the National Science Foundation through the University of Minnesota MRSEC under Award Number DMR-1420013. Authors thank the partial support from the Institute for Rock Magnetism, Department of Earth Science, University of Minnesota, Twin Cities, for the use of instruments. We are grateful to Dr John Larson and Mr Chad Carda of Niron Magnetics Inc. for their help in ribbon preparation.References
- S. Chu and A. Majumdar, Nature, 2012, 488, 294–303 CrossRef CAS PubMed.
- J. M. D. Coey, J. Magn. Magn. Mater., 2002, 248, 441–456 CrossRef CAS.
- S. Sugimoto, J. Phys. D: Appl. Phys., 2011, 44, 064001 CrossRef.
- B. J. Smith and R. G. Eggert, Environ. Sci. Technol., 2018, 52, 3803–3811 CrossRef CAS PubMed.
- J.-R. Riba, C. López-Torres, L. Romeral and A. Garcia, Renewable Sustainable Energy Rev., 2016, 57, 367–379 CrossRef CAS.
- J. Cui, M. Kramer, L. Zhou, F. Liu, A. Gabay, G. Hadjipanayis, B. Balasubramanian and D. Sellmyer, Acta Mater., 2018, 158, 118–137 CrossRef CAS.
- Y. Sugita, H. Takahashi, M. Komuro, K. Mitsuoka and A. Sakuma, J. Appl. Phys., 1994, 76, 6637–6641 CrossRef CAS.
- J. P. Wang, N. Ji, X. Liu, Y. Xu, C. Sánchez-Hanke, Y. Wu, F. M. F. De Groot, L. F. Allard and E. Lara-Curzio, IEEE Trans. Magn., 2012, 48, 1710–1717 CAS.
- H. Takahashi, M. Igarashi, A. Kaneko, H. Miyajima and Y. Sugita, IEEE Trans. Magn., 1999, 35, 2982–2984 CrossRef CAS.
- V. Zhukova, J. J. Val, M. Ilyn, M. Ipatov, R. Varga, C. Garcia and a. Zhukov, J. Korean Phys. Soc., 2013, 62, 1940–1944 CrossRef CAS.
- R. Zulhijah, A. B. Dani Nandiyanto, T. Ogi, T. Iwaki, K. Nakamura and K. Okuyama, Nanoscale, 2014, 6, 6487 RSC.
- R. Zulhijah, A. B. D. Nandiyanto, T. Ogi, T. Iwaki, K. Nakamura and K. Okuyama, J. Magn. Magn. Mater., 2015, 381, 89–98 CrossRef CAS.
- I. Dirba, C. A. Schwöbel, L. V. B. Diop, M. Duerrschnabel, L. Molina-Luna, K. Hofmann, P. Komissinskiy, H.-J. Kleebe and O. Gutfleisch, Acta Mater., 2017, 123, 214–222 CrossRef CAS.
- M. Q. Huang, W. E. Wallace, S. Simizu, a. T. Pedziwiatr, R. T. Obermyer and S. G. Sankar, J. Appl. Phys., 1994, 75, 6574 CrossRef CAS.
- Y. Jiang, M. Al Mehedi, E. Fu, Y. Wang, L. F. Allard and J. Wang, Sci. Rep., 2016, 6, 25436 CrossRef CAS PubMed.
- Y. Jiang, V. Dabade, L. F. Allard, E. Lara-Curzio, R. James and J.-P. Wang, Phys. Rev. Appl., 2016, 6, 024013 CrossRef.
- J.-P. Wang, Y. Jiang, A. Mehedi and J. Liu, in 24th International Workshop on Rare-Earth and Future Permanent Magnets and Their Applications (REPM 2016), 2016, p. 1430 Search PubMed.
- K. H. Jack, Proc. R. Soc. A, 1951, 208, 216–224 CAS.
- E. H. D. M. van Voorthuysen, D. O. Boerma and N. C. Chechenin, Metall. Mater. Trans. A, 2002, 33, 2593–2598 CrossRef.
- M. Mehedi, Y. Jiang, B. Ma and J.-P. Wang, Acta Mater., 2019, 167, 80–88 CrossRef CAS.
- K. H. Jack, J. Appl. Phys., 1994, 76, 6620–6625 CrossRef CAS.
- M. Q. Huang, W. E. Wallace, S. Simizu, a. T. Pedziwiatr, R. T. Obermyer and S. G. Sankar, J. Appl. Phys., 1994, 75, 6574–6576 CrossRef CAS.
- A. Nagatomi, S. Kikkawa, T. Hinomura, S. Nasu and F. Kanamaru, J. Jpn. Soc. Powder Powder Metall., 1999, 46, 151–155 CrossRef CAS.
- T. Hattori, N. Kamiya and Y. Kato, J. Magn. Soc. Jpn., 2001, 25, 927–930 CrossRef CAS.
- T. Ogawa, Y. Ogata, R. Gallage, N. Kobayashi, N. Hayashi, Y. Kusano, S. Yamamoto, K. Kohara, M. Doi, M. Takano and M. Takahashi, Appl. Phys. Express, 2013, 6, 073007 CrossRef.
- K. Takagi, M. Akada, K. Ozaki, N. Kobayashi, T. Ogawa, Y. Ogata and M. Takahashi, J. Appl. Phys., 2014, 115, 103905 CrossRef.
- T. Ogi, A. B. Dani Nandiyanto, Y. Kisakibaru, T. Iwaki, K. Nakamura and K. Okuyama, J. Appl. Phys., 2013, 113, 164301 CrossRef.
- W. P. Tong, N. R. Tao, Z. B. Wang, J. Lu and K. Lu, Science, 2003, 299, 686–688 CrossRef CAS PubMed.
- Z. Li, Q. Xu and B. Liu, Comput. Mater. Sci., 2015, 107, 122–133 CrossRef CAS.
- C. Zhang and M. Enomoto, Acta Mater., 2006, 54, 4183–4191 CrossRef CAS.
- L. Yu, C. Yang and Y. Hou, Nanoscale, 2014, 6, 10638–10642 RSC.
- V. B. Trindade, R. Borin, B. Z. Hanjari, S. Yang, U. Krupp and H.-J. Christ, Mater. Res., 2005, 8, 365–369 CrossRef CAS.
- J. P. Wang, D. H. Han, H. L. Luo, Q. X. Lu and Y. W. Sun, Appl. Phys. A: Mater. Sci. Process., 1995, 61, 407–413 CrossRef.
- K. Ho, X. Xiong, J. Zhi and L. Cheng, J. Appl. Phys., 1993, 74, 6788–6790 CrossRef CAS.
Footnote |
| † Electronic supplementary information (ESI) available. See DOI: 10.1039/c9na00008a |
| This journal is © The Royal Society of Chemistry 2019 |

