Ultrafast excited state dynamics of nonfluorescent cyclopheophorbide-a enol, a catabolite of chlorophyll-a detoxified in algae-feeding aquatic microbes†
Chikashi
Ota
 a,
Keita
Sugihara
a,
Yusuke
Kinoshita
a,
Keita
Sugihara
a,
Yusuke
Kinoshita
 b,
Yuichiro
Kashiyama
bc,
Yutaka
Nagasawa
 *a and
Hitoshi
Tamiaki
 *b
*b
aCollege of Life Sciences, Ritsumeikan University, Kusatsu, Shiga 525-8577, Japan. E-mail: ynagasa@fc.ritsumei.ac.jp
bGraduate School of Life Sciences, Ritsumeikan University, Kusatsu, Shiga 525-8577, Japan. E-mail: tamiaki@fc.ritsumei.ac.jp
cGraduate School of Engineering, Fukui University of Technology, Fukui, Fukui 910-8505, Japan
First published on 24th September 2018
Abstract
For photosynthetic organisms that nourish the earth's biosphere, chlorophylls (Chls) are the major pigments utilized for light harvesting and primary charge separation. Although Chl molecules are effective photosensitizers, they are inevitably phototoxic to living organisms due to the facile generation of highly oxidative singlet oxygen (1O2) through triplet energy transfer from their photoexcited states to oxygen molecules. Such phototoxicity of Chls is a major problem for translucent microbes that feed on photosynthetic algae. Recently, it has been reported that the metabolic conversion of Chls-a/b to 132,173-cyclopheophorbide-a/b enols (cPPB-a/bEs) is the detoxification mechanism for algivorous protists. cPPB-a/bEs are colored π-conjugated cyclic tetrapyrroles but are nonfluorescent due to efficient nonradiative decay. In this study, femtosecond time-resolved transient absorption spectroscopy was applied to cPPB-aE with the aim of understanding its quenching mechanism. As a result, we have captured the ultrafast generation of an intermediate state (∼140 fs) that leads to the rapid internal conversion to the ground state (∼450 fs).
Introduction
Photosynthesis by plants, algae, and bacteria is the main source of energy for the biosphere on earth.1 Sunlight illuminated on the surface of the earth is harvested by antenna pigments and transferred to the reaction center where primary charge separation (CS) takes place. The electrical potential energy difference across the membrane accumulated by the CS is converted to nutritious chemical compounds such as saccharides and starch after a long chain of chemical reactions. Cyclic tetrapyrrole compounds, chlorophyll(Chl)s-a/b/c/d/f and bacteriochlorophylls-a/b/c/d/e/f/g, are the major light-harvesting antenna pigments for eukaryotic photosynthetic organisms and anoxygenic photosynthetic bacteria, respectively.2Naturally occurring Chls have relatively long lifetimes of the singlet excited (S1) state (a few nanoseconds)3 and become problematic for living cells when their harvested photon energy is not properly consumed by the primary CS.4,5 The S1 states of Chls and their demetalated derivatives, pheophytins, can undergo intersystem crossing to the triplet excited (T1) states with high quantum yields of 0.5–0.95.3 The T1 state lifetimes of these compounds are much longer (0.75–1.5 ms),3 which increases the opportunity of encountering triplet ground state oxygen molecules (3O2) generated by the oxygenic photosynthesis and diffusion inside the living tissue. Vicinal contact at the moment of encounter enables energy transfer from the T1 state of Chl to 3O2 by the Dexter mechanism, generating highly oxidative singlet oxygen (1O2) which is toxic to living organisms.
To minimize the phototoxicity of Chls, it is necessary to either dispose excessively harvested photon energy or eliminate unnecessary Chls.6 For photosynthetic systems in operation, carotenoids function as quenchers of the S1 and T1 states of Chls, and also of 1O2.7–12 The S1 state lifetimes of carotenoids are typically short (a few picoseconds) by nonradiative decay, thus, energy transfer to the carotenoids can dispose redundant photoexcited energy of Chl as heat to the surroundings. For higher plants and algae, a protection mechanism called the “xanthophyll cycle” is also known.8 Under high-light illumination, violaxanthin, with no quenching ability, is de-epoxidized to zeaxanthin which functions as a quencher of the S1 state of Chl. Under low-light conditions, since zeaxanthin is epoxidized to violaxanthin, the photosynthetic reaction is repeatable. Lutein and β-carotene are reported to quench the T1 state of Chl.10,11 During an autumnal tint, deciduous plants catabolise unwanted Chls into colorless nonphototoxic compounds in highly regulated multiple processes known as “PAO pathways” because nutrients in the senescing leaves need to be reutilized efficiently for new growth when spring arrives.13–16 In this process, after the central magnesium is removed and the chlorin π-macrocycle is oxidatively cleaved, Chls are finally converted into unconjugated water-soluble linear tetrapyrroles called “nonfluorescent chlorophyll catabolites”, which are colorless and nonphototoxic.
The phototoxicity of Chls is also a risk for translucent microbes that feed on photosynthetic algae if a massive amount of Chls is liberated during the digestive process.17–19 Recently, it has been reported that the metabolic conversion of Chls-a/b to 132,173-cyclopheophorbide-a/b enols (cPPB-a/bEs) is a major detoxification mechanism in algivorous protists.17–19 As can be seen from its molecular structure shown in Chart 1a, cPPB-aE has an exo-seven-membered cyclic moiety which is π-conjugated with the tetrapyrrole macrocycle. It should be noted that cPPB-a/bEs are colored but essentially nonfluorescent in solution (ΦF < 0.002 for cPPB-aE), i.e., its excited state is rapidly quenched by nonradiative decay. The quenching mechanism has not yet been clarified, although one possibility is that the isomerization induced by proton transfer at the cyclic moiety (Chart 1a) accelerates the nonradiative decay of the S1 state. To investigate the quenching mechanism, femtosecond time-resolved transient absorption (TA) spectroscopy was applied to cPPB-aE and an intermediate state with a short lifetime was observed in the process of rapid internal conversion. The measurement was also applied to a Chl-a derivative, methyl pyropheophorbide-a (MPP-a, Chart 1b), for comparison.
 | ||
| Chart 1 (a) Molecular structures of 132,173-cyclopheophorbide-a enol (cPPB-aE) and its tautomerization and (b) methyl pyropheophorbide-a (MPP-a). | ||
Experimental methods
The experimental setup for the TA measurements were previously described in detail.20,21 The light source for the experiment was a pair of noncollinear optical parametric amplifiers (NOPA, TOPAS-white, Light-Conversion) pumped by a regeneratively amplified Ti:sapphire laser (Solstice, Spectra-Physics). The central wavelength of the output of a NOPA was tuned to 690 nm and utilized as a pump pulse to excite the Qy band of the sample. Overlap of the pump pulse spectra and the absorption spectra of the samples are shown in Fig. S1 of the ESI.† The pulse was compressed by a prism pair and the pulse duration at the sample position was measured to be about 33 fs (fwhm) by the self-diffraction frequency-resolved optical gating (SD-FROG) method. The excitation intensity at the sample position was 50 μW (50 nJ) and the diameter of the focused laser beam was ca. 0.15 mm. The polarization between the pump and probe pulses was set at the magic angle by rotating the polarization of the pump pulse by a Berek compensator (Model 5540, New Focus).The output of the second NOPA centered at 1000 nm was focused into a rotating CaF2 window (thickness: 2 mm) and a white-light supercontinuum (400–950 nm) was generated which was divided into probe and reference pulses. The probe pulse was focused into a rotating sample cell excited by the pump pulse and the transmitted light was guided into a multichrometer (PK120-C Unisoku), while the reference pulse was directly guided into another multichrometer and the differential absorbance (ΔAbs) of the sample was calculated from these data. The wavelength range and the number of pixels of the detector were 332–928 nm and 512 pixels, hence the resultant wavelength resolution was 1.2 nm per pixel.
The optical length of the sample inside the rotating cell was 0.2 mm. Samples were dissolved in dichloromethane (DCM, Infinity Pure grade, Wako Pure Chemical Industries) and the absorbance was set at ca. 0.75 at the maximum of the Qy band. The heterodyne-detected optical Kerr effect (HD-OKE) signal between the pump and the probe pulses, shown in Fig. S3 of ESI,† was obtained by replacing the sample solution in the rotating cell by neat carbon tetrachloride and the electronic response signal was utilized to compensate the group velocity dispersion of the TA signal.
cPPBa-E and MPP-a were prepared by chemical modification of naturally occurring Chl-a as reported previously.17,18 Electronic absorption and fluorescence spectra of the samples were measured by V-730RN from JASCO and RF-6000 from Shimadzu, respectively.
Results and discussion
Steady-state spectra
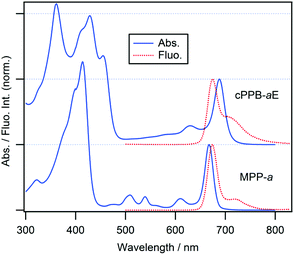
Molecular structures of cPPB-aE and MPP-a and their steady-state absorption and fluorescence spectra in DCM are shown in Chart 1 and Fig. 1, respectively. DCM was chosen because cPPB-aE is stable in this solvent. The Soret and Qy absorption bands of MPP-a peak at 414 and 667 nm, respectively, and the fluorescence maximum is located at 674 nm (excited at the intense Soret maximum, 414 nm), which is adjacent to the red side of the sharp Qy band. The fluorescence quantum yield and the fluorescence lifetime of MPP-a are 27% and 6.8 ns.22 The Soret band of cPPB-aE is primarily split into peaks at 361 and 428 nm and the Qy maximum is situated at 688 nm, while the fluorescence emission maximum at 675 nm from the solution (excited at the Soret maximum, 428 nm) is on the blue side of the maximum of the Qy band.In Fig. S2 of ESI,† the fluorescence excitation spectrum, monitored at 700 nm of the solution, is compared with the absorption spectrum of cPPB-aE which is significantly different. The Qy band of the excitation spectrum is blue-shifted to 672 nm, as expected from the fluorescence spectrum, apparent Qx bands are visible at 510 and 540 nm and a single Soret band at 412 nm is observed. These results imply that the blue-shifted fluorescence is not originating from cPPB-aE. It is noteworthy that the excitation of the solution at 455 nm (the red-most Soret maximum) gave no emission, indicating that cPPB-aE is essentially nonfluorescent. The excitation spectrum is rather similar to the absorption spectrum of MPP-a, suggesting the elimination of π-conjugation between the exo-seven-membered ring and the tetrapyrrole macrocycle. From the molecular structure shown in Chart 1a, isomerization by proton transfer is expected for cPPB-aE (enol-17 and enol-13) and its tautomerization can also produce a diketone-form, where the conjugation is dissolved. Thus, the blue-shifted emission is considered to originate from some minor species in the solution such as the diketone-form or its photo-oxidized products (132-OH form, Chart S1 of ESI†). The absorption spectrum of the 132-OH form is very similar to that of MPP-a also suggesting the elimination of the π-conjugation.23
Femtosecond time-resolved TA spectra
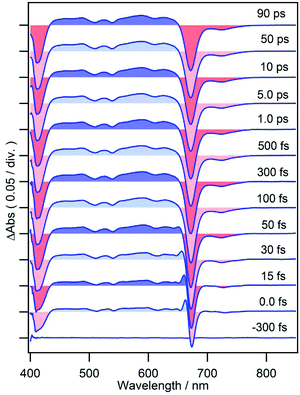
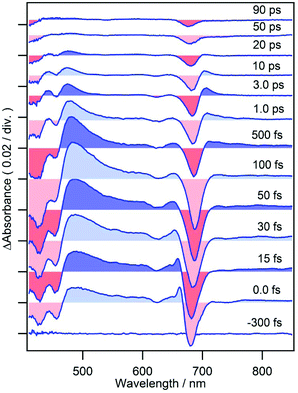
Femtosecond time-resolved TA spectra of MPP-a in DCM are shown in Fig. 2 from −300 fs to 90 ps which exhibit strong negative bands at 413 and 671 nm corresponding to the ground state bleach (GSB) of Soret and Qy bands. A broad TA band corresponding to the singlet excited state absorption (ESA) appears between 440–650 nm. The weak negative band at 700–750 nm, where the ground state absorption is absent, is due to the stimulated emission (SE) with a vibrational structure peaking at 723 nm (also see the fluorescence spectrum of MPP-a shown in Fig. 1 with a vibrational maximum at 718 nm). As expected from the strong fluorescence, the TA spectrum is nearly time-independent during the observation time window. Only a small change can be seen at 640–665 nm in the early times, presumably by vibrational relaxation.When cPPB-aE is photoexcited by a femtosecond laser, as shown in Fig. 3, GSBs corresponding to the Soret and Qy bands appear at 400–460 and 685 nm and a characteristic ESA band appears with a maximum at 480 nm. The band at 480 nm rapidly disappears in the time range of picoseconds and simultaneously a new weak band appears at 706 nm around 1.0 ps. The weak band is located on the longer wavelength edge of the ground state bleach, suggesting that it is due to a vibrationally hot ground state. Similar hot bands are commonly observed by TA measurements of molecules that undergo rapid nonradiative decay.24,25 Note that the GSB of the Qy band is still observable at 90 ps (about 6% of the original ΔAbs) where the ESA at 480 nm has already vanished. The minimum of the bleach at 90 ps is located at 675 nm which is blue shifted compared to that at 100 fs (687 nm). Hence, the remaining GSB can be interpreted to be due to the long-living excited state of the diketone-form isomer (Chart 1a) or some other photoproduct. Such species gave fluorescence bands on the blue side of the ground state absorption maximum of cPPB-aE (Fig. 1a), thus, the GSB of the minor species is expected to appear at shorter wavelengths than that of cPPB-aE. This consideration can be confirmed from the blue-shifted Qy band of the fluorescence excitation spectrum, shown in Fig. S2 of ESI,† which peaks at 672 nm.
Rise of the intermediate state
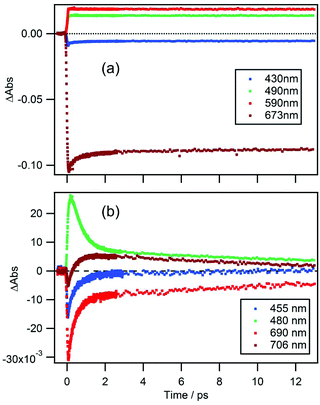
Time-dependences of ΔAbs for the two compounds at characteristic wavelengths are shown in Fig. 4. For MPP-a (Fig. 4a), the ESA bands monitored at 490 and 590 nm are nearly constant throughout the entire observation window indicating a long excited state lifetime as expected from the strong fluorescence seen in Fig. 1. Recovery of the GSB of the Qy band at 673 nm can be fitted with four components with time constants of 51 ± 9 fs (25%), 590 ± 30 fs (8%), 8.7 ± 0.9 ps (3%), and ≫100 ps (64%). While the component with the longest time constant (≫100 ps) is attributed to the ground state recovery, the minor components with shorter lifetimes are considered to be caused by vibrational/structural relaxation and solvation.In the case of cPPB-aE (Fig. 4b), the rapid decay and rise of the ESA and GSB can be seen. The recovery of the GSB at 690 nm for the Qy band can be fitted with four components with time constants of 74 ± 17 fs (26%), 410 ± 10 fs (51%), 11 ± 1 ps (17%), and ≫100 ps (6%). The minor component with the longest time constant of ≫100 ps is considered to be the other species including the tautomerized diketone-form and/or its oxidized products, which is the origin of the blue shifted fluorescence shown in Fig. 1. Note that the rise of the ESA at 480 nm seems somewhat slower than the appearance of the GSB seen at other wavelengths. In Fig. 5a, an enlarged view of the signals near the time origin is shown and it can be seen that the maximum of the ESA appears at a longer time (∼200 fs) than the minimum of the GSB (50–75 fs), indicating a delayed rise of the ESA. Such a delay is neither caused by uncompensated group velocity dispersion nor non-uniformity of the time-resolution. It can be seen from Fig. 4a and Fig. S4† (enlarged view of the early times of Fig. 4) that the rise of the MPP-a signal is rather sharp through the wavelength range which confirms the uniformity of the time-resolution. Thus, the delayed rise observed at 455 nm for cPPB-aE is indeed due to the production of a new state. The time-dependence of ΔAbs at 480 nm can be fitted with a rise and three decay components with time constants of 140 fs (−67%), 500 ± 10 fs (83%), 13 ± 1 ps (14%), and ≫100 ps (3%), respectively. The rise component with a time constant of 140 fs suggests that an intermediate species which absorbs around 480 nm is produced in the ultrafast time range.
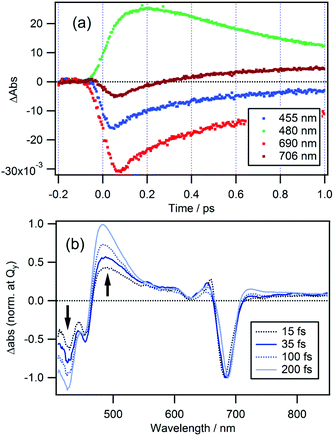 | ||
| Fig. 5 (a) Time traces of Δabs at probe wavelengths of 455, 480, 690, and 706 nm for cPPB-aE in DCM. (b) TA spectra normalized at the Qy band of cPPB-aE at time delays of 15, 35, 100, and 200 fs. | ||
TA spectra of cPPB-aE at 15, 35, 100, and 200 fs are normalized at the Qy band to eliminate the effect of population change as shown in Fig. 5b. In this manner, the spectral evolution can be clearly observed. The initially populated state, with a spectral feature similar to that of the excited state of MPP-a (weak broad ESA at 440–670 nm), rapidly converts to a new intermediate state with a characteristic ESA band with a maximum at 480 nm. Note that the negative band in the range of ≤460 nm also deepens in this time range.
Decay of the intermediate state and heat dissipation
The spectral evolution continues on a longer time scale as can be seen from the spectra shown in Fig. 6 which are also normalized at the Qy band. The ESA band at 480 nm weakens and shifts to shorter wavelengths and the negative band at ≤460 nm decreases. Simultaneously, a weak band appears at 706 nm, which is assigned to the hot band of the ground state populated by the rapid nonradiative decay. The time-evolution of ΔAbs at 706 nm could be fitted by two rises and two decays with time constants of 160 ± 40 fs (−29%), 450 ± 40 fs (−63%), 15 ± 1 ps (48%) and ≫100 ps (−8%). The time constant for the second rise component matches with that of the first decay component observed at 480 nm which is 500 ± 10 fs. Thus, we conclude that the intermediate state decays to the ground state with a lifetime of 450–500 fs and a hot ground state is produced. Subsequently, heat is dissipated into the surrounding solvent and cooling of the hot molecules takes place with a time constant of 15 ± 1 ps. Interestingly, a decay component with a time constant of 13 ± 1 ps was also observed at a probe wavelength of 480 nm. We conclude that the remaining blue shifted positive band at 475 nm at a time delay of 3.0 ps (Fig. 6) corresponds to the hot band of Soret absorption.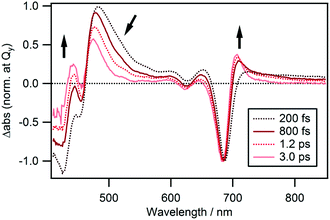 | ||
| Fig. 6 TA spectra normalized at the Qy band of cPPB-aE in DCM at time delays of 0.20, 0.80, 1.2, and 3.0 ps. | ||
Peak shift of the GSB
From Fig. 5b and 6, one can notice that the wavelength at the peak of the GSB for the Qy band (the wavelength at the minimum of the negative band) is not exactly constant. Thus, the GSB band was fitted by a log-normal function (wavelength range: 665–710 nm and 656–693 nm for cPPB-aE and MPP-a, respectively) and the time-evolution of the peak wavelength was obtained. Fig. 7 shows contour plots of the TA spectra around the Qy band plotted against wavelength and time for MPP-a and cPPB-aE in DCM. The white solid curve represents the time-evolution of the peak wavelength. It can be seen that the peak of the GSB for MPP-a is nearly constant after the time origin, while that of cPPB-aE exhibits a complicated time-dependence. Immediately after the photo-excitation, an ultrafast red-shift of the peak occurs within 75 fs, remains constant up to 200 fs, and then gradually shifts to shorter wavelengths in the picosecond range. The peak shift could be fitted with four components with time constants of 17 ± 2 fs (18 ± 2 nm), 190 ± 60 fs (5.2 ± 2.6 nm), 420 ± 50 fs (−8.6 ± 2.8 nm), and 53 ± 3 ps (−9.2 ± 0.3 nm). The red shift with a time constant of 17 ± 2 fs is too short for a chemical process which could be some nonlinear coherent effect during the pump-and-probe pulse overlap. The second red shift of 190 ± 60 fs could be reflecting the production of the intermediate state, while the blue shift of 420 ± 50 fs is definitively due to the ground state recovery and decline of SE. The final blue shift with a time constant of 53 ± 3 ps should be related to the disappearance of the GSB of cPPB-aE by molecular cooling in the ground state which leaves the blue shifted GSB with a long life time.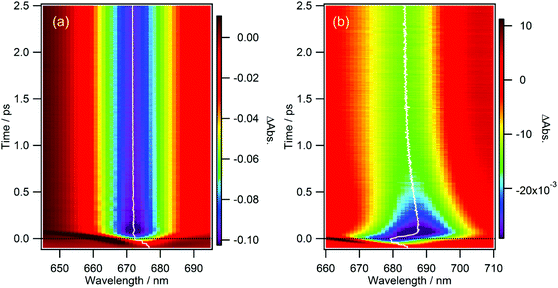 | ||
| Fig. 7 Contour plots of TA spectrum against wavelength and time for (a) MPP-a and (b) cPPB-aE in DCM. The white solid curve represents the time-evolution of the peak wavelength. | ||
Decay associated spectra
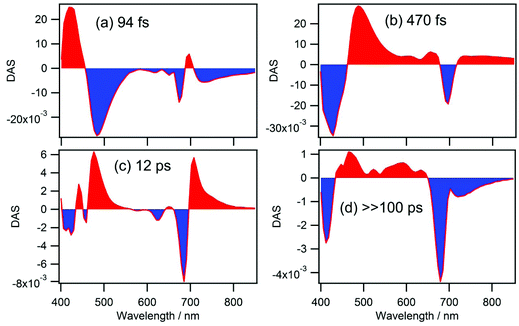
Close inspection of the time-resolved TA spectra so far leads us to the following kinetics. (i) Immediately after the photoexcitation, an intermediate state that absorbs around 480 nm is produced with a time constant of 70–140 fs. (ii) The intermediate state rapidly decays to the ground state with a lifetime of 400–500 fs producing hot ground state molecules with TA absorption bands at 475 and 706 nm. (iii) Heat dissipation and cooling of the ground state occurs with a time constant of 13–15 ps. (iv) Finally, only the fluorescent impurity from the aforementioned species with a long lifetime remains in the excited state.To confirm these findings, we have carried out global analysis of the data.26–28 Time profiles at various probe wavelengths were fitted by a set of time constants and decay associated spectra (DAS) were obtained which are exhibited in Fig. 8. As expected, four components with time constants of 94 fs, 470 fs, 12 ps, and ≫100 ps were obtained. The DAS component with the shortest time constant of 94 fs (Fig. 8a) represents the spectral evolution shown in Fig. 5b where the ultrafast production of the intermediates state occurs. The negative band at 482 nm and the positive band at 420 nm represent the rise of the ESA of the intermediate state and the deepening of the Soret band GSB, respectively. However, the time constant of 94 fs is shorter than that obtained for the rise at 480 nm (140 fs) because it is averaged over the wavelength range of 400–850 nm. The small negative and positive bands at 673 nm and 697 nm represent the ultrafast red-shift of the SE which occurs biphasically with time constants of 17 ± 2 and 190 ± 60 fs (vide supra). Thus, incorporation of the shorter lifetime seems to be reducing the averaged time constant. The DAS component of 470 fs (Fig. 8b) represents the dynamics exhibited in Fig. 6, i.e., the positive band at 488 nm corresponds to the decay of the ESA band of the intermediate state, while negative bands at 430 and 697 nm correspond to the recovery of the GSB and formation of the hot ground state. The positive peaks at 477 and 708 nm and the negative peak at 685 nm, in Fig. 8c for the DAS component of 12 ps, represent cooling of the hot ground state. Finally, the DAS shown in Fig. 8d with a long lifetime of ≫100 ps represents the remaining excited states of the minor species (vide supra).
Conclusions
Femtosecond time-resolved TA spectroscopy was applied to cPPB-aE which is a catabolite produced by detoxification of Chl-a by algivorous protists that feed on photosynthetic algae.17,18 cPPB-aE is a colored π-conjugated cyclic tetrapyrrole but nonfluorescent due to efficient nonradiative decay. In this study, the fluorescence quenching dynamics of cPPB-aE were revealed by femtosecond TA spectroscopy. Immediately after the photoexcitation, an intermediate state that absorbs around 480 nm is produced with a time constant of ∼140 fs. For cPPB-aE, chemical equilibrium is expected between enol-17 and enol-13 isomers as shown in Chart 1a. The production of the intermediate state could be representing an achievement of a new equilibrium between these isomers in the excited state. Subsequently, the intermediate state rapidly decays to the ground state with a lifetime of ∼450 fs which produces a hot ground state that exhibits TA bands at 475 and 706 nm. Finally, heat dissipation and cooling of the ground state occur with a time constant of 13–15 ps and the system reaches the original thermal equilibrium again.Rapid nonradiative deactivation mediated by proton transfer and/or hydrogen bonding is also reported for other systems such as indigo which is a natural dye.29 It is shown by ab initio calculations that indigo undergoes intramolecular proton transfer between adjacent N–H and C![[double bond, length as m-dash]](https://www.rsc.org/images/entities/char_e001.gif) O groups in the 1ππ* excited state which provides a pathway for a very efficient deactivation to the ground state.29 A similar mechanism could also be working for cPPB-aE. To confirm this assumption, time-resolved IR spectroscopy is currently being carried out to directly monitor the dynamics of O–H and C
O groups in the 1ππ* excited state which provides a pathway for a very efficient deactivation to the ground state.29 A similar mechanism could also be working for cPPB-aE. To confirm this assumption, time-resolved IR spectroscopy is currently being carried out to directly monitor the dynamics of O–H and C![[double bond, length as m-dash]](https://www.rsc.org/images/entities/char_e001.gif) O vibrations of cPPB-aE.
O vibrations of cPPB-aE.
Conflicts of interest
There are no conflicts to declare.Acknowledgements
This study was supported by JSPS KAKENHI Grant Numbers JP26107010 and JP17H06436 in the Scientific Research on Innovative Areas “Photosynergetics” to YN and “Innovation for Light-Energy Conversion (I4LEC)” to HT, respectively. YN was also supported by JSPS KAKENHI Grant Number JP16K13940, Grant-in-Aid for challenging Exploratory Research. YK was supported by JSPS KAKENHI Grant Number JP16K14813.References
- R. E. Blankenship, Molecular Mechanisms of Photosynthesis, Wiley-Blackwell, 2nd edn, 2014 Search PubMed.
- H. Tamiaki, R. Shibata and T. Mizoguchi, Photochem. Photobiol., 2007, 83, 152–162 CAS.
- M. Montalti, A. Credi, L. Prodi and M. T. Gandolfi, Handbook of Photochemistry, CRC Press, 3rd edn, 2006 Search PubMed.
- X.-P. Li, P. Müller-Moulé, A. M. Gilmore and K. K. Niyogi, Proc. Natl. Acad. Sci. U. S. A., 2002, 99, 15222–15227 CrossRef CAS PubMed.
- C. Külheim, J. gren and S. Jansson, Science, 2002, 297, 91–93 CrossRef PubMed.
- Y. Kashiyama and H. Tamiaki, Chem. Lett., 2014, 43, 148–156 CrossRef CAS.
- R. J. Cogdell and H. A. Frank, Biochim. Biophys. Acta, Rev. Bioenerg., 1987, 895, 63–79 CrossRef CAS.
- B. Demmig-Adams, A. M. Gilmore and W. W. Adams 3rd, FASEB J., 1996, 10, 403–412 CrossRef CAS PubMed.
- M. Kobayashi and Y. Sakamoto, Biotechnol. Lett., 1999, 21, 265–269 CrossRef CAS.
- M. Mozzo, L. Dall'Osto, R. Hienerwadel, R. Bassi and R. Croce, J. Biol. Chem., 2007, 283, 6184–6192 CrossRef PubMed.
- F. Müh, T. Renger and A. Zouni, Plant Physiol. Biochem., 2008, 46, 238–264 CrossRef PubMed.
- P. Pospíšil, Biochim. Biophys. Acta, Bioenerg., 2012, 1817, 218–231 CrossRef PubMed.
- S. Hörtensteiner and B. Kräutler, Biochim. Biophys. Acta, Bioenerg., 2011, 1807, 977–988 CrossRef PubMed.
- M. Oberhuber, J. Berghold, K. Breuker, S. Hörtensteiner and B. Kraütler, Proc. Natl. Acad. Sci. U. S. A., 2003, 100, 6910–6915 CrossRef CAS PubMed.
- A. Pružinská, G. Tanner, I. Anders, M. Roca and S. Hörtensteiner, Proc. Natl. Acad. Sci. U. S. A., 2003, 100, 15259–15264 CrossRef PubMed.
- B. Kuai, J. Chen and S. Hörtensteiner, J. Exp. Bot., 2018, 69, 751–767 CrossRef PubMed.
- Y. Kashiyama, A. Yokoyama, Y. Kinoshita, S. Shoji, H. Miyashita, T. Shiratori, H. Suga, K. Ishikawa, A. Ishikawa, I. Inouye, K. Ishida, D. Fujinuma, K. Aoki, M. Kobayashi, S. Nomoto, T. Mizoguchi and H. Tamiaki, Proc. Natl. Acad. Sci. U. S. A., 2012, 109, 17328–17335 CrossRef CAS PubMed.
- Y. Kashiyama, A. Yokoyama, T. Shiratori, I. Inouye, Y. Kinoshita, T. Mizoguchi and H. Tamiaki, FEBS Lett., 2013, 587, 2578–2583 CrossRef CAS PubMed.
- Y. Kinoshita, M. Kayama, Y. Kashiyama and H. Tamiaki, Bioorg. Med. Chem. Lett., 2018, 28, 1090–1092 CrossRef CAS PubMed.
- Y. Nagasawa, Y. Yoneda, S. Nambu, M. Muramatsu, E. Takeuchi, H. Tsumori, S. Morikawa, T. Katayama and H. Miyasaka, Chem. Phys., 2014, 442, 68–76 CrossRef CAS.
- H. Nakagawa, A. Matsumoto, A. Daicho, Y. Ozaki, C. Ota and Y. Nagasawa, J. Photochem. Photobiol., A, 2018, 358, 308–314 CrossRef CAS.
- K. Kim, K. Tsuji, Y. Kinoshita, T. Miyatake and H. Tamiaki, Tetrahedron, 2017, 73, 313–321 CrossRef CAS.
- L. Ma and D. Dolphin, J. Org. Chem., 1996, 61, 2501–2510 CrossRef CAS.
- Y. Nagasawa, Y. Ando, D. Kataoka, H. Matsuda, H. Miyasaka and T. Okada, J. Phys. Chem. A, 2002, 106, 2024–2035 CrossRef CAS.
- Y. Kimura, T. Yamaguchi and N. Hirota, Phys. Chem. Chem. Phys., 2000, 2, 1415–1420 RSC.
- D. V. O'Connor and D. Phillips, Time-Correlated Single Photon Counting, Academic Press, 2012 Search PubMed.
- J. M. Beechem, M. Ameloot and L. Brand, Chem. Phys. Lett., 1985, 120, 466–472 CrossRef CAS.
- Y. Yoneda, T. Noji, T. Katayama, N. Mizutani, D. Komori, M. Nango, H. Miyasaka, S. Itoh, Y. Nagasawa and T. Dewa, J. Am. Chem. Soc., 2015, 137, 13121–13129 CrossRef CAS PubMed.
- S. Yamazaki, A. L. Sobolewski and W. Domcke, Phys. Chem. Chem. Phys., 2011, 13, 1618–1628 RSC.
Footnote |
| † Electronic supplementary information (ESI) available. See DOI: 10.1039/c8pp00173a |
| This journal is © The Royal Society of Chemistry and Owner Societies 2019 |

