Formation of a supramolecular charge-transfer complex. Ultrafast excited state dynamics and quantum-chemical calculations
Valery V.
Volchkov
 *a,
Mikhail N.
Khimich
 a,
Mikhail V.
Rusalov
 a,
Fedor E.
Gostev
b,
Ivan V.
Shelaev
b,
Viktor A.
Nadtochenko
 ab,
Artem I.
Vedernikov
c,
Sergey P.
Gromov
ac,
Alexandra Ya.
Freidzon
 cd,
Michael V.
Alfimov
c and
Mikhail Ya.
Melnikov
 a
a
aChemistry Department, M. V. Lomonosov Moscow State University, 1-3 Leninskie Gory, Moscow 119991, Russian Federation. Fax: +7 (495) 9328846; Tel: +7 (495) 9391671E-mail: volchkov_vv@mail.ru
bN. N. Semenov Institute of Chemical Physics, Russian Academy of Sciences, 4 Kosygina str., Moscow 119991, Russian Federation. Fax: +7 (499) 1378357; Tel: +7 (495) 9397347
cPhotochemistry Center, FSRC “Crystallography and Photonics”, Russian Academy of Sciences, 7A-1 Novatorov str., Moscow 119421, Russian Federation. Fax: +7 (495) 9361255; Tel: +7 (495) 9350116
dNational Research Nuclear University MEPhI (Moscow Engineering Physics Institute), Kashirskoye shosse 31, Moscow 115409, Russia
First published on 21st November 2018
Abstract
The formation of a supramolecular complex of bis(18-crown-6)stilbene (1) and 4,4′-bipyridine with two ammoniopropyl N-substituents (3) and the substitution reaction between 1·3 and alkali and alkaline-earth metal perchlorates have been studied using absorption, steady-state fluorescence, and femtosecond transient absorption spectroscopy. The formation of 1·(Mn+)2 complexes in acetonitrile was demonstrated. The weak long-wavelength charge-transfer absorption band of 1·3 completely vanishes upon complexation with metal cations because of disruption of the pseudocyclic structure. The spectroscopic and luminescence parameters, stability and substitution constants were calculated. The relaxation scheme of the 1·3 singlet state excited by a 25 fs laser pulse was proposed. It includes very fast vibrational relaxation and direct (τCT-d = 0.32 ps) and back (τCT-b = 0.51 ps) electron transfer resulting in complete fluorescence quenching. The quantum-chemistry calculations revealed the species taking part in the ET process and elucidated the mechanism of relaxation of the excited complex.
Introduction
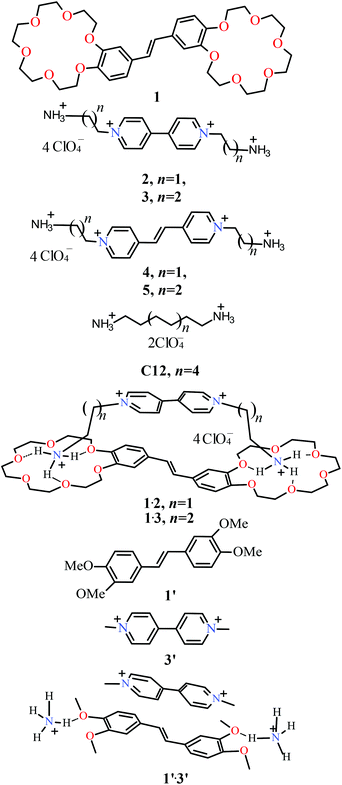
The first ultrafast spectroscopic investigation of electron photo-transfer in donor–acceptor complexes using transient absorption and fluorescence spectroscopy was carried out by the Mataga group for pyrene-pyromellitic dianhydride (PMDA) systems.1 Later, various donor–acceptor systems connected by single covalent bonds (D–A)2,3 or flexible carbohydrate chains (D-b-A)4,5 have been studied. Initially, decreasing the exponential dependence (instead of the bell-shaped one) between the driving force −ΔGIP and charge recombination rate constants was shown for contact D–A complexes in acetonitrile.2 It was found that variation of electronic coupling and the distance between the D and A units can influence the process of their separation and recombination. Usually charge separation in such systems correlates with solvent relaxation time, but sometimes it occurs more rapidly. In many cases the excited state relaxation kinetics are bi-exponential. Non-exponential kinetics can be observed when charge transfer is solvent controlled or accompanied by possible intramolecular conformational changes.6 When single bond deformation within the complex affects the averaged inter-chromophore D–A angle, spectral-kinetic parameters are considerably dependent upon viscosity.7 Numerous studies in this field are presented in an extensive review.8However, the transient absorption studies of D-b-A complexes, wherein the donor is connected with the acceptor via several hydrogen bonds, are scarce. We continue the studies of the thermodynamic and photophysical properties of the complexes between (E)-bis(18-crown-6)stilbene (1), alkaline and alkaline-earth metal cations and the dynamics of photoinduced electron transfer in the hydrogen-bonded donor–acceptor complexes of bis(18-crown-6)stilbene with the ammonioalkyl derivatives of (E)-1,2-di(4-pyridyl)ethylene (4, 5), 4,4′-bipyridine (2, 3) and 2,7-diazapyrene.9–11 Their high thermodynamic stability is achieved via cooperative intermolecular coordination of both NH3+ acceptor groups with two crown-ether fragments of the donor. Variations of the inter-chromophore distances in such bi- and trimolecular complexes D·A and D·A·D influence the intensities of charge-transfer (CT) absorption bands12 and the parameters of intramolecular electron transfer.9,10 Variations in the electron-withdrawing abilities of the central acceptor moiety and the length of ammonioalkyl fragments affect spectral-luminescence parameters, stability, substitution, and dissociation constants. Similar to the related bis(crown-ether) derivatives of distirylbenzene,13 the complexes of bis-crown stilbene may be viewed as fluorescent chemosensors. In this work we established the stoichiometry of the substitution reaction between complex 1·3 and alkaline and alkaline-earth metal cations. The substitution constants were calculated for cations (strong and weak competitors). A relaxation scheme was proposed for the excited singlet state of 1·3.
Experimental
The structural formulas of compounds 1–5, C12 and complexes 1·2 and 1·3 are shown in Chart 1. An efficient synthesis of stilbene 1 is described in ref. 14. The syntheses of acceptor compounds 2 and 3 as well as compounds 4 and 5 are described in ref. 15, 14 and 16, respectively. 1H NMR spectra were obtained with a Bruker DRX500 instrument. 1,1′-Bis(3-ammoniopropyl)-4,4′-bipyridinium tetraperchlorate (1·3) 1H NMR (MeCN-d3, 500.13 MHz, 25 °C) d: 2.41, (m, 4H, 2 CH2CH2N, 3.13 (m, 4H, 2 CH2NH3), 4.72 (t, J = 7.7 Hz, 4H, 2 CH2N), 8.47 (d, J = 6.7 Hz, 4H, 2 3-H, 2 5-H), 8.97 (d, J = 6.7 Hz, 4H, 2 2-H, 2 6-H).Steady-state absorption and fluorescence spectra were obtained at 298 K with a Shimadzu-3100 spectrophotometer, as well as with PerkinElmer LS-55 and Elumin-2M spectrofluorimeters. The fluorescence quantum yields were determined by comparing the areas under the corrected fluorescence spectra of degassed solutions of the samples and that of quinine bisulfate in 1 N H2SO4 (Φf = 0.546).17 The solutions were degassed by bubbling nitrogen through them for 15 min, except for quinine bisulfate in 1 N H2SO4. The details of transient spectra measurements were described in our previous publication.18 The corrected transient absorption spectra were subjected to a global fitting procedure based on the alternating-variable descent method supposing triexponential decay. The global fitting procedure implies that the resulting characteristic times, unlike the pre-exponential factor or the constant term, do not depend on the detection wavelength. The calculation was performed using the set of experimental data for the 400–800 nm range from 0 to 3 ps. The procedure implied minimization of the root-mean-square deviations between the experimental and theoretical data matrices, calculated by variation of the characteristic times τi. The calculations were carried out using a script composed of standard MATLAB 6.0 functions. The average uncertainty was ∼5%. The deconvolution was not carried out. Spectral grade purity (Merck) Li, Na, K, Mg, Ca, and Ba perchlorates were dehydrated by drying in vacuo (0.01 mm Hg) at 200 °C for 5 h in a VacuCell apparatus. All measurements were carried out with freshly prepared solutions in acetonitrile (Fisher, HPLC gradient grade, water content 0.0021%) and freshly distilled butyronitrile (Merck) at 298 K.
The fluorescence spectra of 1 and 1·3 in butyronitrile at 77 K were recorded on an Elumin-2M spectrofluorimeter using a specially designed micro-Dewar vessel. The substitution constants were calculated with the “Equilibrium” program based on a multivariable nonlinear least-squares method.19 The stability constant of 1·3 was determined by means of a guest-competitor titration method. Average uncertainty amounted to ∼10%. To avoid minor dissociation of complex 1·3 caused by traces of water in acetonitrile, the fluorescence spectra of the 1·3/MeCN/metal perchlorate system were obtained in solutions of 1·3 with a 4-fold excess of acceptor 3.
Quantum chemical calculations were performed using the GAMESS (US)20,21 program package with the 6-31G(d,p) basis set. The geometry of the complex in its ground state was optimized by means of DFT; its excited states were optimized by means of TDDFT. We used a BHHLYP functional with empirical dispersion correction version 3 with Becke–Johnson damping22 for the ground state; the excited states were optimized without dispersion correction. The environmental effects were included via the solvation model density continuum model.23 The S0 → Sn absorption, emission, and S1 → Sn absorption spectra were calculated using the Firefly v.8.2 program package24 by means of the state-averaged complete active space self-consistent field (SA-CASSCF)25–29 improved by second-order quasi-degenerate perturbation theory (XMCQDPT2).30 The spectra were calculated for a model system 1′·3′ consisting of 1,2-bis(3,4-dimethoxyphenyl)ethene (1′) as a donor, 1,1′-dimethyl-4,4′-bipyridinium (3′) as an acceptor, and two ammonium cations. The geometrical parameters of the model system were the same as those of the entire complex in the corresponding state. The environmental effects were included via the dielectric polarizable continuum DPCM model.31 The active space included 8 electrons in 12 orbitals. The density matrix was averaged over 11 lowest singlet states (XMCQDPT2//SA(11)-CASSCF(8,12)/6-31G(d,p)/DPCM). The charge distributions in the ground and excited states of the complex were found from the Mulliken charges on the donor and acceptor fragments.
Results and discussion
Ground state complexation and substitution reactions
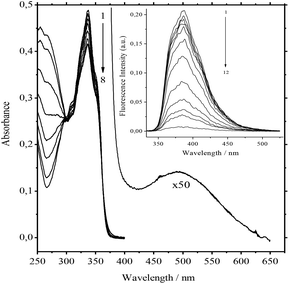
The addition of 3 to solutions of 1 in acetonitrile induces weak hypsochromic and pronounced hypochromic shifts in the absorption spectra.The broad absorption band of a very low intensity appears in the long-wave region. It was attributed to the charge-transfer (CT) band (Fig. 1). Within the error of 0.002 absorbance units, the absorption spectra of the main band have 3 linearly independent components. Mainly pseudocyclic complex 1![[thin space (1/6-em)]](https://www.rsc.org/images/entities/char_2009.gif) :
:![[thin space (1/6-em)]](https://www.rsc.org/images/entities/char_2009.gif) 1 is formed in diluted solutions at low concentrations of reactants.
1 is formed in diluted solutions at low concentrations of reactants.
 | (1) |
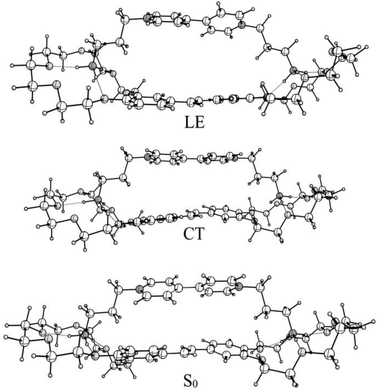
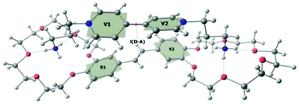
According to quantum-chemical calculations, the aromatic donor and acceptor moieties of 1·3 are non-planar in the ground state (Fig. 2). The BHHLYP/6-31G(d,p) optimized dihedral angle between the two pyridyl fragments of viologen is ∼39°, which agrees with the X-ray crystal data.15
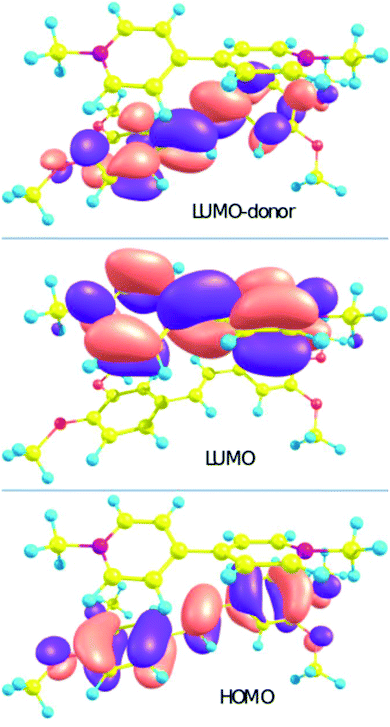
The calculation of the S0 → Sn transition parameters of 1′·3′ by XMCQDPT makes it possible to verify that the CT state is not an artifact. The calculation (Table 1) allows us to assign the S0 → S1 transition to the charge transfer (CT) from the HOMO localized on the donor to the LUMO localized on the acceptor (Chart 2). The charge distribution in 1′·3′ changes upon excitation from +0.07 (stilbene)/+1.93 (viologen) to +0.99/+1.01. Electron transfer transforms the donor and the acceptor into radical cations.
The BHHLYP/6-31G(d,p) optimized structure of the CT state of the complex is more planar than the ground-state one. The inter-chromophore distance slightly increases.
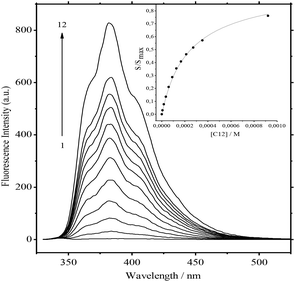
The formation of the complex is accompanied by fluorescence quenching, which is typical of the process of electron transfer (Fig. 3). Spectral shifts of any kind were absent. The calculated fluorescence spectrum of the model stilbene 1′ exhibits a strong S1 → S0 band at 341 nm, while the S1 → S0 transition in the model complex 1′·3′ is almost forbidden. The fluorescence quantum yield for 1·3 is quite low which can be explained by a small (∼0.8 eV) calculated S1–S0 energy gap and low oscillator strength resulting in efficient nonradiative deactivation.
Usually such complexes demonstrate high thermodynamic stability (log![[thin space (1/6-em)]](https://www.rsc.org/images/entities/char_2009.gif) K1 > 7). Therefore, to obtain an amended value for the constant we employed spectrofluorimetric competition titration. Log
K1 > 7). Therefore, to obtain an amended value for the constant we employed spectrofluorimetric competition titration. Log![[thin space (1/6-em)]](https://www.rsc.org/images/entities/char_2009.gif) K1 was calculated with eqn (2):
K1 was calculated with eqn (2):
log![[thin space (1/6-em)]](https://www.rsc.org/images/entities/char_2009.gif) K1 = log K1 = log![[thin space (1/6-em)]](https://www.rsc.org/images/entities/char_2009.gif) Kc − log Kc − log![[thin space (1/6-em)]](https://www.rsc.org/images/entities/char_2009.gif) Ks Ks | (2) |
![[thin space (1/6-em)]](https://www.rsc.org/images/entities/char_2009.gif) Kc = 8.59)15 and Ks is the substitution constant of complex 1·3 with acceptor C12 in reaction (4) (Fig. 3, inset).
Kc = 8.59)15 and Ks is the substitution constant of complex 1·3 with acceptor C12 in reaction (4) (Fig. 3, inset). | (3) |
 | (4) |
The value of log![[thin space (1/6-em)]](https://www.rsc.org/images/entities/char_2009.gif) Ks = −0.91 was obtained by the analysis of fluorescence spectra for 1·3/MeCN/C12 in reaction (4). The initial 4-fold excess of acceptor 3 was taken into consideration. The substitution constant was calculated with eqn (5):
Ks = −0.91 was obtained by the analysis of fluorescence spectra for 1·3/MeCN/C12 in reaction (4). The initial 4-fold excess of acceptor 3 was taken into consideration. The substitution constant was calculated with eqn (5):
 | (5) |
 represents the ratio of current to maximum concentrations of 1·C12, attained at the excess of C12; cA0 and cDA0 represent the initial concentrations of 3 and 1·3, respectively. Since 1·3 exhibits a very weak fluorescence (Φf < 0.001), we took the ratio under the fluorescence spectra of 1·3/MeCN/C12 as
  . The required log
![[thin space (1/6-em)]](https://www.rsc.org/images/entities/char_2009.gif) K1 = 9.5 (9.15, 1H NMR titration15) was calculated using eqn (2). Despite the high stability of 1·3, the stability constants of complexes 1
K1 = 9.5 (9.15, 1H NMR titration15) was calculated using eqn (2). Despite the high stability of 1·3, the stability constants of complexes 1![[thin space (1/6-em)]](https://www.rsc.org/images/entities/char_2009.gif) :
:![[thin space (1/6-em)]](https://www.rsc.org/images/entities/char_2009.gif) 1 and 1
1 and 1![[thin space (1/6-em)]](https://www.rsc.org/images/entities/char_2009.gif) :
:![[thin space (1/6-em)]](https://www.rsc.org/images/entities/char_2009.gif) 2 between stilbene 1 and 1-(3-ammoniopropyl)-4-methylpyridinium diperchlorate are moderate (log
2 between stilbene 1 and 1-(3-ammoniopropyl)-4-methylpyridinium diperchlorate are moderate (log![[thin space (1/6-em)]](https://www.rsc.org/images/entities/char_2009.gif) K1:1 = 4.6, log
K1:1 = 4.6, log![[thin space (1/6-em)]](https://www.rsc.org/images/entities/char_2009.gif) K1:2 = 2.9).14 Alkali and alkaline-earth metal cations possess a larger affinity to bis-crown cavities than ammonium; therefore they displace it during the substitution.
K1:2 = 2.9).14 Alkali and alkaline-earth metal cations possess a larger affinity to bis-crown cavities than ammonium; therefore they displace it during the substitution.
The addition of Ba, Ca, K, Li, Na, and Mg perchlorates to solutions of 1·3 in acetonitrile induces noticeable blue and hyperchromic shifts of the main absorption band. For Ba, Ca, and K perchlorates we observed indistinct isosbestic points, while for Li, Na, and Mg perchlorates clear-cut isosbestic points were detected. In both cases the weak CT band of 1·3 is completely quenched. The character of quenching is not linear, which implies that this is a stepwise process. In all the cases the presence of three types of complexes (1·3, 1·Mn+, and 1·(Mn+)2) was confirmed by means of the Wallace–Katz method.32 In all systems but 1·3/MeCN/KClO4, the absorption spectra have 3 linearly independent components. It allows us to propose the following reaction mechanism:
 | (6) |
 | (7) |
As the complexes 1·Mn+ and 3·1·Mn+ are intermediates, they exist in solutions only in trace amounts. Spectral-thermodynamic parameters of the product 1·(Mn+)2 are shown in Table 1.
Comparing the reported log![[thin space (1/6-em)]](https://www.rsc.org/images/entities/char_2009.gif) K1:2s values with related ones published earlier for reaction (8)
K1:2s values with related ones published earlier for reaction (8)![[thin space (1/6-em)]](https://www.rsc.org/images/entities/char_2009.gif) 11 (Table 2), it is apparent that substitution constants of 1·3 are lower than the corresponding stability constants of 1·(Mn+)2
11 (Table 2), it is apparent that substitution constants of 1·3 are lower than the corresponding stability constants of 1·(Mn+)2
 | (8) |
![[thin space (1/6-em)]](https://www.rsc.org/images/entities/char_2009.gif) K1:2s) for 1·3 and stability constants (log
K1:2s) for 1·3 and stability constants (log![[thin space (1/6-em)]](https://www.rsc.org/images/entities/char_2009.gif) K1:2a) for 1 in MeCN at 298 K, the diameter of metal cation
K1:2a) for 1 in MeCN at 298 K, the diameter of metal cation
| Salt |
λ
maxa 1![[thin space (1/6-em)]](https://www.rsc.org/images/entities/char_2009.gif) : :![[thin space (1/6-em)]](https://www.rsc.org/images/entities/char_2009.gif) 2, nm 2, nm |
ε
maxa × 10−4 1![[thin space (1/6-em)]](https://www.rsc.org/images/entities/char_2009.gif) : :![[thin space (1/6-em)]](https://www.rsc.org/images/entities/char_2009.gif) 2, M−1 cm−1 2, M−1 cm−1 |
log![[thin space (1/6-em)]](https://www.rsc.org/images/entities/char_2009.gif) K1:2s, M−2 K1:2s, M−2![[thin space (1/6-em)]](https://www.rsc.org/images/entities/char_2009.gif) a a |
log![[thin space (1/6-em)]](https://www.rsc.org/images/entities/char_2009.gif) K1:2a, M−2,11 K1:2a, M−2,11 |
Diameter of metal cation, Å |
|---|---|---|---|---|---|
a Due to negligible absorption of 3 in the 330–400 nm range, log![[thin space (1/6-em)]](https://www.rsc.org/images/entities/char_2009.gif) K1:2s was calculated for the following scheme: 1·3 + 2Mn+ ↔ 1·(Mn+)2.
1 in MeCN: λmaxa = 336 nm, εmaxa = 3.57 × 10⁴ M−1 cm−1, λmaxf = 386 nm, Φf = 0.4. 3 in MeCN: λmaxa = 259 nm, εmaxa = 2.69 × 10⁴ M−1 cm−1, λmaxf = 354 nm, Φf = 0.034. 1·3 in MeCN: λmaxa = 335 and 492 nm (CT band), εmaxa = 3.08 × 10⁴ M−1 cm−1 and 208 M−1 cm−1 (CT band), log K1:2s was calculated for the following scheme: 1·3 + 2Mn+ ↔ 1·(Mn+)2.
1 in MeCN: λmaxa = 336 nm, εmaxa = 3.57 × 10⁴ M−1 cm−1, λmaxf = 386 nm, Φf = 0.4. 3 in MeCN: λmaxa = 259 nm, εmaxa = 2.69 × 10⁴ M−1 cm−1, λmaxf = 354 nm, Φf = 0.034. 1·3 in MeCN: λmaxa = 335 and 492 nm (CT band), εmaxa = 3.08 × 10⁴ M−1 cm−1 and 208 M−1 cm−1 (CT band), log![[thin space (1/6-em)]](https://www.rsc.org/images/entities/char_2009.gif) K1 = 9.5, Φf < 0.001. K1 = 9.5, Φf < 0.001. |
|||||
| LiClO4 | 332 | 3.38 | 2.0 | 3.7 | 1.36 |
| NaClO4 | 333 | 3.77 | 5.6 | 7.8 | 1.94 |
| KClO4 | 332 | 3.41 | 6.6 | 7.1 | 2.66 |
| Mg(ClO4)2 | 329 | 3.53 | 3.5 | 3.7 | 1.32 |
| Ca(ClO4)2 | 329 | 3.51 | 4.3 | 15.6 | 1.98 |
| Ba(ClO4)2 | 329 | 3.39 | 4.4 | 16.7 | 2.68 |
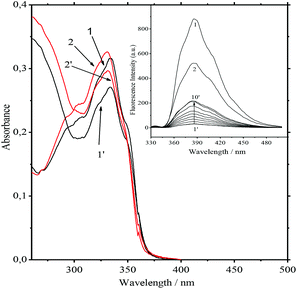
Obviously it can be interpreted as a requirement for ammonium to be rejected from the bis-crown cavities. The most significant decrease in the values of the constants is observed for Ca2+ and Ba2+. Nevertheless, they remain strong competitors. At low concentrations of salts the absorption spectra at the 334 nm band and also the fluorescence spectra of the 10−5 M 1·3/MeCN/2.5 × 10−4 M Ca(ClO4)2 and 10−5 M 1/MeCN/2.5 × 10−4 M Ca(ClO4)2 systems are identical. This indicates the detachment of two ammonioalkyl acceptor chains from the bis-crown during the substitution. As with the stability constants, the smallest substitution constants were obtained for compact Li+ and Mg2+ cations. In fact the absorption spectra of the 8.4 × 10⁻⁶ M 1·3/MeCN/0.5 M LiClO4 and 8.4 × 10⁻⁶ M 1/MeCN/0.5 M LiClO4 systems are different (Fig. 4).
Apparently, with Li+ being a weaker competitor, it gives a lower product yield of the product (1·(Li+)2). This was also supported by the fluorescence spectra. Upon increasing the LiClO4 concentration up to 0.5 M the fluorescence intensity maximum in the first system amounts to only 42% of that for the second system (Fig. 4, inset). For the K+ and Na+ cations with more prominent acceptor abilities, the yield of 1·(Mn+)2 is higher.
The fluorescence spectra of 1·3 in a low temperature glassy matrix of PrCN do not exhibit a noticeable increase in intensity and the appearance of a distinct oscillatory structure at 77 K, as opposed to 1. It points to a barrier-less electron transfer process, which does not require significant adjustments in the solvation shell.
Transient absorption spectroscopy
To describe the evolution of the transient spectra of 1 and 1·3, mono- and polyexponential models were used, respectively. The differential optical densities ΔD(λ, t) of 1 in acetonitrile, either free or fully complexed with 3, were measured after excitation with a 25 fs, 330 nm pump pulse (close to the isosbestic point) in the 500 ps time range. The evolution of the spectra for stilbene 1 in the range of 0 to 1 ps can be described as an emergence of a single broad band with its peak at 561 nm. In the range of 1 to 6 ps this band does not change noticeably. Then, in the range of 5–500 ps the band undergoes monoexponential decay with the characteristic time of 0.325 ns. The transient spectra of 1·3 on the femtosecond-picosecond time scale in the 425–775 nm range at excitation in the main absorption band are shown in Fig. 5.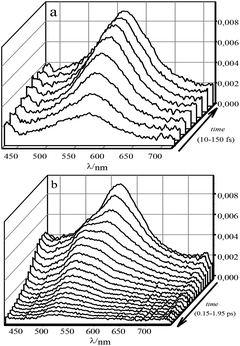 | ||
| Fig. 5 Differential absorption of 1·3 (∼1.4 × 10⁻⁴ M) in MeCN. The time increments: (a) 0.02 ps (0–0.15 ps); (b) 0.1 ps (0.15–1.95 ps). Arrows depict the direction of the time axis. | ||
The evolution of the spectra involves three stages. During the first 150 fs, a broad single band with its peak at 566 nm arises. Then, up to 0.6 ps the band is subjected to quenching with a monotonous blue shift of up to 43 nm. After that we observe gradual quenching without shifts in the 0.6–3 ps range.
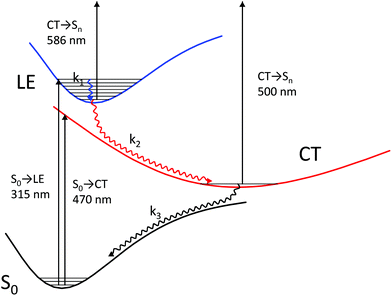
A theoretical calculation of S1 → Sn absorption spectra of a model complex and its components (stilbene 1′, viologen 3′, and their radical cations) led us to the following scheme of the processes that take place after the 1·3 complex is excited to its most intense absorption band (Fig. 6).
The complex is excited to the LE state localized on stilbene (the experimental absorption wavelength is 330 nm; the calculated value is 315 nm). The calculation of the model complex shows an intense S1 → Sn absorption band from the LE state localized on stilbene (the calculated value is 586 nm) in the wavelength range of interest (400–800 nm), which corresponds to the calculated S1 → Sn absorption bands at 559 and 585 nm in the model stilbene 1′ and to the experimentally observed band at 566 nm.
The increasing absorption in this range during 150 fs after excitation can be explained by the relaxation of the vibrationally excited LE* state to the minimum of the LE state through chromophore vibrations and solvent reorganization.
| LE* → LE (k1) |
This relaxation rate can be explained by a rather long decoherence time, ∼100 fs in the LE state due to the proximity of the minima of the ground and LE states.34 A further blue shift of the band corresponds to the charge transfer and absorption of the CT state of the model complex (calculated value 500 nm), which corresponds to the D0 → Dn absorption of the radical cation of the model stilbene 1′ (the calculated value is 506 nm and the experimental value is 523 nm). According to our calculation, a radical cation of the model viologen 3′ also absorbs in this region (560–580 nm, D0 → Dn) with low intensity, which explains an incomplete decay of the band at 550–570 nm simultaneously with the onset of the blue-shifted band.
The potential energy surface of the CT state is located in the vicinity of the LE minimum. The energy gap between these surfaces is small enough to make the nonradiative transition from the LE to the CT state faster than emission from the LE state. The experiment shows that no stilbene luminescence is observed in the complex; therefore, the complex, indeed, directly goes from the LE to the CT surface. According to Tully's surface hopping concept35 this transition does not have to take place immediately near the LE minimum. The hopping probability in a given point of the potential energy surface depends on the nonadiabatic coupling and nuclear velocity in this point. In a system with a sloped conical intersection36–38 between the LE and CT surfaces, this probability does not have to exhibit a clear-cut maximum. Therefore, one cannot separate a vertical downward transition from the LE minimum to the CT* from the following CT* → CT relaxation. We believe that hopping from the LE to CT surface occurs simultaneously with the relaxation of the CT state, and these processes can be described with a single effective constant. Hence, this process includes charge transfer followed by viologen planarization and solvent reorganization.
| LE → CT* → CT (k2) |
Next, the CT state nonradiatively relaxes through back electron transfer. As a result, the absorption from the stilbene and viologen radical cations completely decays. This process is the slowest one. As in the case of LE to CT hopping, hopping from CT to the ground state surface takes place simultaneously with relaxation to the ground state minimum through viologen twisting and solvent reorganization.
| CT → GS* → GS (k3) |
This corresponds to complete decay of transient absorption.
Therefore, the evolution of the photoinduced absorption spectra of the complex can be described by the following differential equations:
 | (9) |
 | (10) |
 | (11) |
Solving these equations leads us to the following expressions for differential absorption of each state:
 | (12) |
 | (13) |
 | (14) |
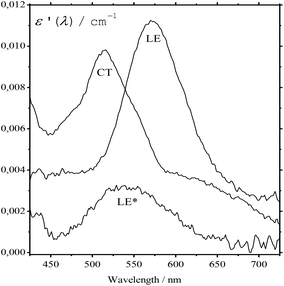
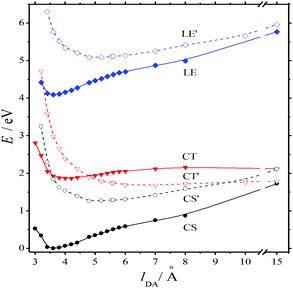
The absorption spectra of the three intermediates, namely LE*, LE, and CT (Fig. 7), were determined by a global fitting procedure applied to the whole dataset of 425–750 nm and 0–2.2 ps. Their effective lifetimes were found to be 60, 320, and 510 fs. Fig. 8 shows the decay kinetic plots of complex 1·3 at the front, peak, and tail of the spectrum as well as the corresponding concentration curves of LE*, LE, and CT states (Fig. 8, inset). Fig. 9 shows the potential energy scans of the complex 1′·3′ with respect to the inter-chromophore distance for two complex geometries: the closed-shell state (CS, obtained by unrelaxed scan of the ground-state structure) and the charge-transfer state (CT, obtained by unrelaxed scan of the charge-transfer structure and representing a biradicaloid state). The chromophores in the CS geometry (full lines) are twisted, while in the biradicaloid geometry (broken lines), they are planar. At a larger distance between the chromophores, a more planar structure of the CT state is preferred. At a relatively large distance, which is not accessible in a complex bonded by short alkyl linkers, state flipping can occur and the CT′ state can become lower than the CS′ state. As for the non-planar structure, the closed-shell ground state is the lowest one at any inter-chromophore distances. At large distances the planar CT′ and non-planar CS states are quasi-degenerate. This quasi-degeneration favors the efficient nonradiative conversion from the CT to the closed-shell ground state.
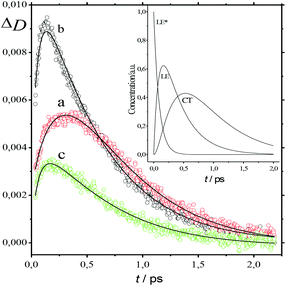 | ||
| Fig. 8 Time plot of the transient absorption spectra of 1·3 in MeCN at 500 nm (a), 566 nm (b), and 650 nm (c) in the 0–2.3 ps range. Smooth curves represent global fitting. Inset: Time plot of LE*, LE, and CT states of 1·3 derived from Fig. 6. | ||
So, we can suggest the following relaxation mechanism: a twisted LE state, whose geometry only slightly differs from the geometry of the CS ground state, is quasi-degenerate with the planar biradicaloid CT state at a distance of 3–4 Å, which is quite affordable with short alkyl linkers. This quasi-degeneration causes fast LE → CT relaxation. Quasi-degeneration of the planar CT state with either the planar CS′ state or the twisted CS state is achieved at the distances of 9 Å or longer, which are not affordable with short alkyl linkers. This explains relatively slow CT → GS relaxation.
In the series of bis(crown)stilbene complexes with two different acceptors (bipyrydil and bipyridilethylene derivatives), the alkyl chain lengths of the acceptors and the inter-chromophore D–A distances correlate to some extent with the charge transfer parameters S0 → CT and CT → S0 (Table 3). As the alkyl chain increases from two to three methylene links, the molar extinction coefficient and the frequency of the S0 → CT transition slightly increase together with the electron back-transfer time, which can be associated with the increased donor–acceptor distance.
Conclusion
An efficient substitution reaction takes place upon the interaction of donor–acceptor complex 1·3 with alkali and alkaline-earth metal perchlorates in acetonitrile. The reaction results in the substitution of two ammonioalkyl linkers by metal cations with the formation of the fluorescing product 1·(Mn+)2. The thermodynamic and kinetic parameters of 1·3 and 1·(Mn+)2 were determined. Complex 1·3 may be viewed as an optical sensor for metal cations. The subpicosecond characteristic times of direct and back electron transfer in the supramolecular complex 1·3 were determined by means of femtosecond transient absorption spectroscopy. The nature of the excited states of 1·3 is elucidated and a reliable mechanism of photoinduced charge transfer and further relaxation is suggested with the use of quantum chemical calculations.Conflicts of interest
There are no conflicts to declare.Acknowledgements
The financial support from the Russian Science Foundation (project 14-13-00076, with respect to organic synthesis) and the Russian Foundation for Basic Research (project 17-03-00595) is gratefully acknowledged. This work was supported (with respect to the femtosecond pumping and probe installation) by the State Task for ICP RAS No. 0082-2018-0005, State registration number AAAA-A18-118020690203-8. Quantum chemical calculations were partially supported by the Competitiveness Program of the National Research Nuclear University “MEPhI”, the Ministry of Science and Higher Education of the Russian Federation (Agreement No 007-State Task/Ch3363/26), and by the program of presidium of the Russian Academy of Sciences No. 35 “Scientific bases of creation of new functional materials”. The research was carried out using the equipment of the shared research facilities of HPC computing resources at Lomonosov Moscow State University, Joint Supercomputer Center of the Russian Academy of Sciences, and the University Cluster of MEPhI.References
- N. Mataga, H. Shioyama and Y. Kanda, Dynamics of charge recombination processes in the singlet electron-transfer state of pyrene-pyromellitic dianhydride systems in various solvents. Picosecond laser photolysis studies, J. Phys. Chem., 1987, 91, 314–317 CrossRef CAS.
- T. Asahi and N. Mataga, Charge recombination process of ion pair state produced excitation of charge-transfer complex in acetonitrile solution. Essentially different character of its energy gap dependence from that of geminate ion pair formed by encounter between fluorescer and quencher, J. Phys. Chem., 1989, 93, 6575–6578 CrossRef CAS.
- T. Asahi, N. Mataga, Y. Takahashi and T. Miyashi, Energy gap dependence of the charge recombination process of ion pairs produced by excitation of 2,6,9,10-tetracyanoanthracene-methyl substituted benzene charge transfer complexes in acetonitrile, Chem. Phys. Lett., 1990, 171, 309–313 CrossRef CAS.
- T. Okada, M. Migita, N. Mataga, Y. Sakata and S. Misumi, Picosecond laser spectroscopy of intramolecular heteroexcimer systems. Time-resolved absorption studies of p-(CH3NC6H4(CH2), (1-pyrenyl) and -(9-anthryl) systems, J. Am. Chem. Soc., 1981, 103, 4715–4720 CrossRef CAS.
- A. M. Swinnen, M. Van der Auweraer, F. C. de Schryver, K. Makatani, T. Okada and T. M. Mataga, Photophysics of the intramolecular exciplex formation in ω,-(1-pyrenyl)-alpha-N,N-dimethylaminoalkanes, J. Am. Chem. Soc., 1987, 109, 321–330 CrossRef CAS.
- Y.-T. Kao, X. Guo, Y. Yang, Z. Liu, A. Hassanali, Q.-H. Song, L. Wang and D. Zhong, Ultrafast dynamics of nonequilibrium electron transfer in photoinduced redox cycle: solvent mediation and conformation flexibility, J. Phys. Chem. B, 2012, 116, 9130–9140 CrossRef CAS PubMed.
- G. Duvanel, N. Banerji and E. Vauthey, Excited-state dynamics of donor-acceptor bridged systems containing a boron-dipyrromethene chromophore: interplay between charge separation and reorientational motion, J. Phys. Chem. A, 2007, 111, 5361–5369 CrossRef CAS PubMed.
- T. Kumpulainen, B. Lang, A. Rosspeintner and E. Vauthey, Ultrafast elementary photochemical processes of organic molecules in liquid solution, Chem. Rev., 2017, 117, 10826–10939 CrossRef CAS PubMed.
- E. N. Ushakov, V. A. Nadtochenko, S. P. Gromov, A. I. Vedernikov, N. A. Lobova, M. V. Alfimov, F. E. Gostev, A. N. Petrukhin and O. M. Sarkisov, Ultrafast excited state dynamics of the bi- and termolecular stilbene-viologen charge-transfer complexes assembled via host-guest interactions, Chem. Phys., 2004, 298, 251–261 CrossRef CAS.
- M. V. Rusalov, V. V. Volchkov, V. L. Ivanov, M. Ya. Melnikov, I. V. Shelaev, F. E. Gostev, V. A. Nadtochenko, A. I. Vedernikov, S. P. Gromov and M. V. Alfimov, Femtosecond excited state dynamics of a stilbene-viologene charge transfer complex assembled via host-guest interactions, Photochem. Photobiol. Sci., 2017, 16, 1800–1811 RSC.
- V. V. Volchkov, M. V. Rusalov, F. E. Gostev, I. V. Shelaev, V. A. Nadtochenko, A. I. Vedernikov, A. A. Efremova, L. G. Kuz'mina, A. P. Gromov, M. V. Alfimov and M. Ya. Melnikov, Complexation of bis-crown stilbene with alkali and alkaline-earth metal cations. Ultrafast excited state dynamics of the stilbene-viologen analogue charge transfer complex, J. Phys. Org. Chem., 2018, 31(2), e3759 CrossRef.
- E. N. Ushakov, S. P. Gromov, A. I. Vedernikov, E. V. Malysheva, A. A. Botsmanova, M. V. Alfimov, B. Eliasson, U. G. Edlung, J. K. Whitesell and M. A. Fox, Self-organization of highly stable electron donor-acceptor complexes via host-guest interactions, J. Phys. Chem. A, 2002, 106, 2020–2023 CrossRef CAS.
- W.-S. Xia, R. H. Schmehl, C.-J. Li, J. T. Mague, C.-P. Luo and D. M. Guldi, Chemosensors for lead(II) and alkali metal ions based on self-assembling fluorescence enhancement (SAFE), J. Phys. Chem. B, 2002, 106, 833–843 CrossRef CAS.
- S. P. Gromov, A. I. Vedernikov, E. N. Ushakov, N. A. Lobova, A. A. Botsmanova, L. G. Kuz'mina, A. V. Churakov, Yu. A. Strelenko, M. V. Alfimov, J. A. K. Howard, D. Johnels and U. G. Edlung, Novel supramolecular charge-transfer systems based on bis-(18-crown-6)stilbene and viologen analogues bearing two ammonioalkyl groups, New J. Chem., 2005, 29, 881–894 RSC.
- A. I. Vedernikov, E. N. Ushakov, A. A. Efremova, L. G. Kuz'mina, A. A. Moiseeva, N. A. Lobova, A. V. Churakov, Yu. A. Strelenko, M. V. Alfimov, J. A. K. Howard and S. P. Gromov, Synthesis, structure, and properties of supramolecular charge-transfer complex between bis-(18-crown-6)stilbene and ammonioalkyl derivatives of 4,4′-bipyridine and 2,7-diazapyrene, J. Org. Chem., 2011, 76, 6768–6779 CrossRef CAS PubMed.
- S. P. Gromov, E. N. Ushakov, A. I. Vedernikov, N. A. Lobova, M. V. Alfimov, Yu. A. Strelenko, M. V. Alfimov, J. K. Whitesell and M. A. Fox, A novel optical sensors for metal ions based on ground-state intermolecular charge-transfer complexation, Org. Lett., 1999, 1, 1697–1699 CrossRef CAS.
- W. H. Melhuish, Quantum efficiencies of fluorescence of organic substances: Effect of solvent and concentration of the fluorescent solute, J. Phys. Chem., 1961, 65, 229–235 CrossRef CAS.
- V. V. Volchkov, F. E. Gostev, I. V. Shelaev, V. A. Nadtochenko, S. N. Dmitrieva, S. P. Gromov, M. V. Alfimov and M. Ya. Melnikov, Complexation of donor-acceptor substituted aza-crowns with alkali and alkaline earth metal cations. Charge transfer and recoordination in excited state, J. Fluoresc., 2016, 26, 585–592 CrossRef CAS PubMed.
- D. M. Himmelblau, Applied nonlinear programming, Mc-Grow-Hill, Austin, USA, 1972 Search PubMed.
- M. W. Schmidt, K. K. Baldridge, J. A. Boatz, S. T. Elbert, M. S. Gordon, J. H. Jensen, S. Koseki, N. Matsunaga, K. A. Nguyen, S. Su, T. L. Windus, M. Dupuis and J. A. Montgomery, General atomic and molecular electronic structure system, J. Comput. Chem., 1993, 14, 1347–1363 CrossRef CAS.
- M. S. Gordon and M. W. Schmidt, Advances in electronic structure theory: GAMESS a decade later, in Theory and applications of computational chemistry: the first forty years, Elsevier, Amsterdam, 2005, pp. 1167–1189 Search PubMed.
- S. Grimme, S. Ehrlich and L. Goerigk, Effect of the damping function in dispersion corrected density functional theory, J. Comput. Chem., 2011, 32, 1456–1465 CrossRef CAS PubMed.
- A. V. Marenich, C. J. Cramer and D. G. Truhlar, Universal solvation model based on solute electron density and on a continuum model of the solvent defined by the bulk dielectric constant and atomic surface tensions, J. Phys. Chem. B, 2009, 113, 6378–6396 CrossRef CAS PubMed.
- A. A. Granovsky, Firefly 8.2, build 10203, 2017, see http://classic.chem.msu.su/gran/Firefly/index.html Search PubMed.
- M. W. Schmidt and M. S. Gordon, The construction and interpretation of MCSCF wavefunctions, Annu. Rev. Phys. Chem., 1998, 49, 233–266 CrossRef CAS PubMed.
- B. O. Roos, in Methods in computational molecular physics, ed. G. H. F. Diercksen and S. Wilson, D. Reidel Publishing, Dordrecht, Netherlands, 1983, pp. 161–187 Search PubMed.
- B. O. Roos, in Lecture notes in quantum chemistry, ed. B. O. Roos, Springer-Verlag, Berlin, 1994, vol. 58, pp. 177–254 Search PubMed.
- R. Shepard, The multiconfiguration self-consistent field method. Ab initio methods in quantum chemistry – II, in Adv. Chem. Phys, 1987, vol. 69, pp. 63–200 Search PubMed.
- B. O. Roos, Adv. Chem. Phys., 1987, 69, 339–445 Search PubMed.
- A. A. Granovsky, Extended multi-configuration quasi-degenerate perturbation theory: the new approach to multi-state multi-reference perturbation theory, J. Chem. Phys., 2011, 134, 214113–214126 CrossRef PubMed.
- S. Miertus, E. Scrocco and J. Tomasi, Electrostatic interaction of a solute with a continuum. A direct utilizaion of AB initio molecular potentials for the prevision of solvent effects, Chem. Phys., 1981, 55, 117–129 CrossRef CAS.
- R. M. Wallace and S. M. Katz, A method for the determination of rank in the analysis of absorption spectra of multi-component system, J. Phys. Chem., 1964, 68, 3890–3892 CrossRef CAS.
- M. V. Rusalov, V. V. Volchkov, V. L. Ivanov, M. Ya. Melnikov, F. E. Gostev, V. A. Nadtochenko, A. I. Vedernikov, S. P. Gromov and M. V. Alfimov, Ultrafast excited state dynamics of a stilbene–viologen charge transfer complex and its interaction with alkanediammonium salts, J. Photochem. Photobiol., A, 2018 Search PubMed , in press.
- Yu. E. Perlin, Modern methods in the theory of many-phonon processes, Sov. Phys. Usp., 1964, 6, 542–565 CrossRef.
- J. C. Tully, Molecular dynamics with electronic transitions, J. Chem. Phys., 1990, 93, 1061–1071 CrossRef CAS.
- T. J. Martinez, Physical chemistry: Seaming is believing, Nature, 2010, 467, 412–413 CrossRef CAS PubMed.
- D. R. Yarkony, Diabolical conical intersections, Rev. Mod. Phys., 1996, 68, 985–1013 CrossRef CAS.
- M. A. Robb, F. Bernardi and M. Olivucci, Conical intersections as a mechanistic feature of organic photochemistry, Pure Appl. Chem., 1995, 67, 783–789 CAS.
| This journal is © The Royal Society of Chemistry and Owner Societies 2019 |

