DOI:
10.1039/C8QM00467F
(Research Article)
Mater. Chem. Front., 2019,
3, 224-232
Anchoring nickel nanoparticles on three-dimensionally macro-/mesoporous titanium dioxide with a carbon layer from polydopamine using polymethylmethacrylate microspheres as sacrificial templates†
Received
15th September 2018
, Accepted 4th December 2018
First published on 4th December 2018
Abstract
The performance in adsorption and catalysis efficiency are closely dependent on the morphology and structure of the catalysts and adsorbents. Herein, three dimensional (3D) macro-/mesoporous TiO2@C–Ni composites were successfully fabricated using polymethylmethacrylate (PMMA) as a sacrificial template. Notably, the inorganic interlayer of TiO2 or SiO2 played an essential role in generating such 3D macro-/mesoporous TiO2(SiO2)@C–Ni composites. In the absence of TiO2 or SiO2, aggregated C–Ni composites were obtained instead. Owing to the well-defined 3D macro-/mesoporous structures as well as high coverage of Ni nanoparticles (NPs), the TiO2@C–Ni composites obtained at 500 °C in a N2 atmosphere exhibited excellent performance in catalysis and protein adsorption. Moreover, the morphology of the 3D TiO2@C–Ni composites was greatly influenced by changing other different carbonization temperatures (700, 900 °C). Interestingly, when PMMA@TiO2@PDA–Ni2+ was annealed at 900 °C, all of the generated carbon nanotubes as well as the TiO2 interlayer were weaved together into a continuous 3D network, which will endow this kind of material with enhanced properties and excellent performance in energy storage fields.
1. Introduction
Nowadays, noble-metal-based catalysts, such as Au, Ag, Pd, and Pt display high catalytic activity in the hydrogenation of nitroarenes owing to their large surface area and excellent adsorption for substrates.1–4 Despite these achievements, however, the noble metals are extremely scarce and expensive, which in turn increases the production cost and is not conducive to large scale application. As an alternative, transition-metal-based catalysts such as Co, Ni, etc.5–8 have emerged for the hydrogenation of nitroarenes owing to their distinct properties, high abundance and low price. Moreover, metallic Ni materials show specific metal affinity on his-rich proteins.6,9 Unfortunately, the ultrafine Ni nanoparticles (NPs) are inclined to irreversibly aggregate together in solution, resulting in poor performances in catalysis and adsorption processes, which greatly limits their further application in industry.
The performances of heterogeneous catalysts and adsorbents are closely associated with their morphology and structure. Therefore, it is highly desired to explore the morphology and structure of catalysts and adsorbents for high performance. Among various catalysts and adsorbents, three dimensional (3D) materials have emerged as promising candidates due to their distinct properties such as high porosity, ordered structures and hollow morphology etc.10,11 Compared with other structures, 3D structures can not only improve the stability of active metals and increase the density of the accessible active sites, but also greatly enhance the adsorption ability for substrates and facilitate mass diffusion within frameworks, which are of crucial importance for practical applications in adsorption and catalysis. Moreover, 3D framework composites, owing to their fascinating properties, can be decorated and widely used in other fields such as gas storage,12 sensing,13 photocatalysis, and photoelectrochemistry,14etc. Reports so far mainly focused on the fabrication of 3D/carbon, silica, and metal oxides,15 but very few involved the synthesis of 3D/metals, even though nanometallic materials are the most promising candidates for photoelectric and catalytic applications. Meanwhile, TiO2-based 3D frameworks are of particular interest owing to their desirable physical properties, non-toxicity, and low price. For example, Liang et al. synthesized 3D Pt/TiO2 catalysts for a water–gas shift reaction by template and impregnation methods.16 Wei et al. fabricated 3D TiO2-supported Au@CdS for efficient photocatalysis of CO2 conversion.17 Jiao et al. reported 3D TiO2-supported Au NPs with enhanced visible-light-responsive properties for application in carbon dioxide photoreduction using a colloidal crystal template method.18 However, the above synthetic strategies include two steps of carbonization process, namely obtaining the 3D TiO2 framework by carbonization followed by another calcination step to harvest the final products. This is complex and time-consuming. Also, the decorated metal NPs are mainly focused on noble metal NPs. Thus, it is essential but challenging to develop a facile and efficient method to prepare multifunctional 3D TiO2 composites with non-noble metal NPs.
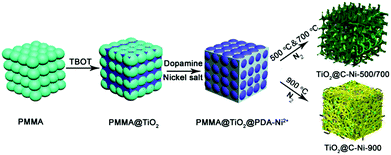
In this paper, we report a feasible and efficient one-step calcination strategy for the synthesis of 3D structural TiO2@C–Ni composites using a colloidal crystal template (CCT) method, sol–gel strategy, and mussel chemistry, together with a final high temperature carbonization process. During the conversion of the PMMA@TiO2@PDA–Ni2+ to the anti-opal structure TiO2@C–Ni composites in an inert atmosphere, the PMMA templates are totally removed and simultaneously, the crystalline form of TiO2 is obtained, since the amorphous TBOT changed to crystalline TiO2.
In addition, the Ni2+ chelated with PDA was reduced to metallic Ni embedded in an N-doped carbon layer from PDA which endowed the 3D framework with magnetism and greatly facilitated the recovery of the composites. The catalytic activity of 3D TiO2@C–Ni was assessed by the catalytic reduction of 4-NP, and the property of protein adsorption was investigated by the adsorption of bovine hemoglobin (BHb). Notably, the removal of highly abundant his-rich proteins in blood will be beneficial for the detection of low abundance proteins which are often the signals of certain diseases. Moreover, the 3D TiO2@C–Ni composites can be easily recycled within 5 minutes by using an external magnetic field.
2. Experiment
2.1. Sample preparation
Methyl methacrylate, potassium peroxodisulfate and azodiisobutyronitrile were purchased from Aldrich. Ethylene glycol, acetone, anhydrous ethanol, dopamine and tetrabutyl titanate (TBOT) were obtained from the Alfa Aesar Chemical Company. 4-Nitrophenol (4-NP), phosfate buffer saline (PBS), nickel chloride hexahydrate (NiCl2·6H2O), ammonia solution (28–30%) and ethanol were bought from the Shanghai Chemical Reagent Company. All the reagents were analytical grade and directly used without any further purification.
2.2. Self-assembly of the 3D PMMA colloidal crystal template
3D opal-structured PMMA templates were synthesized by the centrifugal force self-assembly method.19,20 Briefly, 150 mL of acetone and 300 mL of water were added to a four-necked flask and mechanically stirred for 30 min at 70 °C under a nitrogen atmosphere. 25 min later, 80 mL methyl methacrylate was introduced into the flask, and K2S2O8 (0.3 g) was added to initiate the reaction. After 40 minutes, azodiisobutyronitrile (0.18 g) as well as 150 mL of water were introduced to reinitialize the reaction which was stopped after 140 min by diluting it with 1300 mL of deionized water. Finally, the diluent solution was centrifuged and self-assembled into the 3D PMMA template at 2500 rpm for 10 h followed by a drying step at 50 °C for 6 h.
2.3. Synthesis of PMMA@TiO2
The opal 3D structured PMMA@TiO2 was fabricated by means of a direct colloid perfusion method. Typically, 2 mL TBOT was well dispersed in 20 mL ethylene glycol, followed by the introduction of the as-obtained PMMA templates (200 mg). During the process, the as-prepared 3D templates were filled with an excess of TBOT at room temperature by means of capillarity. When exposed to air, the TBOT sol–gel reacted with atmospheric humidity to form titanium oxide. Ultimately, the as-prepared PMMA@TiO2 was isolated and dried at 50 °C for 12 h.
2.4. Preparation of PMMA@TiO2@PDA–Ni2+
PMMA@TiO2@PDA–Ni2+ was prepared using the extend Stöber method.21,22 Firstly, 15 mg of dopamine and 37.6 mg of NiCl2·6H2O were dissolved in a mixed solvent of ethanol (25 mL) and water (15 mL). Subsequently, 200 mg of PMMA@TiO2 was carefully deposited in the mixture, followed by the introduction of NH3·H2O (1 mL). Finally, the reactor was slightly vibrated in a shaking table for about 12 h. The resulting PMMA@TiO2@PDA–Ni2+ was then exposed to air and dried at 50 °C for 12 h.
2.5. The synthesis of 3D TiO2@C–Ni hybrids
The synthesis of 3D TiO2@C–Ni hybrids was achieved by annealing. The as-synthesized 3D PMMA@TiO2@PDA–Ni2+ was successively calcined at 500 °C, 700 °C, and 900 °C in an inert atmosphere to remove the PMMA templates. The resultant products were denoted as TiO2@C–Ni-500, TiO2@C–Ni-700, TiO2@C–Ni-900, respectively. Notably, all the characterizations were mainly conducted with TiO2@C–Ni-500, and this TiO2@C–Ni-500 was applied in the reduction of 4-NP by NaBH4 and separation of histidine-rich proteins.
2.6. Catalytic reaction
The reduction of 4-NP by NaBH4 was chosen as the model reaction to investigate the catalytic performance of TiO2@C–Ni-500. Typically, 5 mL of 4-NP (0.1 mmol mL−1) and NaBH4 (5 mg) were mixed, followed by the introduction of 1 mg TiO2@C–Ni-500 to initiate the reaction. Subsequently, the concentration of 4-NP was monitored by UV-vis absorption at certain intervals at room temperature. The used catalyst was washed, dried, and then reused to test the catalyst reusability.
2.7. Adsorption and separation of BHb proteins
All protein solutions were prepared in a pH 8.0 phosphate buffered solution (PBS). In the adsorption experiments, 1 mg of TiO2@C–Ni-500 was vortex-mixed with 4 mL of different concentrations of BHb solution ranging from 0.025 to 0.4 mg mL−1 in centrifuge tubes, and vibrated for 3 h. The adsorbent–protein conjugates were then separated by an external magnet. Subsequently, the supernatant was collected and respectively detected by a UV-vis spectrometer. In selective-adsorption testing, 6 mg of TiO2@C–Ni-500 was respectively mixed with 4 mL of BHb solution, BSA solution, BHb/BSA-mixed solution, and a 100-fold dilution of human-blood, whose concentrations were all 0.4 mg mL−1. Similarly, the adsorbent–protein conjugates were removed with a magnet, and the supernatant and eluent were collected and tested by UV-vis spectroscopy and sodium dodecyl sulfate-polyacrylamide gel electrophoresis (SDS-PAGE).
2.8. Characterization
Thermogravimetric analysis (TGA) was carried out by an STA449 F3 Jupiter thermogravimetric analyzer ranging from RT to 800 °C with a ramping rate of 10 °C min−1 in an N2 atmosphere. The data of adsorption and catalysis were gauged by using the UV-vis spectrophotometer (Shimadzu, Japan). The XRD patterns were detected by the D/Max-2500 diffractometer (Shimadzu, Japan) with nickel-filtered Cu Kα-radiation using a monochromatized X-ray beam. Scanning electron microscopy (SEM, JEOL-4800) and transmission electron microscopy (TEM, JEOL-1011) were employed to characterize the morphology and microstructures of the specimens. The magnetic properties were checked with the vibrating sample magnetometry (VSM, MicroSense EV7) at RT. The XPS of the resultant product was examined with the Physical Electronics PHI 5600 XPS spectrophotometer equipped with monochromatic Al Kα (1486.6 eV) as the excitation source.
3. Results and discussion
3.1. Characterization of samples
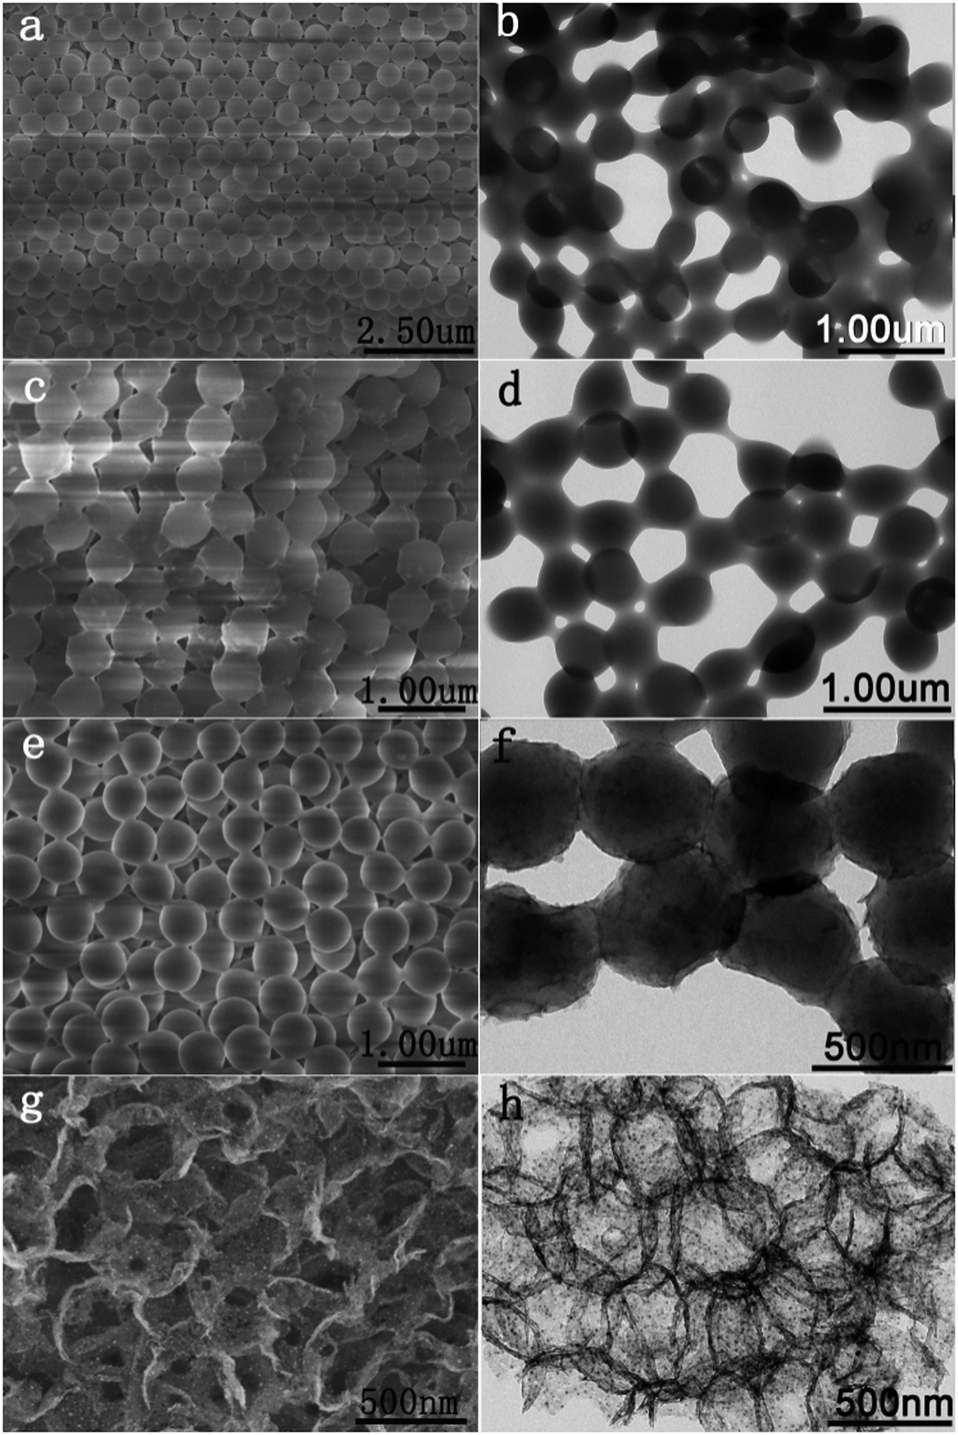
Fig. 1 illustrates the synthetic procedure of 3D TiO2@C–Ni composites with different stages of transition. Firstly, the 3D opal-structural PMMA templates were assembled into regular 3D colloidal crystals by centrifugal force. SEM and TEM images in Fig. 2(a and b) indicated that the closely packed 3D PMMA templates were packed with homogeneous microspheres with a diameter of about ∼540 nm (as depicted in Fig. S1(B), ESI†). The opal 3D structural PMMA@TiO2 was prepared by the penetration of TBOT into the PMMA voids by a capillarity-driven process. According to the observation of SEM and TEM images in Fig. 2(c and d), the as-synthesized three-dimensional opal-structured PMMA@TiO2 is still robust and the morphology has an average diameter of about ∼570 nm, which fully demonstrates the successful infiltration of TiO2. Subsequently, the PMMA@TiO2@PDA–Ni2+ is prepared by means of the extend Stöber method. The SEM and TEM images in Fig. 2(e and f) displayed that the 3D construction was a little distorted and the cells had a diameter of ∼630 nm. The nickel ions involved in the PDA gradually reduced to metallic Ni NPs during carbonization, and simultaneously, the PMMA templates were removed. Thus, 3D macro-/mesoporous TiO2@C–Ni composites were obtained which showed opposite morphology with PMMA@TiO2@PDA–Ni2+. The comparison of SEM and TEM images in Fig. 2(g and h) obviously proves the formation of anti-opal TiO2@C–Ni with well-dispersed Ni NPs embedded in the PDA-derived graphitic carbon layer. Spherical macro-/mesopores are arranged in the same location as the PMMA spheres, which are beneficial for substrate transport and facilitated catalysis and adsorption. Despite shrinkage and a few local collapses, however, the well-structured 3D framework was retained after calcination. Moreover, many black dots can be observed from the TEM image (Fig. 2(h)), which indicates that well-dispersed Ni NPs are anchored on the 3D structure and the coverage ratio was extremely high.
 |
| | Fig. 1 Schematic of different stages during the course of synthesis of TiO2@C–Ni composites. | |
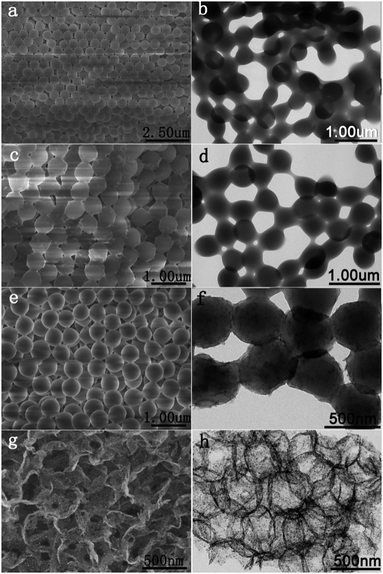 |
| | Fig. 2 SEM and TEM images of PMMA (a and b), PMMA@TiO2 (c and d), PMMA@TiO2@PDA–Ni2+ (e and f) and TiO2@C–Ni-500 (g and h). | |
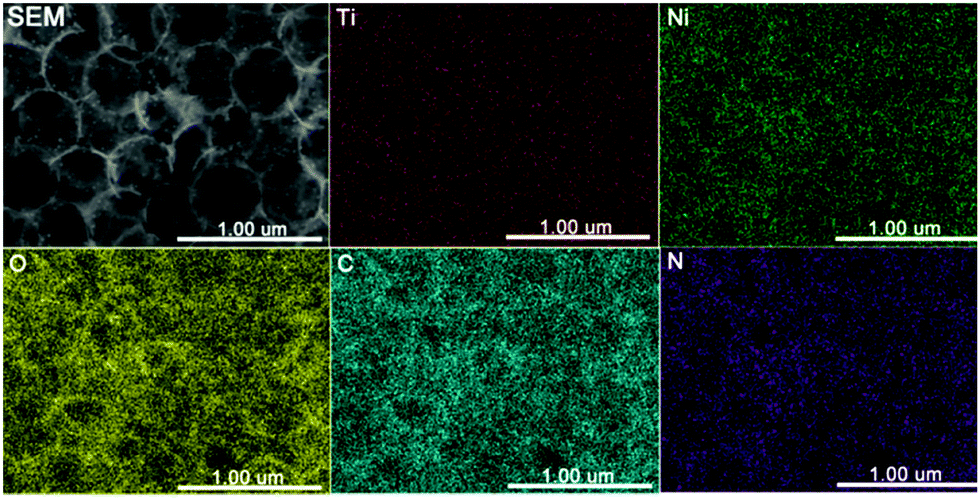
To further demonstrate the composition of the anti-opal TiO2@C–Ni composites, the energy-dispersive spectroscopy (EDS) mapping of an anti-opal TiO2@C–Ni composite was employed. As shown in Fig. 3, the elemental signals of Ni, Ti, O, C, and N can be found in the hybrid composites, indicating the formation of anti-opal TiO2@C–Ni composites. Without the coating of PDA–Ni2+, 3D inverse-opal structured TiO2 was realized through annealing PMMA@TiO2 at 500 °C in an N2 atmosphere (Fig. S2, ESI†). To further prove the role of the TiO2 interlayer, we tried to prepare hollow C–Ni composites without participation of TiO2. Firstly, the PMMA@PDA–Ni2+ was obtained, but its appearance, as shown in Fig. S3(a and d) (ESI†), was totally different from that of PMMA@TiO2@PDA–Ni2+, indicating that the self-assembled PMMA colloids easily collapsed without the protection of a TiO2 interlayer. After it was carbonized in a nitrogen atmosphere, C–Ni composites were easily obtained. The SEM image (Fig. S3(b and e), ESI†) showed that the resultant product has abundant aggregation fragments. The TEM image (Fig. S3(c and f), ESI†) also confirms the morphology. Meanwhile, some tiny Ni NPs with dark dots can be clearly observed. It clearly shows that the Ni NPs tends to aggregate together, which would limit their further application. These results fully indicate that 3D macro-/mesoporous structures cannot be preserved without TiO2 as the skeleton. Moreover, to further validate the role of the inorganic interlayer, the SiO2 inorganic interlayer was also employed as the framework to prepare 3D SiO2@C–Ni with the same method.23 SEM and TEM images of SiO2@C–Ni in Fig. S4 (ESI†) exhibit a 3D inverse-opal morphology that was easily fragile. Thus, it can be concluded that the inorganic interlayer of TiO2 plays an essential role in the construction of a 3D macro-/mesoporous TiO2@C–Ni composite.
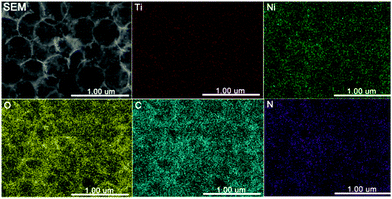 |
| | Fig. 3 SEM image of 3D TiO2@C–Ni-500 and the corresponding elemental mappings of Ti, Ni, O, C, and N. | |
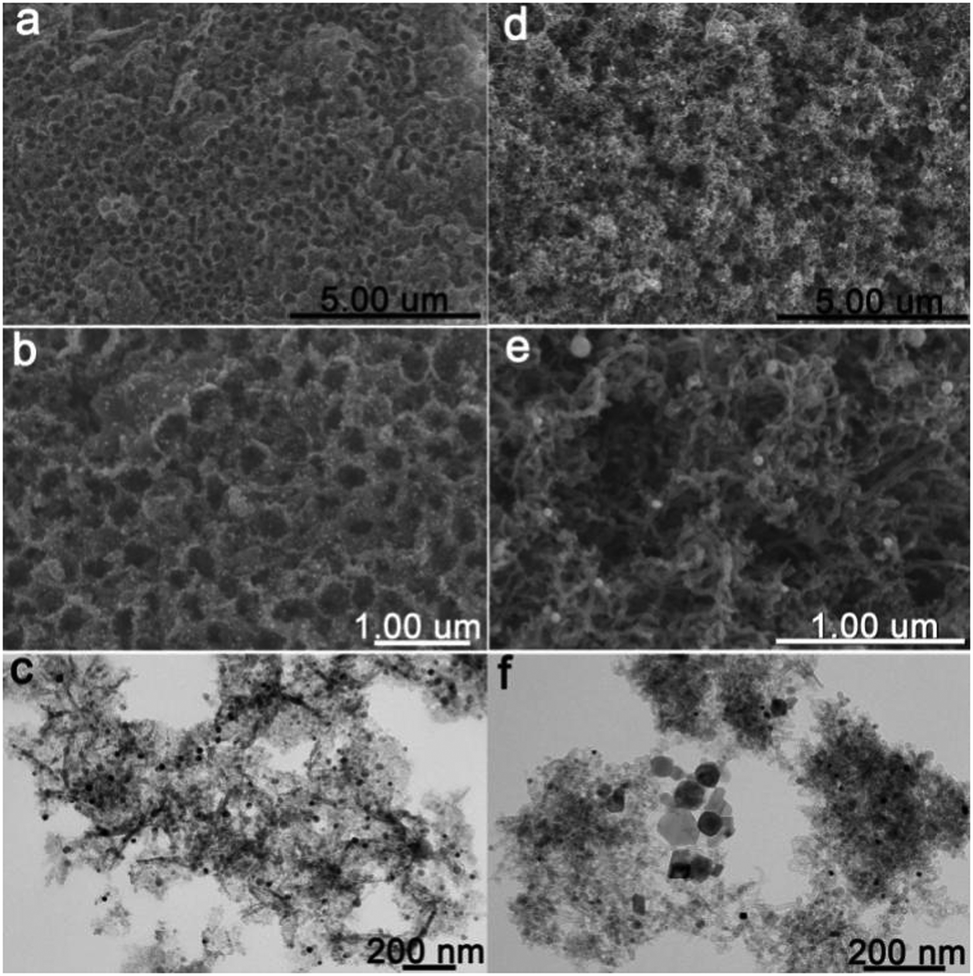
In addition, the morphology of the TiO2@C–Ni composite could be modulated by altering the calcination temperatures. As can be seen in Fig. 4, the SEM and TEM images of TiO2@C–Ni-700 and TiO2@C–Ni-900 show completely different morphologies. TiO2@C–Ni-700 (Fig. 4(a–c)) shows a 3D macroporous structure that is similar to that of TiO2@C–Ni-500, but the ordered macro-/mesoporous morphology was a little distorted as compared to that of TiO2@C–Ni-500. This was due to the increased crystallinity and size of the TiO2 interlayer with the increase of temperature. While in the TiO2@C–Ni-900, a large amount of carbon nanotubes (CNTs) are observed in the SEM (Fig. 4(d and e)) and TEM (Fig. 4(f)) images of TiO2@C–Ni-900. All of the generated carbon nanotubes as well as the TiO2 interlayer are weaved together into continuous 3D networks. From the TEM images (Fig. 4(f)), Ni NPs with a diameter of about 10 nm exist inside the graphitic carbon nanotubes. Meanwhile, aggregated Ni NPs are also observed, which is due to the sintering effect of high temperature treatment.
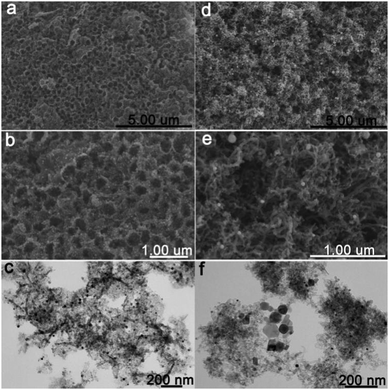 |
| | Fig. 4 SEM and TEM images of TiO2@C–Ni-700 (a–c), and TiO2@C–Ni-900 (d–f) obtained by calcining PMMA@TiO2@PDA–Ni2+ at 700 °C and 900 °C respectively under an N2 atmosphere. | |
The development of 3D porous carbon nanotube networks is highly desired in energy storage applications. Mai and co-workers have developed a general strategy for the oriented formation of CNTs using metal–organic frameworks (MOFs) as templates by a low-temperature pyrolysis process. The selected MOF crystals act as a single precursor for both nanocatalysts and carbon sources, which are essential for the oriented formation of CNTs.24 The Co/Zn-based zeolitic imidazolate framework (Co/Zn-ZIF-67) was also used as the precursor to obtain the intermediate product of a Co/Co3ZnC dodecahedron with an N-doped carbon overlayer and the rooted carbon nanotube antennas (denoted as Co/Co3ZnC@N–C–CNT) in a chemical vapor reduction/deposition process.25 Herein, 3D TiO2@C–Ni composites can act as a single donor for both nanometal catalysts and carbon sources owing to the successful immobilization of Ni NPs and the carbonization of PMMA and PDA during the pyrolysis process. This kind of 3D architecture was effectively assembled with CNTs, holding the merits of high specific surface area, well-dispersed magnetic Ni NPs and robust macro/mesoporous frameworks, which will lead to high electrochemical activity, fast mass transport, and good strain accommodation. Further studies are underway.
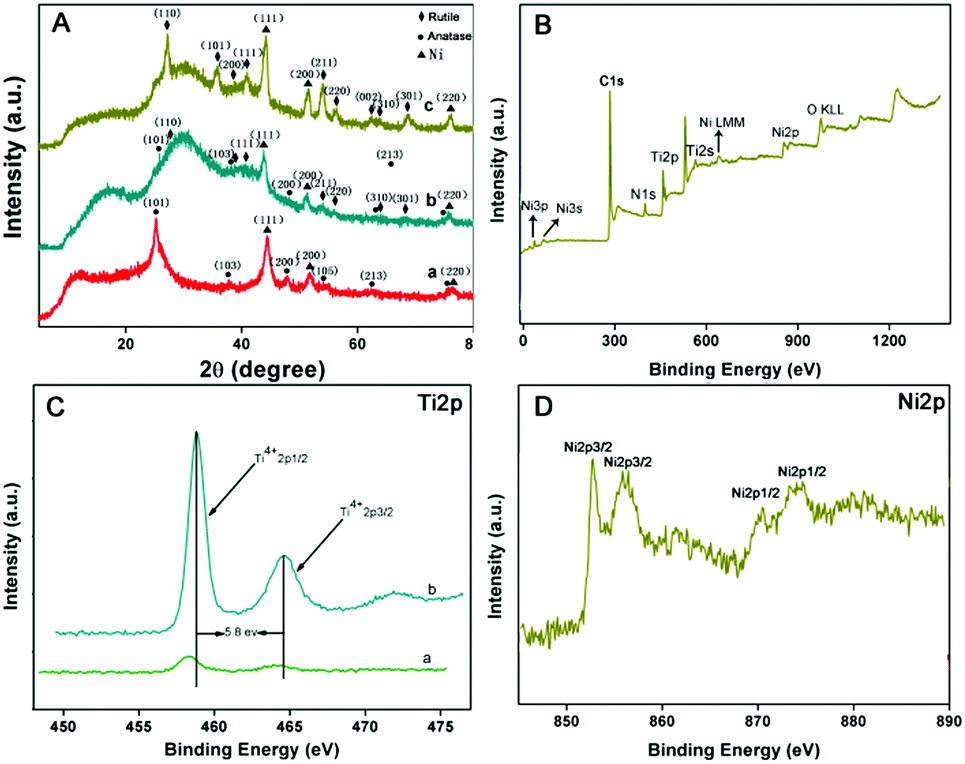
The chemical composition of the resultants was investigated by means of XRD and XPS techniques. As shown in Fig. S1(A) (ESI†), the XRD patterns of PMMA, PMMA@TiO2 and PMMA@TiO2@PDA–Ni2+ show similar diffraction patterns with three broad peaks at ∼15°, ∼30° and ∼42°, which indicate the low crystallization and similar 3D structure of these above three. In addition, the diffraction peaks of TiO2 in PMMA@TiO2 and PMMA@TiO2@PDA–Ni2+ are not seen due to the amorphous phase of TiO2. After being carbonized at different temperatures, 3D TiO2@C–Ni with different morphologies is obtained. As shown in Fig. 5A, the XRD pattern of TiO2@C–Ni-500 (a) corresponds to the anatase phase (JCPDS #21-1272).26,27 With the increase of temperature, TiO2@C–Ni-700 (b) displayed a partial phase transition from anatase to rutile (JCPDS 87-920). On further increase in the temperature to 900 °C in nitrogen, the anatase phase of TiO2 was totally transformed into the rutile phase, indicating that the anatase/rutile ratio decreased with the increase of carbonization temperature. The XRD patterns of Ni NPs can be clearly seen in all three TiO2@C–Ni calcined at different temperatures but with different crystallinity and particle size. Therefore, it can be concluded that the crystallinity and particle size of the Ni NPs, the phase of TiO2, and the morphology of the carbonized composites can be effectively tailored by varying the annealing temperatures.
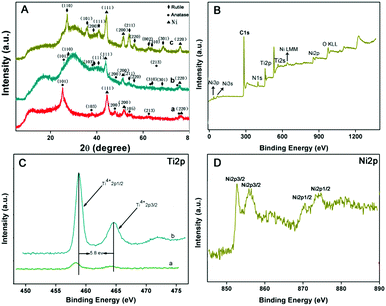 |
| | Fig. 5 (A) X-Ray diffraction patterns of TiO2@C–Ni-500 (a), TiO2@C–Ni-700 (b) and TiO2@C–Ni-900 (c) annealed at 500 °C, 700 °C and 900 °C respectively; (B) survey XPS spectra of TiO2@C–Ni-500; (C) the core-level Ti 2p of PMMA@TiO2@PDA–Ni2+ (a) and TiO2@C–Ni (b) composites; (D) the core-level Ni 2p of TiO2@C–Ni-500. | |
The XPS spectra were also performed to probe the components of 3D TiO2@C–Ni-500. As shown in Fig. 5(B), XPS results suggest that Ti, Ni, O, C, and N are the primary elements existing in the 3D TiO2@C–Ni-500 composites. The Ti 2p spectrum of PMMA@TiO2@PDA–Ni2+ (Fig. 5(C)(a)) shows two peaks near 458.6 eV and 463.7 eV corresponding to Ti 2p3/2 and Ti 2p1/2 peaks of Ti4+ oxidation state,28,29 respectively. Compared with the PMMA@TiO2@PDA–Ni2+, the Ti 2p3/2 and 2p1/2 peaks of 3D TiO2@C–Ni (Fig. 5(C)(b)) both shifted towards higher binding energies, indicating that the electrons deviated from the 3D TiO2 to the C–Ni layers. In the Ni 2p spectrum of TiO2@C–Ni in Fig. 5(D), the high-resolution spectrum of Ni 2p shows obvious signals at 852.9 eV for Ni 2p3/2 and 870.9 eV for Ni 2p1/2 accompanied by two satellite peaks, confirming the formation of metallic nickel with zero valence state in 3D TiO2@C–Ni.30
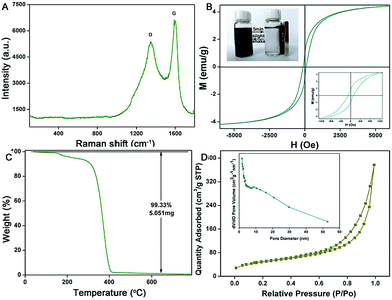
To further characterize the structural properties of the 3D TiO2@C–Ni-500 composites, Raman spectroscopy was also carried out. As shown in Fig. 6(A), the Raman spectroscopy of TiO2@C–Ni-500 presents two intense bands at around 1350 cm−1 and 1586 cm−1 respectively corresponding to the D and G bands of a graphitic structure,31,32 which further indicated the successful coating of PDA-derived carbon. In addition, the magnetic properties of 3D TiO2@C–Ni-500 were determined by vibrating sample magnetometer (VSM). As illustrated in Fig. 6(B), the coercivity of TiO2@C–Ni was estimated to be 117.7 Oe, and the inset displayed in Fig. 6(B) shows the magnified hysteresis loops at the lower magnetic field. The saturation magnetization obtained from Fig. 6(B) is 4.04 emu g−1. The VSM results further confirmed the existence of magnetic Ni NPs. Moreover, the thermal stability of the as-prepared PMMA@TiO2@PDA–Ni2+ was detected by means of the thermogravimetry (TG) diagrams. As shown in Fig. 6(C), the weight loss of the PMMA@TiO2@PDA–Ni2+ from RT to 250 °C corresponded to the elimination of water and residual solvent accounting for approximately 7 wt% of the total mass. The significant fall from 250 °C to 410 °C was attributed to the removal of the PMMA templates and the decomposition of PDA. When the temperature was higher than 410 °C, no obvious weight loss was observed, indicating that the PMMA templates have been completely removed in the annealing process. In addition, the TGA profile of 3D TiO2@C–Ni-500 was also provided for evaluating the thermal stability (Fig. S5, ESI†). The TGA plots of 3D TiO2@C–Ni-500 show a gradual weight loss between 300 °C and 500 °C which can be assigned to the decomposition of the N-doped carbon layer derived from PDA and the oxidation of Ni to nickel oxide. The weight loss for the N-doped carbon layer also starts at around 300 °C and by 700 °C the combustion of all the carbon in an air atmosphere is complete. The chemical reactions taking place during the heating process in TGA are: C + O2 = CO2, 4Ni + 3O2 = 2Ni2O3. The sample weight remains nearly unchanged after 750 °C for 3D TiO2@C–Ni-500 and no further weight loss was observed. A residue of 64.4% of the respective oxides (Ti and Ni) was obtained at 800 °C when heated in an air atmosphere.
 |
| | Fig. 6 (A) The Raman spectra of 3D TiO2@C–Ni-500; (B) magnetic hysteresis curves of 3D TiO2@C–Ni-500; (C) TGA curve of 3D PMMA@TiO2@PDA–Ni2+; (D) nitrogen adsorption–desorption isotherms and BJH pore size distributions of 3D TiO2@C–Ni-500 (insets). | |
N2 adsorption–desorption measurement was implemented to compare and analyze the surface porosity and chemical properties of the 3D TiO2@C–Ni-500 depending on the Barrett–Joyner–Halenda model. As shown in Fig. 6(D), the isotherm curves exhibit an apparent hysteresis loop in the range of 0.5–1.0 P/P0, which corresponds to the type IV isotherms and indicates a macro-/mesoporous structure.33,34 The BET surface area and pore volume of the sample were 170.852 m2 g−1 and 0.329 cm3 g−1 respectively. A desorption branch existed in the relative pressure close to the minimum pressure value of the N2 adsorption and desorption isotherms. This meant that the 3D TiO2@C–Ni-500 composites owned a H2 type hysteresis loop. The BJH pore size distribution of the as-prepared composites was also measured, as can be seen from the inset. The average pore size of the 3D composites was mainly concentrated around 7.69 nm, which could be attributed to the mesopores and the interstitial space in the network of 3D TiO2@C–Ni-500. In addition, the distribution pore size curve has a slight embossment around 10 nm, indicating the existence of macropores in the composites.35 It also further explained the formation of a H2 type hysteresis loop. In addition, Fig. S6(A) (ESI†) displayed the FT-IR spectra of PMMA@TiO2@PDA–Ni2+ and TiO2@C–Ni composites. The big peak at 3454.3 cm−1 was assigned to the characteristic of the O–H stretching vibration. As depicted in curve a, bands at 3000–2900 cm−1, 1735 cm−1, and 1300–1100 cm−1 were present corresponding to the –CH3, C![[double bond, length as m-dash]](https://www.rsc.org/images/entities/char_e001.gif) O, and C–O stretching vibration of PMMA. The PDA displayed only two peaks at around 1615 cm−1 from aromatic rings and 3420 cm−1 from catechol-OH groups. After carbonization, most of the characteristic peaks of organic groups disappeared (curve b), indicating the successful synthesis of 3D TiO2@C–Ni composites.
O, and C–O stretching vibration of PMMA. The PDA displayed only two peaks at around 1615 cm−1 from aromatic rings and 3420 cm−1 from catechol-OH groups. After carbonization, most of the characteristic peaks of organic groups disappeared (curve b), indicating the successful synthesis of 3D TiO2@C–Ni composites.
3.2. Catalytic test of the 3D TiO2@C–Ni-500 composites
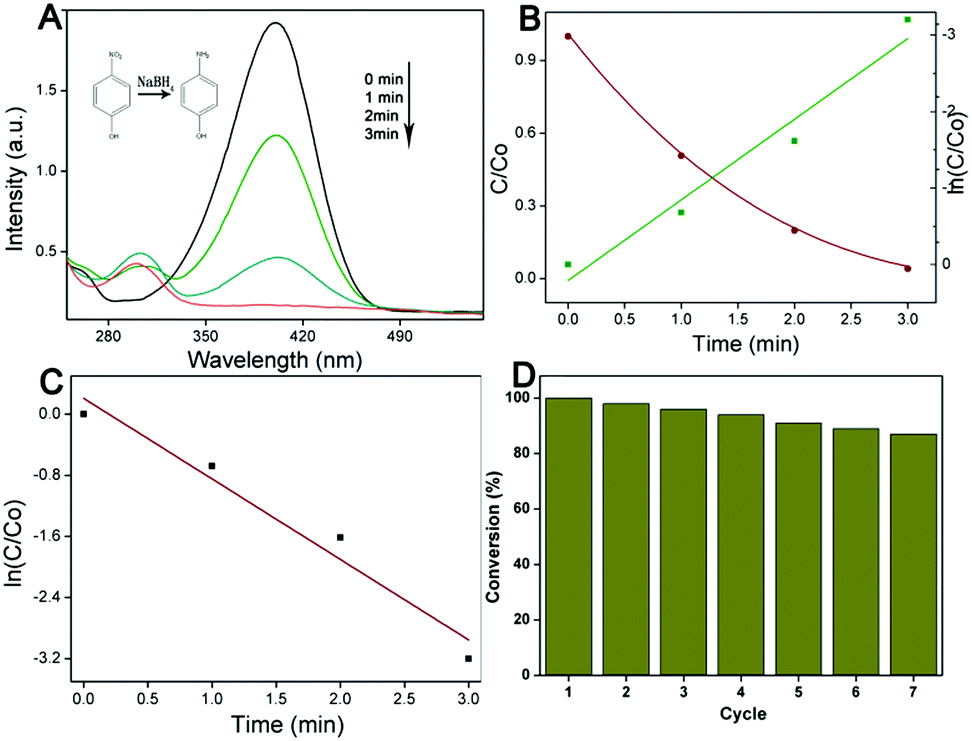
The large porous nature, uniform channels and 3D periodic array of the 3D composites not only increase the density of accessible active sites, but also greatly facilitate mass diffusion within the frameworks, which are of great importance for applications in the catalysis field. In order to further investigate the relationship between the structure and catalytic effect of the 3D TiO2@C–Ni-500 hybrids, the reduction of 4-nitrophenol (4-NP) by NaBH4 was used as a model to evaluate the catalytic activity of 3D TiO2@C–Ni. In the absence of catalyst, the reduction can hardly occur. Fig. 7(A) displays the UV-vis absorption spectra of the reduction of 4-NP by NaBH4 with 3D TiO2@C–Ni as the catalyst, which was detected during the course of reaction at a time interval of 1 min. The UV-vis absorption caused by 4-NP at 400 nm slowly declined and the absorption stemming from 4-aminophenol (4-AP) at 295 nm gradually increased, which indicated the absolute transformation of 4-NP to 4-AP within 3 min. The reduction rate can be considered as a constant throughout the whole reduction process and was not related to NaBH4 in the case of high initializing concentration. Therefore, an analogous first-order kinetic equation can be applied to evaluate the catalytic rate. Thus, the equation is depicted as follows:
| −dC/dt = dA/dt = kCt = kAt |
| ln(C/C0) = ln(A/A0) = −kt |
where C is the concentration of 4-NP at time t, and k is the apparent rate constant. The ln(C/C0) versus t plot in Fig. 7(C) shows a good linear relationship. The rate constant k was evaluated to be 0.0176 s−1. In order to compare the reaction speed of the different catalysts for 4-NP, the activity parameter κ was introduced, which is defined as the ratio of the rate constant k and loading amounts of catalysts. According to the ICP results, the loading amount of Ni in the 3D TiO2@C–Ni composites is 44.90 μg mg−1. The activity parameter κ achieved by the 3D TiO2@C–Ni-500 composites for the catalysis of 4-NP is calculated to be 152.0 × 10⁻³ mg−1 s−1, which was remarkably higher than that reported for the catalysts based on different kinds of supports and NPs with various morphologies and sizes. A comparison of the catalytic activities between 3D TiO2@C–Ni-500 and other previously reported metal catalysts is provided in Table S1 (ESI†). The stability of the catalytic activity was also checked by a catalytic recycling experiment. It was worth mentioning that the catalyst can be easily separated from the 4-NP solution by a magnet, and the catalytic conversion rate was still as high as 85% after 7 times recycling (as shown in Fig. 7(D)). The good catalytic activity and stability of the 3D TiO2@C–Ni-500 composite can be attributed to its unique 3D structure as well as well-dispersed Ni NPs embedded in the carbon layer on the 3D TiO2 support. Notably, the SEM image (as shown in Fig. S7, ESI†) shows that the 3D TiO2@C–Ni-500 composites still retain a well-defined 3D macro-/mesoporous morphology even after seven recycling stages.
 |
| | Fig. 7 (A) UV-vis adsorption spectra of the solution containing 4-NP collected at different reaction times with 3D TiO2@C–Ni-500 composites as the catalyst; (B) C/C0 and ln(C/C0) versus time for the reduction of 4-NP by NaBH4 with 3D TiO2@C–Ni-500 as the catalyst; (C) C/C0versus time for the reduction of 4-NP; (D) cyclic catalytic activity curve with 4 mg 3D TiO2@C–Ni-500 as the catalyst. | |
3.3. Isotherm adsorption of his-rich proteins
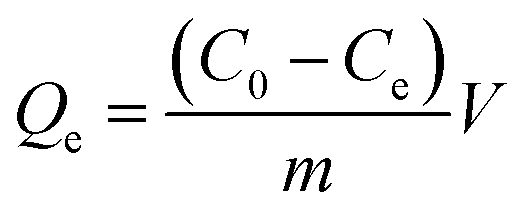
In view of the high surface area, high density of Ni NPs and interconnected spaces of 3D materials,36 the 3D TiO2@C–Ni-500 was designed to be a good candidate for protein adsorption. Considering the chelation of imidazole in histidine-rich proteins with nickel ions, bovine hemoglobin (BHb) was selected as a model to test the potential adsorption ability of 3D TiO2@C–Ni-500 to histidine-rich proteins. The isothermal adsorption curve was implemented and shown in Fig. 8(A). As can be seen, the saturated adsorption capacity obtained from Fig. 8(A) is about 1000 mg g−1. The equilibrium adsorption capacity (Qe, mg g−1) was calculated depending on the following formula:| |  | (1) |
where C0 is the initial protein concentration of each gradient concentration (mg mL−1), Ce is the protein concentration in the supernatant (mg mL−1) after reaching adsorption equilibrium, V represents the introduced volume of protein solution (mL) and m corresponds to the weight of adsorbent. To better understand the connection between adsorbent and BHb, two typical isotherm models, the Langmuir and Freundlich models, were employed. The isotherm data showed better correlation with the Langmuir model (R2 = 0.995). The fitting curves of the Langmuir model and Freundlich model are shown in Fig. 8(B) and Fig. S5(B) (ESI†), and all fitting parameters are listed in Table 1. The saturated adsorption capacity obtained from the Langmuir model is estimated to be 1031.27 mg g−1, which is obviously higher than most previously reported materials (as shown in Table S2, ESI†).
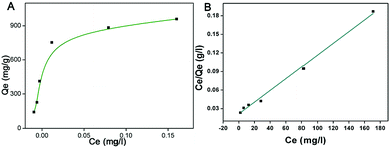 |
| | Fig. 8 (A) The isotherm adsorption curve of 3D TiO2@C–Ni-500 composites for the adsorption of BHb; and (B) the fitting curve of the Langmuir model. | |
Table 1 The fitting parameters of the Langmuir and Freundlich models
| Model |
R
2
|
K
d
|
K
f (mg g−1) |
Q
m (mg g−1) |
n
|
The Langmuir equation is: Ce/Qe = (1/Qm)Kd + Ce/Qm, where Qm is the saturated adsorption capacity, and Kd is the Langmuir constant representing the decomposition rate.
The Freundlich equation is: log![[thin space (1/6-em)]](https://www.rsc.org/images/entities/char_2009.gif) Qe = logKf + (1/n)logCe, where Kf represents the adsorption capacity and n is related to the adsorption intensity. Qe = logKf + (1/n)logCe, where Kf represents the adsorption capacity and n is related to the adsorption intensity.
|
| Langmuira |
0.995 |
46.10 |
|
1031.27 |
|
| Freundlicb |
0.691 |
|
3235.69 |
|
1.826 |
3.4. Selective adsorption of his-rich proteins
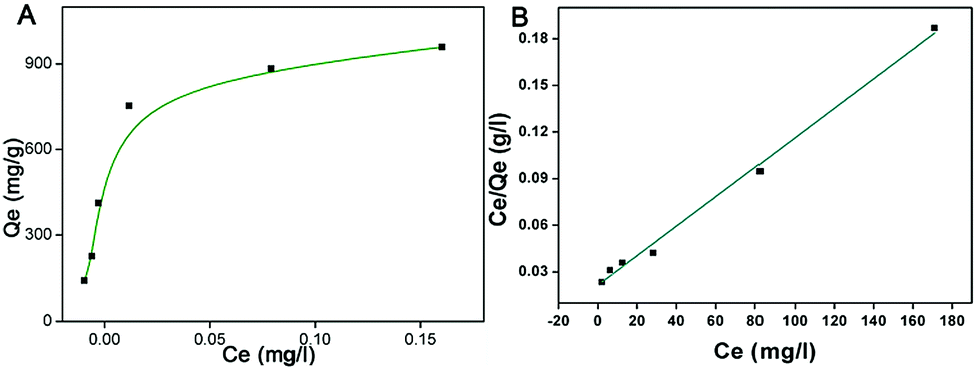
In view of the distinct affinity of metallic Ni NPs for histidine-rich proteins, the as-prepared 3D TiO2@C–Ni-500 composites were designed and evaluated for the removal of his-rich proteins from biological fluid. In order to study the selective removal of his-rich proteins in biological fluid, several solutions including BHb solution, BSA solution, a binary BHb and BSA solution, and a 100-fold dilution of human blood were prepared and treated with the 3D TiO2@C–Ni-500 composites. The initial solution, supernatant, and eluent solution were collected and characterized by an SDS-PAGE test.
As shown in Fig. 9, the protein bands at 14.4 kDa and 66.2 kDa in the electrophotogram are mainly attributed to hemoglobin and serum albumin. As shown in Fig. 9(A), it can be clearly seen that after being treated with 3D TiO2@C–Ni-500 hybrid, the BHb band obviously faded (lane 3), indicating that hemoglobin was effectively adsorbed by the 3D TiO2@C–Ni-500 hybrid. Meanwhile, the BSA band in adsorbed BSA solution (lane 6) nearly remained unchanged. This was attributed to more histidine residues of BHb compared to BSA. In order to further study the interaction among proteins on the target protein adsorption, BSA/BHb blended solution and dilution of human blood were conducted as complex biological samples (as shown in Fig. 9(B)). The lanes 3 and 6 remain almost constant compared with lanes 2 and 5, indicating that captured hemoglobin in the binary BHb/BSA solution and diluted human blood is lower than that in the BHb solution, which was mainly attributed to the reason that the interaction among different proteins can effectively decrease the adsorption on the target protein. However, HHb and HSA protein banks still can be seen in the eluted solution (lanes 4, 7). The SDS-PAGE results confirm that selective adsorption of hemoglobin in practical biological samples is achieved by 3D TiO2@C–Ni-500 hybrids, and the interaction among different proteins in complex biological blood has a negative effect on the adsorption of hemoglobin.
 |
| | Fig. 9 SDS-PAGE assay results. (A) Lane 1, marker (kDa); lane 2, initial BHb solution; lane 3, supernatant BHb solution; lane 4, eluted BHb solutions; lane 5, initial BSA solution; lane 6, supernatant BSA solution; lane 7, eluted BSA solution. (B) Lane 1, marker; lane 2, initial BSA/BHb blended solution; lane 3, supernatant BSA/BHb blended solution; lane 4, eluted BSA/BHb blended solution; lane 5, initial dilution of human blood; lane 6, supernatant dilution of human blood; lane 7, eluted dilution of human blood. | |
4. Conclusions
In this work, a hard template method and sol–gel process in combination with carbonization treatment were adopted to prepare a novel 3D TiO2 skeleton with a high density of Ni NPs embedded in a nitrogen-doped porous carbon interlayer (3D TiO2@C–Ni hybrids). These architectures are effectively assembled with high density of tiny Ni NPs, which possess a large specific surface area of the mesopores, efficient mass transport, and increased accessible surface area from the macropores, leading to excellent catalytic performance for 4-NPs as well as high adsorption of his-rich proteins. Furthermore, higher calcination temperatures can generate a large amount of carbon nanotubes, leading to the formation of 3D TiO2@Ni–CNTs. The PMMA@TiO2@PDA–Ni2+ hybrid acts as a single precursor for both nanocatalysts and carbon sources. Generating small Ni nanocatalysts with high activity is the key to the formation of CNTs during the pyrolysis process. Therefore, our work provides a novel approach towards the synthesis of 3D TiO2@Ni–CNTs, which will exhibit great potential in many fields. We also believe that the 3D TiO2@C–Ni hybrid is promising in other applications such as energy storage, electro-catalysis, etc. More importantly, this strategy of using a 3D PMMA@inorganic shell to anchor a high density of metallic NPs is a general method and can be extended to the synthesis of other Ni alloys for galvanic replacement reactions with noble metal ions.
Conflicts of interest
There are no conflicts to declare.
Acknowledgements
This research was supported by the National Natural Science Fund of China (grant number 21601121 and 21305086), the Natural Science Foundation of Shanghai City (18ZR1416400), and the Program for Professor of Special Appointment (Eastern Scholar) at Shanghai Institutions of Higher Learning (grant number QD2016037).
References
- R. S. Downing, P. J. Kunkeler and H. V. Bekkum, Catal. Today, 1997, 37, 121–136 CrossRef CAS.
- A. M. Tafesh and J. Weiguny, Chem. Rev., 1996, 96, 2035–2052 CrossRef CAS.
- S. Saha, A. Pal, S. Kundu, S. Basu and T. Pal, Langmuir, 2010, 26, 2885–2893 CrossRef CAS PubMed.
- F. Lin and R. Doong, J. Phys. Chem. C, 2011, 115, 6591–6598 CrossRef CAS.
- Y. Zhang, M. Zhang, J. Yang, L. Ding, J. Zheng, J. Xu and S. Xiong, Nanoscale, 2016, 8, 15978 RSC.
- L. Ding, M. Zhang, Y. Zhang, J. Yang, J. Zheng and J. Xu, Green Chem., 2016, 18, 6282–6290 RSC.
- H. J. Jung, K. Nam, J. Lee, D. H. Han, H. G. Sung, H. S. Hyun, Y. Sohn and W. G. Shin, Mater. Des., 2017, 125, 205–212 CrossRef CAS.
- X. Guo, M. Zhang, J. Zheng, J. Xu, T. Hayat, N. S. Alharbi, B. Xi and S. Xiong, Dalton Trans., 2017, 46, 11598–11607 RSC.
- J. Wang, M. Zhang, J. Xu, J. Zheng, T. Hayat and N. S. Alharbi, Dalton Trans., 2018, 47, 2791–2798 RSC.
- R. Q. Zou, H. S. Dr and X. D. Qiang, Angew. Chem., Int. Ed., 2006, 45, 2542–2546 CrossRef CAS.
- H. Xu, J. Jia, Y. Guo, Z. Qu, Y. Liao, J. Xie, W. Shangguan and N. Yan, J. Hazard. Mater., 2017, 342, 69–76 CrossRef.
- A. Santra, I. Senkovska, S. Kaskel and P. K. Bharadwaj, Inorg. Chem., 2013, 52, 7358–7366 CrossRef CAS.
- H. Zhang, R. Wu, Z. Chen, G. Liu, Z. Zhang and Z. Jiao, CrystEngComm, 2012, 14, 1775–1782 RSC.
- P. Du, Y. Yang, J. Yang, B. K. Liu and J. F. Ma, Dalton Trans., 2013, 42, 1567–1580 RSC.
- S. A. Ganiyu, O. Muraza, A. S. Hakeem, K. Alhooshani and M. A. Atieh, Chem. Eng. J., 2014, 258, 110–118 CrossRef CAS.
- H. Liang, Y. Zhang and Y. Liu, Energy Chemistry, 2008, 17, 403–408 CAS.
- Y. Wei, J. Jiao, Z. Zhao, J. Liu, J. Li, G. Jiang, Y. Wang and A. Duan, Appl. Catal., B, 2015, 179, 422–432 CrossRef CAS.
- J. Jiao, Y. Wei, Z. Zhen, W. Zhong, L. Jian, J. Li, A. Duan and G. Jiang, Catal. Today, 2015, 258, 319–326 CrossRef CAS.
- J. Wang, G. Yang, L. Cheng, E. W. Shin and Y. Men, Catal. Sci. Technol., 2015, 5, 4594–4601 RSC.
- J. Wang, L. Cheng, W. An, J. Xu and Y. Men, Catal. Sci. Technol., 2016, 6, 7342–7350 RSC.
- S. Zhang, Y. Zhang, G. Bi, J. Liu, Z. Wang, Q. Xu, H. Xu and X. Li, J. Hazard. Mater., 2014, 270, 27–34 CrossRef CAS PubMed.
- J. Wang, M. Zhang, T. Miao, Y. Ling, Q. Wen, J. Zheng, J. Xu, T. Hayat and N. S. Alharbi, Inorg. Chem. Front., 2018, 5, 844–852 RSC.
- S. Zhang, Y. Zhang, J. Liu, Q. Xu, H. Xiao, X. Wang, H. Xu and J. Zhou, Chem. Eng. J., 2013, 226, 30–38 CrossRef CAS.
- J. Meng, C. Niu, L. Xu, J. Li, X. Liu, X. Wang, Y. Wu, X. Xu, W. Chen and Q. Li, J. Am. Chem. Soc., 2017, 139, 8212–8221 CrossRef CAS PubMed.
- H. Li, Y. Su, W. Sun and Y. Wang, Adv. Funct. Mater., 2016, 26, 3314–3323 CrossRef.
- M. Liu, J. Zheng, Q. Liu, S. Xu, M. Wu, Q. Xue, Z. Yan, H. Xiao, Z. Wei and H. Zhu, RSC Adv., 2013, 3, 9483–9489 RSC.
- Y. Xu, E. M. Lotfabad, H. Wang, B. Farbod, Z. Xu, A. Kohandehghan and D. Mitlin, Chem. Commun., 2013, 49, 8973–8975 RSC.
- R. Pandiyan, N. Delegan, A. Dirany, P. Drogui and M. A. E. Khakani, J. Phys. Chem. C, 2016, 120, 631–638 CrossRef CAS.
- W. Sui, J. Zheng, C. U. Pittman Jr, N. Bensalah, M. Wu and Y. Zhao, Funct. Mater. Lett., 2014, 7, 1350068 CrossRef.
- M. Salimian, M. Ivanov, F. L. Deepak, D. Y. Petrovykh, I. Bdikin, M. Ferro, A. Kholkin, E. Titus and G. Goncalves, J. Mater. Chem. C, 2015, 3, 11516–11523 RSC.
- M. Zhang, B. Wang, Y. Zhang, W. Li, W. Gan and J. Xu, Dalton Trans., 2015, 45, 922–927 RSC.
- Y. Lü, Y. Wang, H. Li, Y. Lin, Z. Jiang, Z. Xie, Q. Kuang and L. Zheng, ACS Appl. Mater. Interfaces, 2015, 7, 13604–13611 CrossRef PubMed.
- J. Zhou, A. Meifang Zhou and R. A. Caruso, Langmuir, 2006, 22, 3332–3336 CrossRef CAS PubMed.
- X. Qu, D. Xie, L. Gao, L. Cao and F. Du, J. Mater. Sci., 2015, 50, 21–27 CrossRef CAS.
- J. Zhang, L. Li, D. Liu, J. Zhang, Y. Hao and W. Zhang, Mater. Des., 2015, 86, 818–828 CrossRef CAS.
- Q. Zhang, Q. Zhao, Y. Zhang, N. Han, L. Hu, C. Zhang, T. Jiang and S. Wang, J. Colloid Interface Sci., 2014, 434, 113–121 CrossRef CAS PubMed.
Footnote |
| † Electronic supplementary information (ESI) available: X-ray diffraction patterns of PMMA (a), PMMA@TiO2 (b), PMMA@TiO2@PDA–Ni2+ (c); the particle size distribution of PMMA; SEM and TEM images of PMMA@TiO2 and 3D inverse-opal TiO2 carbonized at 500 °C; SEM image of PMMA@PDA–Ni2+, and SEM and TEM images of 3D C–Ni annealed at 500 °C in N2 atmosphere; SEM image of 3D PMMA@SiO2@PDA–Ni2+ composites; SEM image and TEM image of 3D SiO2@C–Ni annealed at 500 °C in N2 atmosphere; TGA curves of 3D TiO2@C–Ni-500. The FT-IR spectra of PMMA@TiO2@PDA–Ni2+ (a) and TiO2@C–Ni (b) composites and the fitting curve of Freundlich model; SEM images of 3D TiO2@C–Ni-500 after seven catalytic reactions. See DOI: 10.1039/c8qm00467f |
|
| This journal is © the Partner Organisations 2019 |
Click here to see how this site uses Cookies. View our privacy policy here. 
 *a,
Teng
Miao
a,
Jingxia
Yang
a,
Jingli
Xu
a,
Njud S.
Alharbi
b and
Muhammad
Wakeel
c
*a,
Teng
Miao
a,
Jingxia
Yang
a,
Jingli
Xu
a,
Njud S.
Alharbi
b and
Muhammad
Wakeel
c