An in situ (K0.5Na0.5)NbO3-doped barium titanate foam framework and its cyanate ester resin composites with temperature-stable dielectric properties and low dielectric loss†
Longhui
Zheng
 ab,
Li
Yuan
 a,
Guozheng
Liang
 *a and
Aijuan
Gu
 *a
*a
aState and Local Joint Engineering Laboratory for Novel Functional Polymeric Materials, Jiangsu Key Laboratory of Advanced Functional Polymer Design and Application, College of Chemistry, Chemical Engineering and Materials Science, Soochow University, Suzhou, 215123, China. E-mail: lgzheng@suda.edu.cn; ajgu@suda.edu.cn; Fax: +86 51265880089; Tel: +86 51265880967
bKey Laboratory of Design and Assembly of Functional Nanostructures, Fujian Institute of Research on the Structure of Matter, Chinese Academy of Sciences, Fuzhou, 350000, China
First published on 5th March 2019
Abstract
Lower dielectric loss, higher dielectric constant and wider service temperature are prerequisites of high dielectric constant materials for renewable and new energy generation technology. Herein, an in situ doping strategy was set up to prepare a new foam ceramic (dBTF), in which the 3D skeleton is (K0.5Na0.5)NbO3 (KNN)-doped barium titanate (BT). On this basis, a series of composites (dBTF/CE/cPES) using a blend of dBTF and cyanate ester/phenolphthalein poly(ether sulfone) (CE/cPES) as the matrix were prepared. Effects of both spatial and chemical structures on the dielectric properties of composites were studied. When the ceramic content is only 31.5 vol%, the resultant composite (6dBTF5/CE/cPES) not only has about a 6.3 times higher dielectric constant than the dBTF powder-filled CE/cPES composite (6dBTFp5/CE/cPES), but also exhibits outstanding temperature stability from −100 to 110 °C; moreover, the two composites have extremely low dielectric loss. The reason behind these attractive properties has been discussed.
1. Introduction
The fast and urgent development of renewable energy generation technology, such as solar energy, wind energy, nuclear energy, etc., demand for new capacitor materials that can withstand more and higher stringent requirements for a faster transferring rate, smaller space size, more stable signal quality and stronger ability for standing a more severe service environment.1–4 Lead-free dielectric capacitors are becoming a new generation of energy storage components.5,6Owing to their outstanding ability to store electric energy and balance the distribution of the electric field as well as the stable dielectric constant dependent on frequency, the high dielectric constant (high-k) ceramic/polymer composites show great potential in the fabrication of high-performance capacitors.7,8
Barium titanate (BT) is a common ferroelectric material with a high-k, low dielectric loss and good insulation performance, which is often used to prepare high-k ceramic/polymer composites.9–11 However, generally, even when BT is added at a large loading (50 vol% or even more), the dielectric constant is still lower than 80 (100 Hz).12–14 This is because BT powders have no grain boundary or reduced grain boundary, and the high-k properties of ceramics cannot be exerted.
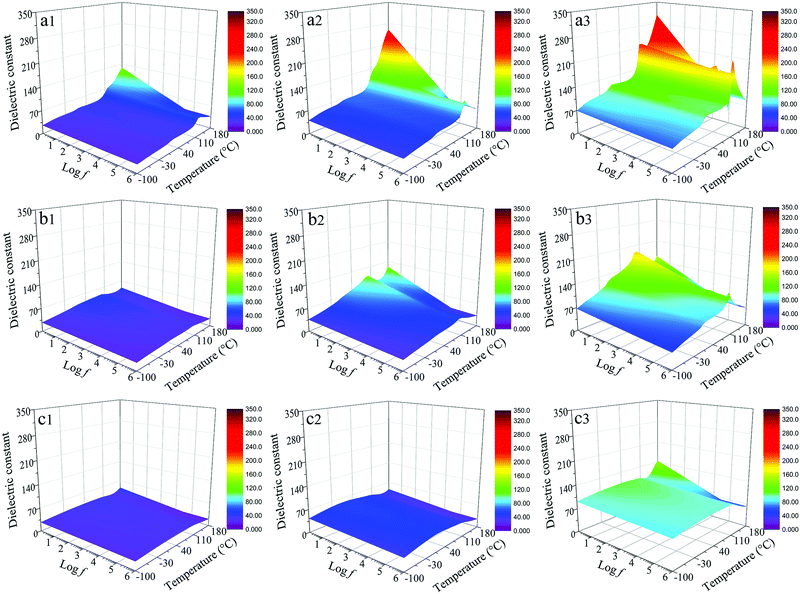
To overcome the bottleneck of traditional ceramic powders, our group prepared BT foam with a three-dimensional network skeleton (keeping the grain boundary of ceramic) and interconnecting pore channels,15,16 and its cyanate ester (CE) composites show a high-k at low ceramic contents (<34 vol%). However, a new problem appears, that is, the dielectric properties of the BT foam/CE composites show strong temperature dependence; specifically, at the temperature near the Curie temperature (120 °C) of BT,17 the dielectric properties of the BT foam/CE composites significantly jump, similar to that of BT at the Curie temperature.18–20 Obviously, this problem is not good for maintaining stable performance during service. Note that this phenomenon does not exist in traditional BT particle-filled polymer composites, because a sintering procedure is used for preparing BT foam, and then a phase transformation takes place. The traditional BT particle has a relatively independent crystalline form without a grain boundary, or the BT ceramic is damaged and its grain boundary was reduced.
In fact, with the rapid development of electronic and electrical industry, high-k materials are urgently needed to withstand severe operating environments including high temperature and low temperature.21 The increase of material temperature due to spontaneous heat during use and the high temperature environment may cause premature failure of the devices, while the low temperature is also prone to the mutation of material performance due to phase transformation.22 So it is important and necessary to study the temperature stability of the dielectric properties of high-k materials.23–25
At present, the common way to improve the stability of the dielectric properties on the temperature of BT is changing its microstructure through doping.26–28 Besides having the same crystal structure as BT,29,30 (K0.5Na0.5)NbO3 (KNN) has a high Curie point temperature (420 °C) and has been used to dope BT to effectively improve the intrinsic dielectric properties of BT.30,31 However, the doping procedure for BT powders cannot be used in preparing three-dimensional interconnecting BT foam.
Herein, novel doped barium titanate foam (dBTF) with a three-dimensional interconnecting skeleton was prepared through doping high-k nano BT with Nb2O5, Na2CO3 and K2CO3 by means of a one-step polymer foam replication method. On this basis, the composites were prepared using a CE/phenolphthalein poly(ether sulfone) (cPES) blend as the matrix. CE was selected as the main resin matrix to fabricate high-k composites due to its excellent dielectric properties.32–34 The effects and mechanism of morphology and chemical structure on the dielectric properties of the composites were intensively studied and compared with those based on CE/cPES and powders (dBTFp) obtained by grounding dBTF. Some new phenomena were found, and unique ceramic/polymer composites with lower dielectric loss, a higher dielectric constant and outstanding temperature stability were developed.
2. Experimental
2.1 Materials
The CE made in Yangzhou Technia Material Co. Ltd (China) was 2,2-bis(4-cyanatophenyl) propane. BT powders with an average size of 100 nm were purchased from Hebei Kingway Chemical Industry Co., Ltd, China. Polyurethane foams with cell sizes of 25 PPI were supplied by the Changzhou Dawei Plastic Industry Co., Ltd, China. Sodium hydroxide (NaOH), polyvinyl alcohol, methyl cellulose, polyacrylamide, Na2CO3 and K2CO3 were bought from Sinopharm Medicine Holding Co., Ltd, China. Nb2O5 was purchased from Aladdin Reagent Co., Ltd, China. cPES was provided by Xuzhou Engineering Plastics Factory, China.2.2 Preparation of dBTF
Polyurethane foam was soaked in a NaOH aqueous solution with a concentration of 15 wt%, heated to 60 °C and kept at that temperature for 3.5 h. After that, the polyurethane foam was taken out, washed 5–6 times with deionized water, and dried at 60 °C for 6 h. The dried polyurethane foam was soaked in an aqueous solution with a concentration of 2 wt% methyl cellulose for 3.0 h, taken out with the excess methyl cellulose removed, and dried at 60 °C to obtain modified polyurethane foam (mPU).A mixture (20 g) containing Na2CO3, K2CO3, Nb2O5 and BT with a molar ratio of x![[thin space (1/6-em)]](https://www.rsc.org/images/entities/char_2009.gif) :
:![[thin space (1/6-em)]](https://www.rsc.org/images/entities/char_2009.gif) x
x![[thin space (1/6-em)]](https://www.rsc.org/images/entities/char_2009.gif) :
:![[thin space (1/6-em)]](https://www.rsc.org/images/entities/char_2009.gif) 2x
2x![[thin space (1/6-em)]](https://www.rsc.org/images/entities/char_2009.gif) :
:![[thin space (1/6-em)]](https://www.rsc.org/images/entities/char_2009.gif) (400 − 4x), where x is 0, 2 and 6, was sufficiently mixed, into which 10 wt% polyvinyl alcohol aqueous solution (10 g) and 5 wt% methyl cellulose aqueous solution were added. The resultant mixture was thoroughly ground. After that, an additional 2 wt% polyacrylamide aqueous solution (5 mL) was added and fully ground to obtain a slurry.
(400 − 4x), where x is 0, 2 and 6, was sufficiently mixed, into which 10 wt% polyvinyl alcohol aqueous solution (10 g) and 5 wt% methyl cellulose aqueous solution were added. The resultant mixture was thoroughly ground. After that, an additional 2 wt% polyacrylamide aqueous solution (5 mL) was added and fully ground to obtain a slurry.
mPU was soaked in the above slurry and maintained for 5 min, followed by the removal of excess slurry in the mPU through extrusion and drying at 50 °C, successively. Repeating the above processes of coating and drying, a green body with an even coating and no blocks was obtained. The dried green body of dBTF was placed in a muffle furnace and sintered using the procedure of 20–200 °C (heating rate of 2 °C min−1) + 200–600 °C (heating rate of 1 °C min−1) + 600 °C (keeping the temperature for 60 min) + 600–1200 °C (heating rate of 5 °C min−1) + 1200 °C (keeping the temperature for 120 min). Because BT sintered at 1200 °C for 2 h has excellent dielectric properties (Fig. S1 in ESI†), the sintering was carried out at 1200 °C for 2 h. The sintered foam ceramic was coded as xdBTFn, where n is the total number of coatings (e.g., 3, 4 or 5), and x is the molar percent of KNN in dBTF.
Foam ceramic based on BT was also prepared using the above procedure, except that Na2CO3, K2CO3 and Nb2O5 were not added; the obtained foam is coded as 0dBTF.
2.3 Preparation of composites
Each xdBTFn was put into a mold, which was then preheated and maintained at 160 °C in an oven. A blend containing cPES and CE with a weight ratio of 3![[thin space (1/6-em)]](https://www.rsc.org/images/entities/char_2009.gif) :
:![[thin space (1/6-em)]](https://www.rsc.org/images/entities/char_2009.gif) 20 was heated to 160 °C and maintained at that temperature with vigorous stirring for 1 h to obtain a resin mixture, which was then poured into the preheated mold with xdBTFn and degassed under vacuum pressure at 160 °C, followed by placement into an oven for curing and post-curing with the process of 160 °C/2 h + 180 °C/2 h + 200 °C/2 h + 220 °C/2 h and 240 °C/4 h, successively; no pressure was employed. After slowly being cooled to room temperature, the target composite was obtained, coded as xdBTFn/CE/cPES.
20 was heated to 160 °C and maintained at that temperature with vigorous stirring for 1 h to obtain a resin mixture, which was then poured into the preheated mold with xdBTFn and degassed under vacuum pressure at 160 °C, followed by placement into an oven for curing and post-curing with the process of 160 °C/2 h + 180 °C/2 h + 200 °C/2 h + 220 °C/2 h and 240 °C/4 h, successively; no pressure was employed. After slowly being cooled to room temperature, the target composite was obtained, coded as xdBTFn/CE/cPES.
dBTFp and CE/cPES (3![[thin space (1/6-em)]](https://www.rsc.org/images/entities/char_2009.gif) :
:![[thin space (1/6-em)]](https://www.rsc.org/images/entities/char_2009.gif) 20 w/w) were blended at 160 °C for 0.5 h and then thoroughly stirred under sonication. Afterward, the mixture was heated and maintained at 160 °C with stirring for 0.5 h to obtain a homogenous prepolymer. The prepolymer was poured into the preheated mold and degassed under vacuum pressure at 160 °C, followed by placement into an oven for curing and post-curing with the process of 160 °C/2 h + 180 °C/2 h + 200 °C/2 h + 220 °C/2 h and 240 °C/4 h, successively; no pressure was employed. After slowly being cooled to room temperature, the cured composite was obtained and coded as xdBTFpn/CE/cPES. When x was 3, 4 or 5, the volume percentage of dBTF and dBTFp in the composite is 17.6 ± 0.1, 23.8 ± 0.1 or 31.5 ± 0.1, respectively.
20 w/w) were blended at 160 °C for 0.5 h and then thoroughly stirred under sonication. Afterward, the mixture was heated and maintained at 160 °C with stirring for 0.5 h to obtain a homogenous prepolymer. The prepolymer was poured into the preheated mold and degassed under vacuum pressure at 160 °C, followed by placement into an oven for curing and post-curing with the process of 160 °C/2 h + 180 °C/2 h + 200 °C/2 h + 220 °C/2 h and 240 °C/4 h, successively; no pressure was employed. After slowly being cooled to room temperature, the cured composite was obtained and coded as xdBTFpn/CE/cPES. When x was 3, 4 or 5, the volume percentage of dBTF and dBTFp in the composite is 17.6 ± 0.1, 23.8 ± 0.1 or 31.5 ± 0.1, respectively.
2.4 Preparation of CE/cPES
A blend containing cPES and CE with a weight ratio of 3![[thin space (1/6-em)]](https://www.rsc.org/images/entities/char_2009.gif) :
:![[thin space (1/6-em)]](https://www.rsc.org/images/entities/char_2009.gif) 20 was heated and maintained at 160 °C with stirring for 1 h to obtain a homogenous mixture. The mixture was poured into the preheated mold and degassed under vacuum pressure at 160 °C, followed by placement into an oven for curing and post-curing with the process of 160 °C/2 h + 180 °C/2 h + 200 °C/2 h + 220 °C/2 h and 240 °C/4 h, successively, no pressure was employed. After being cooled to room temperature, a cured resin (CE/cPES) was obtained.
20 was heated and maintained at 160 °C with stirring for 1 h to obtain a homogenous mixture. The mixture was poured into the preheated mold and degassed under vacuum pressure at 160 °C, followed by placement into an oven for curing and post-curing with the process of 160 °C/2 h + 180 °C/2 h + 200 °C/2 h + 220 °C/2 h and 240 °C/4 h, successively, no pressure was employed. After being cooled to room temperature, a cured resin (CE/cPES) was obtained.
2.5 Characterizations
The structures of the samples were characterized using powder X-ray diffraction (XRD, X'Pert Pro MPD, Netherlands), operated with Cu-Kα radiation (λ = 1.5406 Å) with a step size of 0.026° in the range of 10° to 90°.The morphologies of the samples were observed with a stereo microscope (SM, Stemi 2000-C, Germany) and scanning electron microscope (SEM, Hitachi S-4700, Japan) at an accelerating voltage of 15 kV. To achieve an adequate electrical conductivity, the surface of each sample was pretreated through vacuum metal spraying technology before the SEM tests.
The phase transition of ceramics under a nitrogen atmosphere was studied using differential scanning calorimetry (DSC, Q200, US) ranging from −80 °C to 160 °C with a heating rate of 10 °C min−1.
The dielectric properties at different temperatures over the frequency range of 1 to 106 Hz were measured on a broadband dielectric spectrometer (Novocontrol Concept 80, Germany). The temperature of the samples varied from −100 °C to 180 °C with a step of 10 °C at a heating rate of 5 °C min−1 using an inbuilt cooling-heating system. Before measurements, silver paint was used to coat the upper and lower surfaces of each sample to prepare the electrodes.
The breakdown strengths of samples were tested using a breakdown strength tester (GJW-100kV, Changchun Intelligent Instrument and Equipment Co., Ltd, China) with a voltage ramp rate of 1000 V s−1.
3. Results and discussion
3.1 Design, preparation and characterization of dBTF
With the aid of the unique skeleton, high porosity and three-dimensional interconnecting open pore structure of polyurethane foam, a foam ceramic can be prepared through the polymer foam replication method.35,36 However, the polymer foam replication process has strict requirements on particle size and variation of the components of the slurry during sintering. KNN-doped BT is usually prepared using a two-step method, starting from the raw materials for KNN (K2CO3, Na2CO3 and Nb2O5) and BT (BaCO3 and TiO2);30,31 however, this procedure is not suitable for the preparation of foam ceramic because there are two problems after the first sintering. One is that a large amount of gas is produced during the sintering, thus making the skeleton of the foam ceramic have many pores. The other is that the obtained BT does not have perfect grain growth and the grain boundary is not clear (Fig. S2 of the ESI†), so the preliminary product should be crushed before the first sintering. Obviously, this step will destroy the skeleton and consequently cannot be used to prepare the foam ceramic with three-dimensional interconnecting skeleton framework using the polymer foam replication method. Therefore, we chose BT to prepare KNN-doped BT foam (dBTF) through a new one-step in situ strategy as shown in Fig. 1.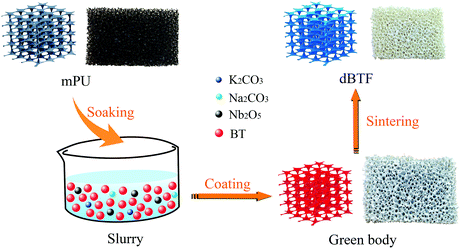 | ||
| Fig. 1 A one-step in situ strategy for the preparation of foam ceramic with the three-dimensional interconnecting skeleton of KNN-doped BT. | ||
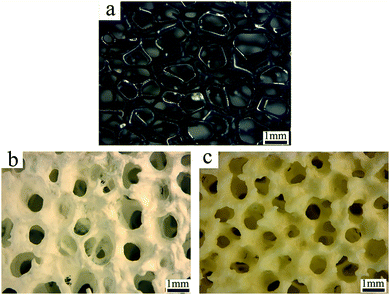
Fig. 2 gives SM images during the preparation process of dBTF. mPU has a three-dimensional continuous network (Fig. 2a). After coating with a ceramic slurry, the slurry was evenly coated onto the skeleton of mPU (Fig. 2b). mPU and organic additives (polyvinyl alcohol, methyl cellulose, polyacrylamide) were decomposed in the process of sintering, and the resultant dBTF had a good three-dimensional interconnecting skeleton and uniformly distributed pores with an average diameter of about 0.8 mm (Fig. 2c).
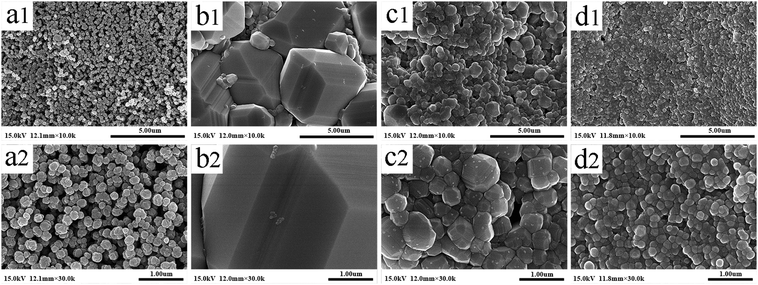
Fig. 3 shows the SEM images of commercial BT powders (unsintered) and dBTF (sintered). Compared with BT (Fig. 3a1 and a2), the dBTF skeleton has not only a larger ceramic particle size and narrower spacing between particles, but also a clear grain boundary (Fig. 3b1, b2, c1, c2 and d1, d2). On the other hand, 2dBTF5 and 6dBTF5 have smaller mean particle sizes than 0dBTF5, and the particle size of dBTF decreases and becomes more uniform as the doped KNN concentration increases. It can be noted that homogeneous microstructure is an important factor to ensure the reliable performance of the ceramics.
The transformation of particle size is mainly dependent on the migration of the grain boundary rather than bonding between small crystallites, which is determined by sintering temperature and dopant. The growth rate can be calculated using eqn (1):37
| G2 − G02 = Kt | (1) |
From Fig. 3, the average sizes of 0dBTF5, 2dBTF5 and 6dBTF5 were found to be 1.98 μm, 0.33 μm and 0.18 μm, respectively, so the growth factor calculated using eqn (1) are severally 5.43 × 10⁻⁴ μm2 s−1, 1.37 × 10⁻⁵ μm2 s−1 and 3.11 × 10⁻⁶ μm2 s−1, demonstrating that the doping of KNN hinders the spread of the grain boundary of BT and inhibits the growth of the grain; moreover, the inhibition effect is enhanced with increased KNN dosage.
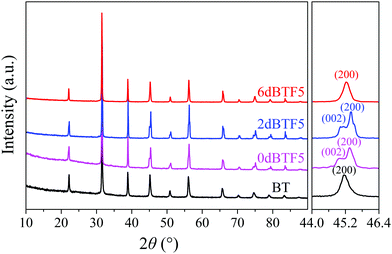
Fig. 4 gives XRD patterns of the BT powders and dBTFs. The peaks in the XRD patterns of 0dBTF5, 2dBTF5 and 6dBTF5 are consistent with those of the standard card of BT (JCPDS No. 5-0626). Note that in each XRD pattern of dBTF, the peak is sharp and no second phase or impurity phase is found, indicating that 0dBTF5, 2dBTF5 and 6dBTF5 have perovskite structure with good crystallization; moreover, it also suggests that the doping ions entirely diffuse into the lattice of BT, and a stable solid solution is formed.26
With careful observation, it was found that different from the symmetric peak centered at around 45.16° (2θ) in the pattern of the BT powder, the peak in the pattern of either 0dBTF5 or 2dBTF5 is wide and asymmetric, and can be divided into two peaks of (002) and (200), demonstrating that BT has a cubic phase, while 0dBTF5 and 2dBTF5 have a tetragonal phase.38 Note that the crystal plane of (200) of 2dBTF5 appears at a higher angle than that of 0dBTF5; this is due to the shrinkage induced by the doping ions (Na+, K+ and Nb5+) with smaller ionic radius.39 However, as the KNN loading increases, the XRD pattern of 6dBTF5 shows one strong diffraction peak at a higher angle centered at 45.24°, possibly suggesting that the diffraction peaks of (002) and (200) are fused together and that the doping ions have entered into the crystal lattice of BT.38 As a whole, the cubic phase in dBTF increases, and the tetragonal phase reduces with the increase of KNN loading in dBTF.
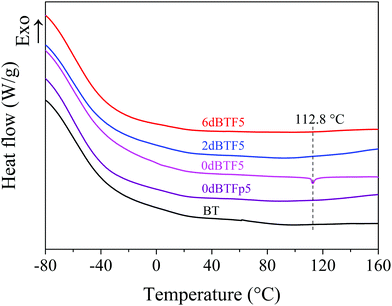
Phase transformation is an important factor causing the unstable dielectric property of the ceramic.28 The DSC curves of 0dBTF5 and 0dBTFp5 were recorded to explore the change of phase transformation of the ceramic (Fig. 5); 0dBTF5 shows one endothermic peak at 112.8 °C due to the Curie transition of BT.28 However, no peak representing phase transformation was found in the curves of 0dBTFp5, 2dBTF5 and 6dBTF5. These results indicate that with the same chemical compositions, phase transformation exists in 0dBTF, but not in the particle state. This is because the ceramic skeleton keeps the integrity of the grain boundary between ceramic particles. On the other hand, the phase transformation behaviors of 2dBTF5 and 6dBTF5 are inhibited.
3.2 Morphologies of composites
Fig. 6 displays the morphologies of the CE/cPES and 6dBTF/CE/cPES composites. The proportion of ceramic skeleton in the composites gradually increases as the number of coatings increases. The pores of dBTF are completely filled with transparent and uniform resin, and no visible cracks or breaks were found on the interface of the composite, demonstrating that the ceramic and resin have good interface, which is further confirmed by the SEM images of the fractured surface of the composite (Fig. 6e and f). Moreover, dBTF maintains a three-dimensional continuous network in the composite.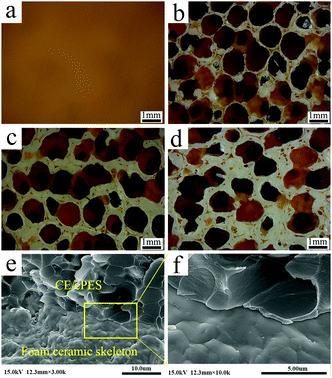 | ||
| Fig. 6 SM images of CE/cPES (a), 6dBTF3/CE/cPES (b), 6dBTF4/CE/cPES (c) and 6dBTF5/CE/cPES (d); SEM images of the fractured surface of the 6dBTF5/CE/cPES composite (e and f). | ||
3.3 Dielectric properties of composites
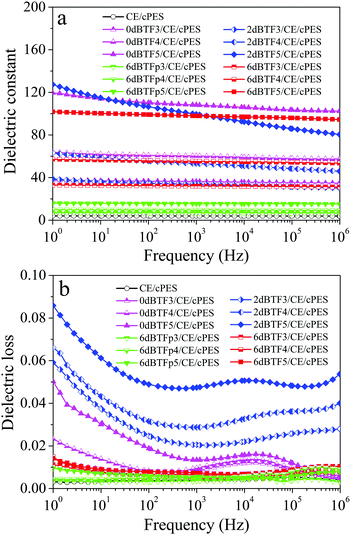 | ||
| Fig. 7 Frequency dependence of the dielectric constant (a) and loss (b) at room temperature for CE/cPES. | ||
Interestingly, dielectric constants of all 6dBTF/CE/cPES composites show very good frequency stability. In order to evaluate the frequency stability in regards to the dielectric constants of the composites, the frequency coefficient of dielectric constant (αf(k)) is introduced, which can be calculated using eqn (2):40
 | (2) |
As listed in Table 1, 6dBTF/CE/cPES composite has the smallest αf(k). That is, its dielectric constant has the optimal frequency stability. In addition, compared with composites in literature, 6dBTF/CE/cPES composites have excellent frequency stability (Table S1 in ESI†).
| Composite | Max(k) | Min(k) | α f(k) (%) |
|---|---|---|---|
| 0dBTF3/CE/cPES | 36.6 | 34.7 | 2.7 |
| 0dBTF4/CE/cPES | 60.9 | 57.4 | 3.0 |
| 0dBTF5/CE/cPES | 110.3 | 102.3 | 3.8 |
| 2dBTF3/CE/cPES | 34.6 | 30.2 | 6.8 |
| 2dBTF4/CE/cPES | 55.6 | 46.0 | 9.4 |
| 2dBTF5/CE/cPES | 106.5 | 80.4 | 14.0 |
| 6dBTF3/CE/cPES | 32.2 | 31.1 | 1.7 |
| 6dBTF4/CE/cPES | 55.9 | 53.5 | 2.2 |
| 6dBTF5/CE/cPES | 99.1 | 94.5 | 2.4 |
Similarly, ceramic loading and dopant content have important effects on the dielectric loss of composites. As shown in Fig. 7b, an increased loading of dBTF in the composites leads to increased dielectric loss; among dBTF/CE/cPES composites at the same loading of dBTF, 2dBTF/CE/cPES composites have the highest dielectric loss, while 6dBTF/CE/cPES composites have the lowest value (100 Hz, 0.006–0.008). Moreover, 6dBTF/CE/cPES composites have excellent frequency stability. Particularly, 6dBTF5/CE/cPES has a similar dielectric loss (0.008 at 100 Hz) as 6dBTFp5/CE/cPES (0.006 at 100 Hz), meaning that an adequate amount of KNN can significantly reduce the dielectric loss of the composite.
In conclusion, doping plays a significant role in the dielectric properties of the dBTF/CE/cPES composites. Among them, 6dBTF/CE/cPES composites show stable dielectric properties over the whole frequency range tested while exhibiting very low dielectric loss (0.006–0.008, 100 Hz). Compared with ceramic particles-filled polymer composites (6dBTFp/CE/cPES), 6dBTF/CE/cPES composites have a higher dielectric constant and an equivalently lower dielectric loss at the same ceramic loading.
In order to determine the origin of the huge difference of dielectric properties between the 6dBTF/CE/cPES and 6dBTFp/CE/cPES composites, AC conductivities of the two kinds of composites were tested. As shown in Fig. 8, the AC conductivity of each composite linearly increases as frequency increases, showing the typical characteristic of an insulator. Note that the 6dBTF/CE/cPES composite has a higher conductivity than the 6dBTFp/CE/cPES composite with the same ceramic loading, and this phenomenon is enhanced as the ceramic loading increases. The increase in conductivity is attributed to the accumulation of charge via conduction in the grain interior.41 The higher conductivity of the 6dBTF/CE/cPES composites means that the three-dimensional interconnecting skeleton maintains the integrity of grain and grain boundary, which is conducive to the accumulation of electric charge and the formation of a strong polarization intensity, so as to obtain a higher dielectric constant.
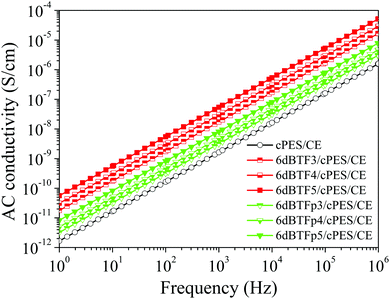 | ||
| Fig. 8 Frequency dependence of AC conductivity between the 6dBTF/CE/cPES composites and 6dBTFp/CE/cPES composite. | ||
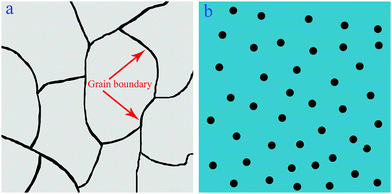
It is known that the high-k of dielectric ceramics originated from the grain and grain boundary in ceramics,41 as shown in Fig. 9a, while most existing high-k ceramic/polymer composites (Fig. 9b) require a high ceramic loading to obtain a high-k because the sintered ceramic is damaged and its grain boundary has reduced or because there is no grain boundary in the ceramic particles.42–44
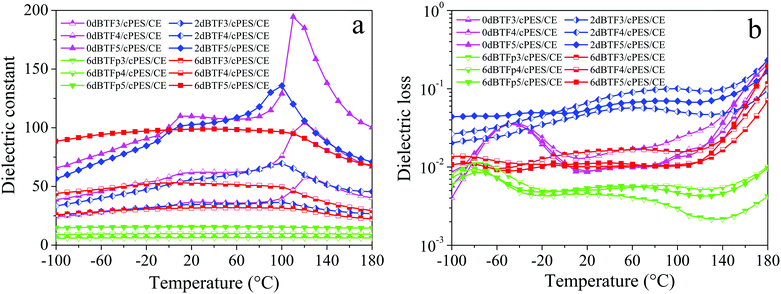 | ||
| Fig. 11 Frequency dependence of the dielectric constant (a) and loss (b) of dBTF/CE/cPES composites at 100 Hz under different temperatures. | ||
| Composite | Max′(k) | Min′(k) | Max′(tan![[thin space (1/6-em)]](https://www.rsc.org/images/entities/char_2009.gif) δ) δ) |
Min′(tan![[thin space (1/6-em)]](https://www.rsc.org/images/entities/char_2009.gif) δ) δ) |
α T(k) (%) |
α
T(tan![[thin space (1/6-em)]](https://www.rsc.org/images/entities/char_2009.gif) δ) (%) δ) (%) |
|---|---|---|---|---|---|---|
a Max′(k) and Min′(k) are the maximum and minimum dielectric constants, Max′(tan![[thin space (1/6-em)]](https://www.rsc.org/images/entities/char_2009.gif) δ) and Min′(tan δ) and Min′(tan![[thin space (1/6-em)]](https://www.rsc.org/images/entities/char_2009.gif) δ) reflect the maximum and minimum dielectric losses of composites from −100 to 110 °C, respectively. δ) reflect the maximum and minimum dielectric losses of composites from −100 to 110 °C, respectively.
|
||||||
| 0dBTF3/CE/cPES | 46.8 | 24.2 | 0.036 | 0.006 | 31.8 | 71.4 |
| 0dBTF4/CE/cPES | 96.2 | 38.8 | 0.036 | 0.004 | 42.5 | 80.0 |
| 0dBTF5/CE/cPES | 194.6 | 65.7 | 0.035 | 0.009 | 49.5 | 59.1 |
| 2dBTF3/CE/cPES | 36.4 | 25.3 | 0.057 | 0.020 | 18.0 | 48.1 |
| 2dBTF4/CE/cPES | 69.5 | 33.4 | 0.100 | 0.026 | 35.1 | 58.7 |
| 2dBTF5/CE/cPES | 135.8 | 56.5 | 0.070 | 0.044 | 41.2 | 22.8 |
| 6dBTF3/CE/cPES | 31.8 | 25.8 | 0.017 | 0.010 | 10.4 | 25.9 |
| 6dBTF4/CE/cPES | 53.2 | 44.0 | 0.014 | 0.010 | 9.5 | 16.7 |
| 6dBTF5/CE/cPES | 98.9 | 88.5 | 0.011 | 0.009 | 5.5 | 10.0 |
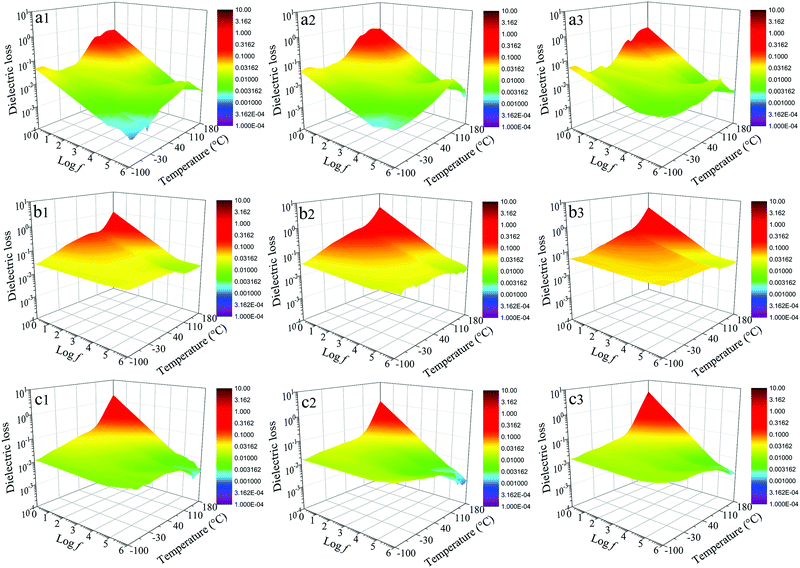
The dielectric losses of composites at different temperatures and frequencies are shown in Fig. 12. For the dBTF/CE/cPES composites, when the temperature changes from −100 to 110 °C, the temperature stability of dielectric loss improves as the dopant dosage increases; from −150 to 180 °C, the dielectric loss strongly depends on the temperature at low frequency (<103 Hz). At the same frequency, the dielectric loss of the 0dBTF/CE/cPES composite exhibits an unstable change with the increase of temperature (Fig. 12a1–a3), while 2dBTF/CE/cPES (Fig. 12b1–b3) and 6dBTF/CE/cPES (Fig. 12c1–c3) show excellent temperature stability upon dielectric loss from −100 to 110 °C as well as lower dielectric loss than 0dBTF/CE/cPES.
The temperature coefficients of dielectric losses at 100 Hz (αT(tan![[thin space (1/6-em)]](https://www.rsc.org/images/entities/char_2009.gif) δ)) of CE/cPES and the composites are summarized in Table 2. As shown in Fig. 11b, from −100 to 10 °C, the dielectric loss of the 0dBTF/CE/cPES composites initially increases and reaches a higher plateau at about −40 °C, followed by a decrease. The 2dBTF/CE/cPES and 6dBTF/CE/cPES composites exhibit outstanding temperature stability from −100 to 110 °C. Note that the 6dBTF/CE/cPES composites have the lowest αT(tan
δ)) of CE/cPES and the composites are summarized in Table 2. As shown in Fig. 11b, from −100 to 10 °C, the dielectric loss of the 0dBTF/CE/cPES composites initially increases and reaches a higher plateau at about −40 °C, followed by a decrease. The 2dBTF/CE/cPES and 6dBTF/CE/cPES composites exhibit outstanding temperature stability from −100 to 110 °C. Note that the 6dBTF/CE/cPES composites have the lowest αT(tan![[thin space (1/6-em)]](https://www.rsc.org/images/entities/char_2009.gif) δ) and lower dielectric losses; typically, the dielectric loss of 6dBTF5/CE/cPES is only about 20% of that of 2dBTF5/CE/cPES.
δ) and lower dielectric losses; typically, the dielectric loss of 6dBTF5/CE/cPES is only about 20% of that of 2dBTF5/CE/cPES.
3.4 Impedance analyses
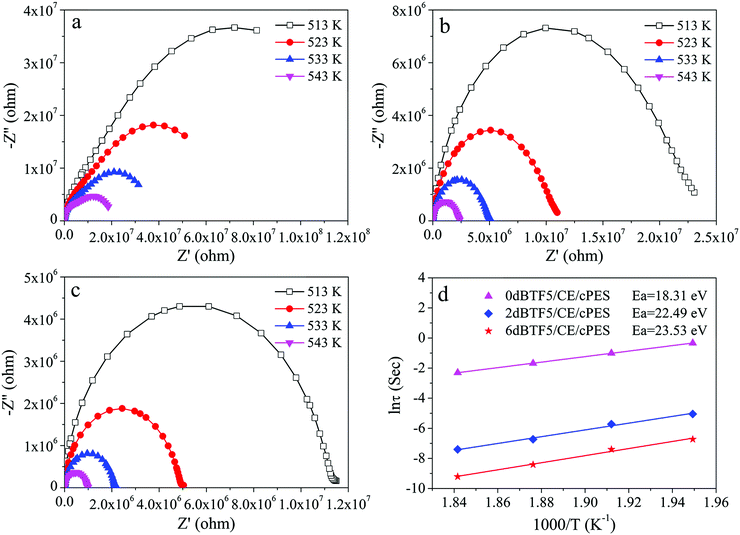
Impedance analyses were conducted to investigate the influence of dopant dosage in dBTF on the interface polarization of the dBTF/CE/cPES composites. The relationship between test temperature T and frequency is reflected by eqn (3): | (3) |
From the complex impedance spectra of the dBTF5/CE/cPES composites under different temperatures (Fig. 13a–c), the relationship curve between relaxation time and 1000/T is expressed as shown in Fig. 13d. The Ea values of the 0dBTF5/CE/cPES, 2dBTF5/CE/cPES and 6dBTF5/CE/cPES composites are 18.31, 22.49 and 23.53 eV, respectively, suggesting that Ea increases with increasing dopant dosage in dBTF. It should be noted that the ceramic particles become more homogeneous as the loading of KNN increases (Fig. 3); thus, the Ea values demonstrate that more uniform ceramic particles are beneficial towards reducing the accumulation of charge, and consequently, endowing composites with the better temperature stability of dielectric properties.
3.5 Breakdown strength
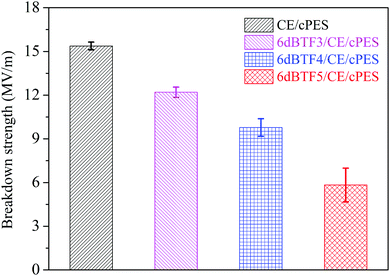
For energy storage application, the breakdown strength of the dielectric is an important property. Fig. 14 gives breakdown strength of the CE/cPES and 6dBTF/CE/cPES composites. It can be seen that the breakdown strength of the composites is closely related to the ceramic loading. The breakdown strength of CE/cPES is 15.38 MV m−1, while those of the 6dBTF3/CE/cPES, 6dBTF4/CE/cPES and 6dBTF5/CE/cPES composites are about 79.3%, 63.6% and 37.9% of that of CE/cPES, respectively. The decreasing phenomenon was also reported by Yu et al.,46 who found that the addition of a high loading of fillers (over 18 vol%) significantly decreased the breakdown strength, and when the filler loading was 33.0 vol%, the breakdown strength decreased to only about 7.1% of that of the origin resin. This could be attributed to the formation of clusters and defects during the preparing process of the composites.4. Conclusions
Starting from BT, Nb2O5, Na2CO3 and K2CO3, a new one-step polymer foam replication method was set up to prepare new foam ceramics with a three-dimensional interconnecting skeleton (dBTF), of which the skeleton is KNN doped BT. The crystalline form of dBTF transforms from the tetragonal phase into the cubic phase as the dopant content increases. The excellent temperature stability of the dielectric properties and high-k can be simultaneously achieved by doping and constructing a foam ceramic with a three-dimensional continuous skeleton. When the dBTF loading is 31.5 vol%, the 6dBTF/CE/cPES composites exhibit excellent dielectric properties over a wide temperature range from −100 to 110 °C. Notably, the dielectric constant of the 6dBTF5/CE/cPES composite is as high as 99.1 (100 Hz), about 6.3 and 24.8 times of those of 6dBTFp5/CE/cPES and CE/cPES, respectively, while the dielectric loss is only about 0.008 (100 Hz).Conflicts of interest
There are no conflicts to declare.Acknowledgements
This project is supported by the National Natural Science Foundation of China (51873135, 51473107), the Key Major Program of the Natural Science Fundamental Research Project of Jiangsu Colleges and Universities (18KJA430013), the Scientific Innovation Research of College Graduate in Jiangsu Province of China (KYLX15_1232) and the Priority Academic Program Development of Jiangsu Higher Education Institution (PAPD).References
- Prateek, V. K. Thakur and R. K. Gupta, Chem. Rev., 2016, 116, 4260–4317 CrossRef CAS PubMed.
- K. Zhu, Y. Wang, J. A. Tang, S. Guo, Z. Gao, Y. Wei, G. Chen and Y. Gao, Mater. Chem. Front., 2017, 1, 958–966 RSC.
- P. Zhang, J. He, Z. K. Cui, X. Li, X. Liu, S. Zhang, Q. Zhuang and Z. Han, Polymer, 2015, 65, 262–269 CrossRef CAS.
- X. B. Zhang, L. Yuan, Q. B. Guan, G. Z. Liang and A. J. Gu, J. Mater. Chem. A, 2017, 5, 21909–21918 RSC.
- N. Sun, Y. Li, Q. Zhang and X. Hao, J. Mater. Chem. C, 2018, 6, 10693–10703 RSC.
- J. Wang, Y. Li, N. Sun, J. Du, Q. Zhang and X. Hao, J. Eur. Ceram. Soc., 2019, 39, 255–263 CrossRef CAS.
- Z. M. Dang, J. K. Yuan, J. W. Zha, T. Zhou, S. T. Li and G. H. Hu, Prog. Mater. Sci., 2012, 57, 660–723 CrossRef CAS.
- X. Y. Huang and P. K. Jiang, Adv. Mater., 2015, 27, 546–554 CrossRef CAS PubMed.
- D. He, Y. Wang, X. Chen and Y. Deng, Composites, Part A, 2017, 93, 137–143 CrossRef CAS.
- W. Xu, G. Yang, L. Jin, J. Liu, Y. Zhang, Z. Zhang and Z. Jiang, ACS Appl. Mater. Interfaces, 2018, 10, 11233–11241 CrossRef CAS PubMed.
- P. T. T. Mai, C. N. Chau, L. V. Boi, N. X. Hoan, I. Martin and P. Carriere, Composites, Part A, 2016, 90, 528–535 CrossRef.
- Z. M. Dang, H. Y. Wang, Y. H. Zhang and J. Q. Qi, Macromol. Rapid Commun., 2005, 26, 1185–1189 CrossRef CAS.
- Y. N. Hao, X. H. Wang, S. O'Brien, J. Lombardi and L. T. Li, J. Mater. Chem. C, 2015, 3, 9740–9747 RSC.
- R. Manna and S. K. Srivastava, Mater. Chem. Front., 2017, 1, 780–788 RSC.
- L. H. Zheng, G. Z. Liang, A. J. Gu, L. Yuan and Q. B. Guan, J. Mater. Chem. C, 2016, 4, 10654–10663 RSC.
- L. H. Zheng, L. Yuan, Q. B. Guan, G. Z. Liang and A. J. Gu, Appl. Surf. Sci., 2018, 427, 1046–1054 CrossRef CAS.
- N. Bao, L. Shen, G. Srinivasan, K. Yanagisawa and A. Gupta, J. Phys. Chem. C, 2008, 112, 8634–8642 CrossRef CAS.
- S. Marković, M. Mitrić, N. Cvjetićanin and D. Uskoković, J. Eur. Ceram. Soc., 2007, 27, 505–509 CrossRef.
- B. Li, S. Zhang, X. Zhou, S. Wang and Z. Chen, J. Mater. Sci., 2006, 42, 2090–2096 CrossRef.
- S. Sharma, M. M. Singh and K. D. Mandal, Mater. Chem. Front., 2017, 1, 1165–1178 RSC.
- Q. Li, L. Chen, M. R. Gadinski, S. Zhang, G. Zhang, H. Li, A. Haque, L. Q. Chen, T. Jackson and Q. Wang, Nature, 2015, 523, 576–579 CrossRef CAS PubMed.
- R. Ma, V. Sharma, A. F. Baldwin, M. Tefferi, I. Offenbach, M. Cakmak, R. Weiss, Y. Cao, R. Ramprasad and G. A. Sotzing, J. Mater. Chem. A, 2015, 3, 14845–14852 RSC.
- D. Maurya, F. C. Sun, S. Pamir Alpay and S. Priya, Sci. Rep., 2015, 5, 15144 CrossRef CAS PubMed.
- P. Meng, Q. Zhang, Y. L. Wu, Z. Y. Tan, G. A. Cheng, X. L. Wu and R. T. Zheng, Adv. Funct. Mater., 2017, 27, 1701136 CrossRef.
- G. Chen, X. Wang, J. Lin, W. Yang, D. Li, W. Ding and H. Li, J. Phys. Chem. C, 2017, 121, 15028–15035 CrossRef CAS.
- Q. Sun, Q. Gu, K. Zhu, R. Jin, J. Liu, J. Wang and J. Qiu, Sci. Rep., 2017, 7, 42274 CrossRef CAS PubMed.
- J. S. Dean, P. Y. Foeller, I. M. Reaney and D. C. Sinclair, J. Mater. Chem. A, 2016, 4, 6896–6901 RSC.
- J. H. Gao, Y. B. Liu, Y. Wang, X. H. Hu, W. B. Yan, X. Q. Ke, L. S. Zhong, Y. T. He and X. B. Ren, J. Phys. Chem. C, 2017, 121, 13106–13113 CrossRef CAS.
- M. A. Rafiq, M. E. Costa and P. M. Vilarinho, ACS Appl. Mater. Interfaces, 2016, 8, 33755–33764 CrossRef CAS PubMed.
- C. W. Ahn, C. H. Choi, H. Y. Park, S. Nahm and S. Priya, J. Mater. Sci., 2008, 43, 6784–6797 CrossRef CAS.
- C. H. Choi, C. W. Ahn, S. Nahm, J. O. Hong and J. S. Lee, Appl. Phys. Lett., 2007, 90, 132905 CrossRef.
- J. Gu, W. Dong, S. Xu, Y. Tang, L. Ye and J. Kong, Compos. Sci. Technol., 2017, 144, 185–192 CrossRef CAS.
- Y. Tang, W. Dong, L. Tang, Y. Zhang, J. Kong and J. Gu, Compos. Commun., 2018, 8, 36–41 CrossRef.
- J. Gu, S. Xu, Q. Zhuang, Y. Tang and J. Kong, IEEE Trans. Dielectr. Electr. Insul., 2017, 24, 784–790 CAS.
- C. Wang, H. Chen, X. Zhu, Z. Xiao, K. Zhang and X. Zhang, Mater. Sci. Eng., C, 2017, 70, 1192–1199 CrossRef CAS PubMed.
- P. Jana, E. Zera and G. D. Sorarù, Mater. Des., 2017, 116, 278–286 CrossRef CAS.
- M. S. Alkathy, R. Gayam and K. C. J. Raju, Ceram. Int., 2016, 42, 15432–15441 CrossRef CAS.
- A. Loganathan, D. Manoharan and V. J. Nesamony, Mater. Lett., 2017, 186, 305–307 CrossRef CAS.
- J. Mao, L. Cao, Z. Xiong, X. Wang, J. Zhou, Y. Li and W. Wu, J. Alloys Compd., 2017, 721, 638–645 CrossRef CAS.
- L. Zhang, P. Wu, Y. Li, Z. Y. Cheng and J. C. Brewer, Composites, Part B, 2014, 56, 284–289 CrossRef CAS.
- Y. H. Lin, M. Li, C. W. Nan, J. Li, J. Wu and J. He, Appl. Phys. Lett., 2006, 89, 032907 CrossRef.
- D. H. Kuo, C. C. Chang, T. Y. Su, W. K. Wang and B. Y. Lin, Mater. Chem. Phys., 2004, 85, 201–206 CrossRef CAS.
- Z. M. Dang, T. Zhou, S. H. Yao, J. K. Yuan, J. W. Zha, H. T. Song, J. Y. Li, Q. Chen, W. T. Yang and J. Bai, Adv. Mater., 2009, 21, 2077–2082 CrossRef CAS.
- Y. Niu, Y. Bai, K. Yu, Y. Wang, F. Xiang and H. Wang, ACS Appl. Mater. Interfaces, 2015, 7, 24168–24176 CrossRef CAS PubMed.
- N. Horchidan, A. C. Ianculescu, L. P. Curecheriu, F. Tudorache, V. Musteata, S. Stoleriu, N. Dragan, D. Crisan, S. Tascu and L. Mitoseriu, J. Alloys Compd., 2011, 509, 4731–4737 CrossRef CAS.
- S. Luo, S. Yu, R. Sun and C. P. Wong, ACS Appl. Mater. Interfaces, 2014, 6, 176–182 CrossRef CAS PubMed.
Footnote |
| † Electronic supplementary information (ESI) available: Fig. S1 shows frequency dependence of dielectric constant (a) and loss (b) at room temperature for BT at different sintered temperatures. Fig. S2 gives SEM images of 0dBTF5 prepared from BaCO3 and TiO2. Table S1 summarizes frequency coefficients of ceramic/polymer composites in literature. See DOI: 10.1039/c9qm00006b |
| This journal is © the Partner Organisations 2019 |

