 Open Access Article
Metabolomics study of the therapeutic mechanism of a Chinese herbal formula on collagen-induced arthritis mice†
Zhen Jina,
Ji-da Zhangb,
Xin Wu *c and
Gang Cao*c
aThe First Affiliated Hospital, Wenzhou Medical University, Wenzhou, China
bCollege of Basic Medical Science, Zhejiang Chinese Medical University, Hangzhou, China
cSchool of Pharmacy, Zhejiang Chinese Medical University, Hangzhou, China. E-mail: wuhsin@qq.com; caogang33@163.com
First published on 28th January 2019
Abstract
Wenjinghuoluo (WJHL) prescription, the typical rheumatoid arthritis (RA) treatment compound in traditional Chinese medicine, shows favorable efficacy. The precise mechanism of WJHL on RA therapy is yet to be elucidated. This study aimed to determine the metabolic biomarkers in the early onset of RA and evaluate the regulation effect of WJHL on metabolite levels. Multivariate statistical analysis identified 93 biomarkers by precise MS/MS. These biomarkers played an important role in the regulation of key metabolic pathways associated with collagen-induced arthritis (CIA). A total of 68 biomarkers were related to the treatment of CIA by WJHL therapy. In addition, pathway analysis results showed six and three significant related pathways according to corresponding differential metabolites before and after WJHL therapy. Finally, disease and function prediction of ingenuity pathway analysis indicated that lipid metabolism, small molecule biochemistry, and carbohydrate metabolism were associated functions of WJHL therapy on CIA. Furthermore, top analysis-ready molecules of up-regulated thiamine and down-regulated arachidonic acid maybe the most related metabolites of WJHL therapy on CIA. The present work indicates that a metabolomics platform provides a new insight into understanding the mechanisms of action of natural medicines, such as WJHL.
Introduction
Metabonomics is a powerful new omics that can be used to reveal global metabolic profiles in order to distinguish between diseased and nondiseased status; genomics, transcriptome, and proteomics are also new omics.1–3 Research on gene, mRNA, and protein is often influenced by many factors, such as environment, diet, and age.4 Accordingly, the results produced by the corresponding omics do not necessarily occur, which leads to further uncertainty.5 However, the production and metabolism of small molecular metabolites are the final results of the above series of omics events.6,7 In addition, various changes triggered by genomics, transcriptome, and proteomics will be amplified at the metabolic level, which results in sensitive detection of metabolites.8 Furthermore, the structure and function of metabolites are clear, and the quantity is few; thus, explaining the change in pathogenesis is easy.9 Therefore, identification of critical biomarkers for disease aggressiveness is helpful for early clinical diagnosis.10Rheumatoid arthritis (RA) is a common autoimmune disease in clinic, which is closely related to the environment, cells, viruses, heredity, sex hormones, and the nervous state; its main characteristic is the chronic periosteal inflammation and cartilage destruction.11–13 The pathogenesis of RA is a complex multifactorial pathological process, which leads to the pathological changes of organs and tissues and causes the changes in metabolites in vivo.14,15 Previous research on the pharmacodynamics of RA had been reported largely, which selected relevant pharmacological models and in vitro organ experiments to observe the changes in physiological function, biochemical index, and histomorphology.16–20 Nevertheless, mechanism changes in RA and endogenous biomarkers in early diagnosis are rarely reported. Thus, the introduction of metabonomics technology can be used to study the changes in metabolic network of the body and identify differential metabolites between diseased and nondiseased status. Moreover, we could trace the metabolic pathway to protein or gene level for subsequent systematic evaluation and the association of metabonomics, genomics, transcriptome, and proteomics. Finally, we can provide basis for determining the target of drug action.
Wenjinghuoluo (WJHL) prescription contains Cinnamomum cassia Presl., Paeonia lactiflora Pall., Saposhnikovia divaricate (Turcz.) Schischk., and Clematis chinensis Osbeck; this prescription is the traditional Chinese medicine treatment of RA characterized by monarch, minister, adjuvant, and assistant drugs.21 According to traditional Chinese medicine theory, the classical prescription includes four elements: the monarch drug (which plays a major therapeutic role), the minister drug (which strengthens the treatment of the main disease and the main symptom), the adjuvant drug (which reduces adverse reactions and enhances efficacy of the whole prescription), and the assistant drug (which guides the drugs directly to target positions).22,23 All drugs in WJHL interact with one another to achieve the desired integrated therapeutic effect, which is commonly attributed to its synergistic effects of multiple components and targets. Similarly, the systematic thinking of metabonomics is consistent with the holistic, dynamic, and dialectical views of traditional Chinese medicine theory, which has been given considerable attention in the research of traditional Chinese herbal prescription.24 In the present paper, we utilized the UHPLC-Orbitrap-MS technology to detect the difference in plasma metabolic fingerprint between collagen-induced arthritis (CIA) model and normal mice due to the advantages of its high resolution, high accuracy, high ion abundance, and large trapping capacity.25–27 We also identified the potential metabolic biomarkers for early diagnosis in CIA mice and analyzed the effect of WJHL on plasma metabolic biomarkers in CIA mice to reveal the specific regulatory biomarkers of its therapeutic effects through ingenuity pathway analysis (IPA). Furthermore, we investigated the changes in metabolic biomarkers and metabolic pathways in the development and progression of RA and the molecular mechanism of WJHL in the treatment of RA.
Experiments
Chemicals and reagents
HPLC-grade methanol and acetonitrile were obtained from Merck (Darmstadt, Germany). MS-grade formic acid was obtained from Honeywell Company (Morristown, New Jersey). Water was produced by a Milli-Q Ultrapure water system (Millipore, Billerica, MA).Induction of CIA model and drug administration
A total of 24 healthy and clean male DBA/1 mice (18–20 g) were provided by the Laboratory Animal Research Center, Zhejiang Chinese Medical University. Six DBA/1 mice were randomly selected as the control group. CIA mice were randomly divided into CIA, leflunomide, and high-dose WJHL groups, with six mice in each group. A certain amount of collagen type II (CII) was dissolved in acetic acid (0.1 M) at a concentration of 2 mg mL−1. The mixture of CII and incomplete Freund's adjuvant was emulsified in 1![[thin space (1/6-em)]](https://www.rsc.org/images/entities/char_2009.gif) :
:![[thin space (1/6-em)]](https://www.rsc.org/images/entities/char_2009.gif) 1 in an ice water bath to prepare a CII emulsion (i.e., a CII concentration of 1 mg mL−1) and stored in a refrigerator at 4 °C. Each mouse was injected with 0.1 mL of CII emulsion at the end of the tail, and another 0.1 mL was injected at the end of the tail on the 7th day to construct the CIA model. On the 30th day of primary immunization, the WJHL group was given WJHL decoction for 5.00 g kg−1. The leflunomide group was given leflunomide (6 mg kg−1 d−1), and the control and CIA groups were given 0.2 mL/10 g saline per day. All experimental protocols and animal handling procedures were performed in accordance with the NIH guidelines for the care and use of laboratory animals (NIH Publication No. 85–23 Rev. 1985) and approved by the Institute of Comparative Medicine & Experimental Animal Research Center at Zhejiang Chinese Medical University. The animal gave written informed consent for the use in studies reviewed and approved by the Institute of Comparative Medicine & Experimental Animal Research Center at Zhejiang Chinese Medical University (Hangzhou, China).
1 in an ice water bath to prepare a CII emulsion (i.e., a CII concentration of 1 mg mL−1) and stored in a refrigerator at 4 °C. Each mouse was injected with 0.1 mL of CII emulsion at the end of the tail, and another 0.1 mL was injected at the end of the tail on the 7th day to construct the CIA model. On the 30th day of primary immunization, the WJHL group was given WJHL decoction for 5.00 g kg−1. The leflunomide group was given leflunomide (6 mg kg−1 d−1), and the control and CIA groups were given 0.2 mL/10 g saline per day. All experimental protocols and animal handling procedures were performed in accordance with the NIH guidelines for the care and use of laboratory animals (NIH Publication No. 85–23 Rev. 1985) and approved by the Institute of Comparative Medicine & Experimental Animal Research Center at Zhejiang Chinese Medical University. The animal gave written informed consent for the use in studies reviewed and approved by the Institute of Comparative Medicine & Experimental Animal Research Center at Zhejiang Chinese Medical University (Hangzhou, China).
Sample collection and preparation
Plasma samples were collected from the orbit of CIA mice on day 30 and 69 and isolated by centrifugation at 3000 rpm for 10 min frozen at −80 °C before use. The plasma of each group was added with three times the amount of methanol to precipitate the protein and subsequently centrifuged at 12![[thin space (1/6-em)]](https://www.rsc.org/images/entities/char_2009.gif) 000 rpm for 10 min at 4 °C to remove any protein. Fractions (100 μL) of the plasma supernatants were stored at −80 °C until UHPLC-Orbitrap-MS analysis. Thawed plasma samples were filtered through a microporous membrane (0.22 μm), and 4 μL of the supernatant were injected into the UHPLC-Orbitrap-MS.
000 rpm for 10 min at 4 °C to remove any protein. Fractions (100 μL) of the plasma supernatants were stored at −80 °C until UHPLC-Orbitrap-MS analysis. Thawed plasma samples were filtered through a microporous membrane (0.22 μm), and 4 μL of the supernatant were injected into the UHPLC-Orbitrap-MS.
UHPLC-Orbitrap-MS conditions
Metabolic profiling of plasma was conducted on a Thermo Ultimate 3000 UHPLC system coupled to an Orbitrap Elite mass spectrometry. Plasma chromatographic separation was performed on a Hypergod C18 column (3.0 μm, 4.6 × 100 mm, Thermo) maintained at 40 °C. The flow rate was 0.3 mL min−1, and the mobile phase was water with 0.1% formic acid (A) and acetonitrile with 0.1% formic acid (B). The gradient elution programs for plasma are shown in Table S5.† The sample injection volume was 4 μL at 4 °C. The parameters of mass detection were as follows: heater temperature, 300 °C; sheath gas flow rate, 45 arb; aux gas flow rate, 15 arb; sweep gas flow rate, 1 arb; capillary temperature, 350 °C; spray voltage, 3.0 kV in positive ion mode (ESI+) and 3.2 kV in negative ion mode (ESI−); and s-lens rf level, 30% and 60% in ESI+ and ESI−, respectively.Data preprocessing and multivariate data analyses
All raw data were imported into the Thermo Scientific SIEVE software for preprocessing to generate the results of retention time, mass-to-charge ratio, and response intensity. In addition, data preprocessing was the core procedure, which consisted of noise reduction, peak area normalization, and peak picking before multivariate analyses. Furthermore, PCA and PLS-DA in software SIMCA-P (Ver 11.0, Umetrics, Umea, Sweden) were used for multivariate analysis. On the basis of these analyses, the variable importance in projection was selected as the standard for screening.Identification of biomarkers
Compounds were quantified with commercial databases using precise MS/MS fragments. Objectively and strictly matching analysis was used with the automatic identification system of the SIEVE and Mass Frontier software based on the above protocols. The qualitative methods of discrepant metabolites are shown as follows. First, online Metlin databases (comparing m/z or considerably accurate molecular mass) were searched. Second, fold change and the log value of average value ratio between Z (control group, Z)/F (WJHL group, F) and M (CIA group, M) group ((Z/F)/M) were calculated. Finally, +/− represent the increase/decrease in Z/F group compared with that in M group, respectively (*P < 0.05, **P < 0.01, and ***P < 0.001). Furthermore, consulting databases, such as HMDB, METLIN, Chemspider, and KEGG, were used to determine the related biochemical metabolic pathways of identified differential biomarkers.Statistical analysis
SPSS software (Version 23.0 for windows, IBM, Chicago, IL) was used for statistical analysis of the ions among the control, CIA, leflunomide, and WJHL groups. The ion contents among groups were compared to determine the difference. P values less than 0.05 were considered significant. Combined VIP lists of PLS-DA and the P value of one-way ANOVAs of a series of biomarkers showed differences in metabolites.Results
Method validation
For plasma sample, six extracted ions (with the retention time of m/z 2.03–166.09, 8.11–518.32, and 8.32–545.34 in positive ion mode and 0.84–608.74, 0.85–542.75, and 5.91–368.98 in negative ion mode) were selected for method validation. The RSDs of retention time for repeatability and system precision were 0.05–0.79% and 0.03–1.35% in positive ion mode and 0.31–1.26% and 0.05–1.17% in negative ion mode. The RSDs of peak area were within the range of 5.12–8.41% and 5.61–8.84% in positive ion mode and 7.29–8.55% and 5.81–7.24% in negative ion mode. Results indicated that the stability and precision of the proposed method were satisfactory for metabolomic analysis.Plasma metabonomic study on CIA mice
Plasma metabolic profiling was established to explore important biomarkers and metabolic pathways related with CIA and develop a prediction model for aided diagnosis of the disease. The representative UHPLC-Orbitrap-MS ion current chromatograms (ICCs) from positive and negative ion modes of plasma among control group (Z), CIA group (M), leflunomide group (L), and WJHL group (F) were compared visually in Fig. 1 and 2. The ICC reflected the significant difference in the UHPLC-Orbitrap-MS analysis of the plasma metabolomic in terms of peak number and peak response intensity. On day 30, we compared the CIA group to the control group to identify early biomarkers in CIA mice (P < 0.05). On day 69, we compared leflunomide and WJHL groups with CIA group for their therapeutic effect in CIA mice (P < 0.05). Low-molecular mass metabolites could be well separated for only 15 min because of the small particles (less than 3.0 μm) of UHPLC. The optimized UHPLC-Orbitrap-MS analysis protocol and subsequent processes, such as baseline correction, peak deconvolution, alignment, and normalization, were used to obtain a 3D matrix, including data file name, retention time–exact mass pair, and response intensity. Overall, 93 retention time–exact mass pairs were determined in CIA group compared with the control group on day 30. On day 69, 68 regulated metabolites were determined in WJHL group compared with the CIA group in positive and negative-ion modes.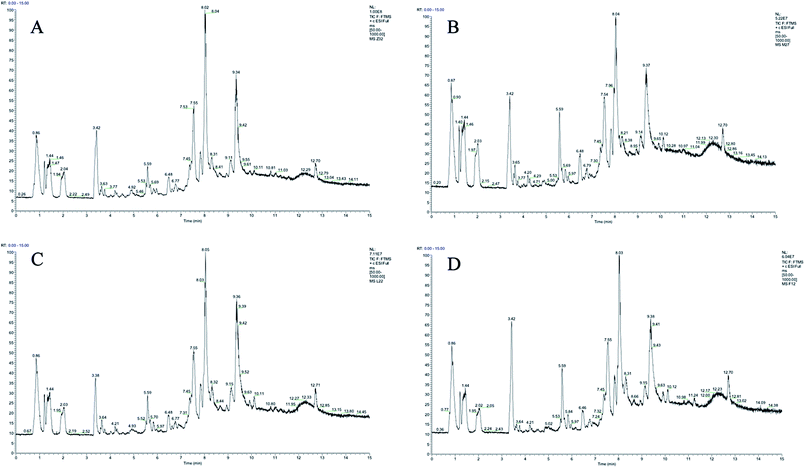 | ||
| Fig. 1 UHPLC-Orbitrap-MS plasma ion current chromatograms in positive ion modes. (A) Control group, (B) CIA group, (C) leflunomide group, and (D) WJHL group. | ||
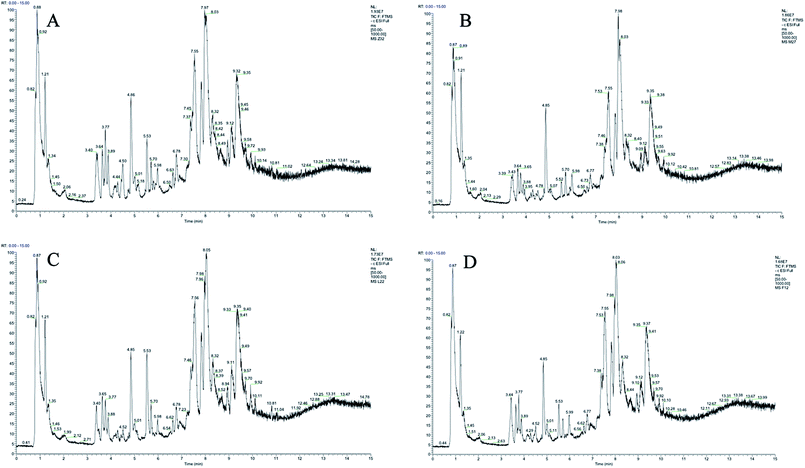 | ||
| Fig. 2 UHPLC-Orbitrap-MS plasma ion current chromatograms in negative ion modes. (A) Control group, (B) CIA group, (C) leflunomide group, and (D) WJHL group. | ||
Metabolic pattern analysis
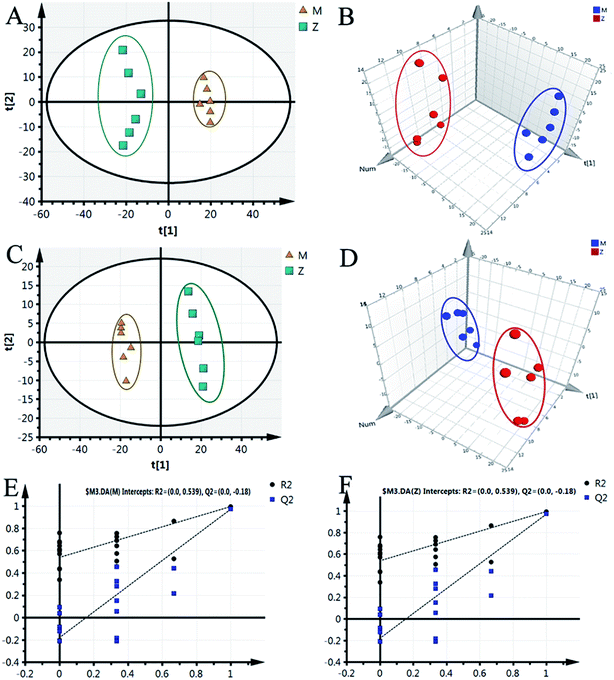
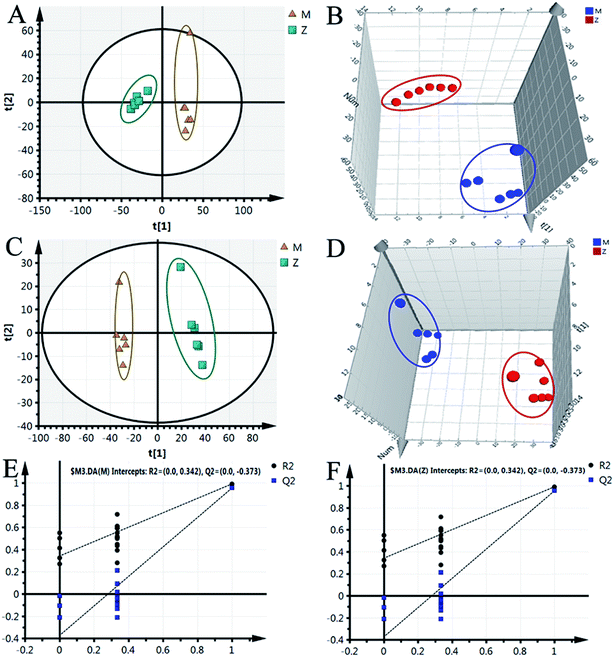
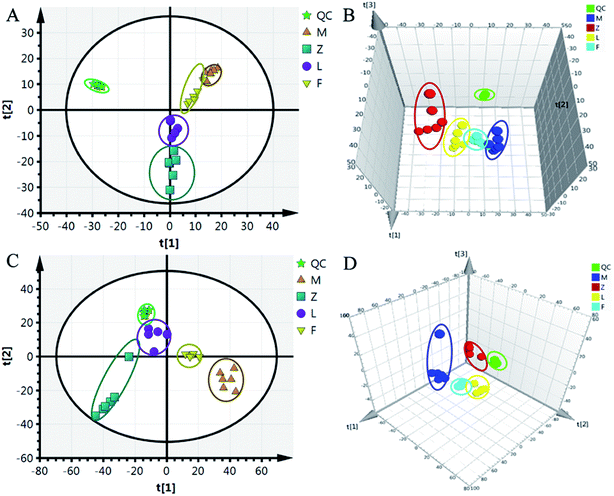
Although some differences could be visually noted among the three sets of the details illustrated in ICC, many other visual changes could be observed using a pattern recognition approach, such as principal component analysis (PCA), partial least-squares discriminant analysis (PLS-DA), and heatmap. Typically, the metabolic profiles of disease cases and controls are compared to identify spectral features, ultimately metabolites, which discriminate the classes. PCA was used first to investigate the general interrelation between groups, including clustering and outliers among the samples. The CIA mice model was established successfully on 30th day, as identified by inflammatory markers, animal spirits, and other indicators, as previously reported by our team.21 Therefore, we selected the 30th day plasma samples to analyze the early pathogenesis of CIA by PCA method. Furthermore, experimental results revealed that the CIA mice showed remarkable curative effect on the 69th day, which was close to the control group.21 Hence, we selected 69th day plasma samples to analyze the effect of WJHL for the treatment of CIA by PCA method. On the 30th day, two principal components were obtained in the positive mode (R2X = 0.668 and Q2 = 0.441); two principal components were also obtained in the negative mode (R2X = 0.72, Q2 = 0.392) from the PCA score graph between the control and CIA groups (Fig. 3A and 4A). PLS-DA, a supervised multivariate statistical method, can improve biomarker discovery efforts and separate samples into two blocks to obtain improved discrimination between the control and CIA groups (Fig. 3C and 4C). Trajectory analysis of score plots (3D) for control and CIA groups showed clear segregation (Fig. 3B, D, 4B and D). The quality of the established PLS-DA model was well. The model quality parameters revealed two main components both in the positive ion mode (R2X = 0.596, R2Y = 0.996, and Q2 = 0.972) and negative ion mode (R2X = 0.651, R2Y = 0.992, and Q2 = 0.956). Testing model verification from PLS-DA between control and CIA groups was established (Fig. 3E, F, 4E and F). On 69th day, PCA score plots showed the effect of cluster separation of plasma samples among control, CIA, leflunomide, and WJHL groups by PCA analysis in positive and negative ion modes (Fig. 5A and C); this result suggested that plasma biochemical perturbation significantly occurred in leflunomide and WJHL groups. Trajectory analysis of score plots (3D) among control, CIA, leflunomide, and WJHL groups showed clear segregation in positive and negative ion modes (Fig. 5B and D). According to the corresponding loading plots of PLS-DA analysis, the ions farthest from the origin contributed significantly to the separation among control, CIA, and WJHL groups; therefore, these ions may be regarded as the differentiating metabolites for CIA and WJHL groups (Fig. S1A, S1D, S2A and S2D†). According to the combined results of S and variable importance in the projection (VIP) plots from the PLS-DA analysis (Fig. S1B, S1E, S1C, S1F, S2B, S2E, S2C and S2F†), the UHPLC-Orbitrap-MS analysis platform provided the retention time, precise molecular mass, and MS/MS data for the structural identification of biomarkers.Biomarker identification and metabolic pathway analysis
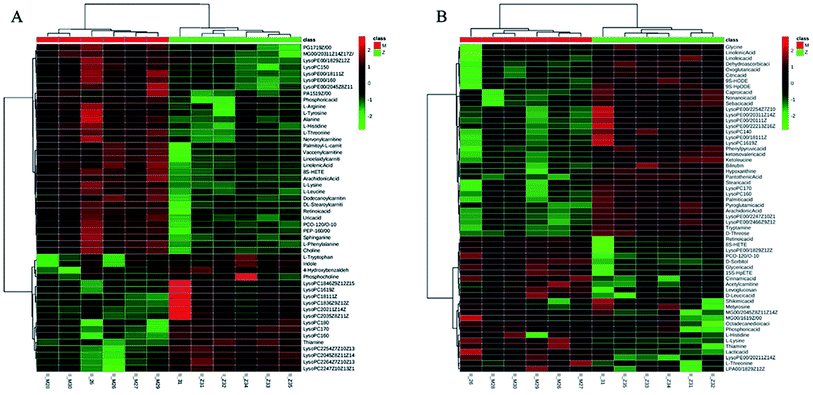
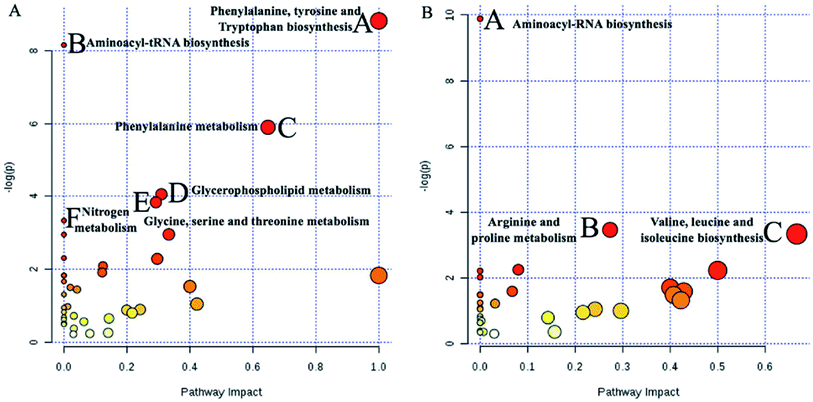
To identify the metabolites altering the plasma metabolic profile of CIA mice, this study used the VIP (threshold value, >1) of PLS-DA model, t-test (P < 0.05), and fold change value to determine differentially expressed metabolites. On the 30th day, a total of 50 and 58 differential metabolites with 15 mutual substances were recognized in positive and negative ion modes of the early CIA mice model, respectively. A total of 32 and 18 of 50 differential metabolites in positive ion mode were upregulated and downregulated compared with that in the control group, respectively. Moreover, 24 and 34 of the 58 differential metabolites in negative ion mode were upregulated and downregulated compared with that in the control group, respectively. The difference between these metabolic markers compared with the normal group is due to the increased or decreased biological marker content. To determine their abnormal level, hierarchical clustering analysis (Cluster 3, Stanford, University) was used to show the differential metabolites combined with heat map (Fig. 6A and B). On the 69th day, 34 and 41 differential metabolites with seven mutual substances were regulated in positive and negative ion modes after the treatment of WJHL. Precisely, 15 and 19 of the 34 differential metabolites in positive ion mode were upregulated and downregulated compared with that in CIA group, respectively. Moreover, 21 and 20 of the 41 differential metabolites in negative ion mode were upregulated and downregulated compared with that in CIA group, respectively. On the basis of the possible chemical bond breaking and the comprehensive information from HMDB, METIN, ChemSpider, and KEGG, the final identification was accurate. Early differential biomarkers identified in the plasma of CIA group on the 30th day and the differential regulated biomarkers in WJHL treatment group on the 69th day are listed in Tables S1 and S2.† In addition, plasma metabolomics data (30th day in CIA group) of overall 93 biomarkers screened by UHPLC-Orbitrap-MS in positive and negative ion modes were introduced into MetaboAnalyst 3.0 for metabolic pathway analysis. Results of 39 pathway analyses are provided in Table S3.† Furthermore, considering the results of raw P, we evaluated the importance of the metabolic pathway related to CIA. Finally, six most significant metabolic pathways were obtained on the basis of the results of P < 0.05 data analysis (Fig. 7A). These low-molecular weight metabolites were involved in multiple pathways and reactions, namely, phenylalanine, tyrosine, and tryptophan biosyntheses (L-phenylalanine, L-tyrosine, and phenylpyruvic acid); aminoacyl-tRNA biosynthesis (glycine, L-lysine, L-arginine, L-tryptophan, L-phenylalanine, L-tyrosine, L-leucine, L-histidine, and L-threonine); phenylalanine metabolism (L-phenylalanine, L-tyrosine, and phenylpyruvic acid); glycerophospholipid metabolism (LysoPC(17:0), LysoPC(18:0), LysoPC(16:0), LysoPC(20:3(5Z,8Z,11Z)), LysoPC(22:6(4Z,7Z,10Z,13Z,16Z,19Z)), LysoPC(22:5(4Z,7Z,10Z,13Z,16Z)), and LysoPC(20:2(11Z,14Z))); glycine, serine, and threonine metabolism (glycine, choline, L-threonine and glyceric acid); and nitrogen metabolism (glycine and L-histidine). These metabolites showed a high correlation with corresponding metabolic pathway, thereby suggesting a strong mechanistic role in the early diagnosis of CIA disease. The above results on 68 regulated differential metabolites also reflected the effectiveness of Chinese herbal compound WJHL in the treatment of CIA on the 69th day by the established CIA mice model. Metabolic pathway analysis revealed 32 therapeutic intervention pathway analyses, as listed in Table S4.† We selected the metabolic pathway (P < 0.05) as the therapeutic intervention metabolic pathway associated with CIA based on these 68 biomarkers that can be regulated by WJHL. Ultimately, the results in Fig. 7B showed three most significant therapeutic intervention metabolic pathways, namely, aminoacyl-tRNA biosynthesis (L-lysine, L-arginine, L-phenylalanine, L-leucine, and L-histidine); arginine and proline metabolisms (L-arginine, omithine, and citrulline); and valine, leucine, and isoleucine biosyntheses (L-leucine), which were related to the regulated metabolic biomarkers of the WJHL group.Network of identified biomarkers and their functions in IPA
IPA is an integrated biological pathway analysis software based on cloud computing. With the support of highly structured biological information platform of Ingenuity Knowledge Base, all kinds of information concerning gene, protein, and drugs can be searched, and the interaction model among them can be constructed. In addition, the experimental data of metabolic group, genome, and protein group can be analyzed to predict diseases and functions. Therefore, the network of differentiated plasma metabolite between CIA and WJHL groups was constructed by IPA to enhance our understanding of the most relevant and potential candidate biomarkers and canonical pathways (CPs) of medication associated with CIA. In this path designer network (Fig. 8), the upregulated thiamine (red mark) and downregulated arachidonic acid (green mark) were observed. Five top CPs, which were relevant to CIA disease treated by WJHL, were identified. Furthermore, the representative significant CPs are illustrated in Fig. S3† by Fisher's exact test (P < 0.05). As shown in the interactive diagram of CP, 11 CPs were involved with 35 chemicals (11-hydroxyeicosatetraenoic acid, 12-hydroxyeicosatetraenoic acid, 15-hydroxyeicosatetraenoic acid, ACE, ACHE, ADRA2A, AKR1B1, arachidonic acid, CD209, CES1, CNR2, CYBA, D-glucose, DGAT1, Dgk, ELOVL5, ELOVL6, ENaC, FABP2, FABP3, FADS1, GIPR, KISS1R, Na+, K+-ATPase, NTS, palmitoleic acid, PKLR, PNPLA8, PON1, pyruvate kinase, SLC1A3, sorbitol, thiamine, THRSP, and TKT), and two (thiamine and arachidonic acid) out of these CPs were mainly associated with CIA treated by WJHL. Moreover, lipid metabolism, small molecule biochemistry, and carbohydrate metabolism were presumed to be related with the treatment of CIA with WJHL from IPA predictive analysis of disease and function. In general, multitargets and multipathways were included in the WJHL therapy in RA, and representative metabolites, such as thiamine and arachidonic acid, maybe the targeting regulatory molecular biomarkers. MIF (macrophage migration inhibitory factor, MIF)-mediated glucocorticoid regulation, MIF regulation of innate immunity, role of MAPK (mitogen-activated protein kinase, MAPK) signaling in the pathogenesis of influenza, anandamide degradation, and thiamin salvage III could be the major interfering signaling pathways.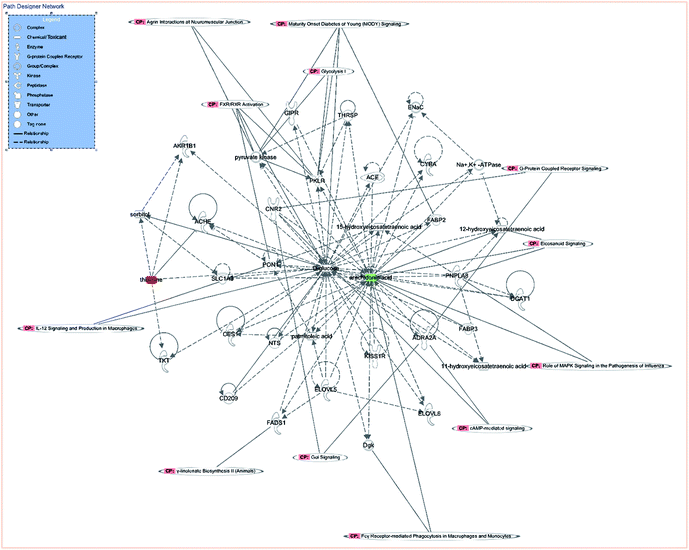 | ||
| Fig. 8 Path designer network analysed by IPA of WJHL group compared to CIA group (red mark represented the upregulated biomarker, green mark represented the downregulated biomarker). | ||
Discussion
The overall, interactive, and comprehensive features of metabonomics coincided with the characteristics of multicomponents, multiple targets, and overall regulation of traditional Chinese medicine. Metabolomics is the most remarkable breakthrough points for the modernization of TCM. In addition, TCM and its compound chemical composition will influence the equilibrium, concentration, and ratio of endogenous metabolites because the endogenous metabolite group is the end-point aggregation of the whole life cycle of gene–protein–metabolites. Therefore, we can elucidate the material basis and mechanism of the therapy of TCM by tracing the changes in endogenous metabolites.Metabolites identification indicated that 93 retention time–exact mass pairs in CIA group compared with the control group on day 30 to analyze the early pathogenesis of CIA. In addition, 68 regulated metabolites were determined in WJHL group compared with the CIA group on day 69 to identify the effect of WJHL for the treatment of CIA.
Pathway analysis results revealed that the pathogenesis of CIA mice was mainly related to phenylalanine, tyrosine, and tryptophan biosyntheses (L-phenylalanine, L-tyrosine, and phenylpyruvic acid); aminoacyl-tRNA biosynthesis (glycine, L-lysine, L-arginine, L-tryptophan, L-phenylalanine, L-tyrosine, L-leucine, L-histidine, and L-threonine); phenylalanine metabolism (L-phenylalanine, L-tyrosine, and phenylpyruvic acid); glycerophospholipid metabolism (LysoPC(17:0), LysoPC(18:0), LysoPC(16:0), LysoPC(20:3(5Z,8Z,11Z)), LysoPC(22:6(4Z,7Z,10Z,13Z,16Z,19Z)), LysoPC(22:5(4Z,7Z,10Z,13Z,16Z)), and LysoPC(20:2(11Z,14Z))); glycine, serine, and threonine metabolism (glycine, choline, L-threonine and glyceric acid); and nitrogen metabolism (glycine and L-histidine). Identified significant markers included uric acid, phosphoric acid, hypoxanthine, dehydroascorbic acid, arachidonic acid, and α-ketoisovaleric acid, which may be the useful as early biomarkers in the pathogenesis of CIA. CIA was a complex disease that involved multiple metabolic pathways. Furthermore, Chinese herbal compound WJHL could regulate 68 differential metabolites in WJHL group compared with the CIA group on the 69th day to exhibit the therapeutic effect. WJHL was mainly infecting three most significant metabolic pathways associated with body energy metabolism, namely, aminoacyl-tRNA biosynthesis (L-lysine, L-arginine, L-phenylalanine, L-leucine, and L-histidine), arginine and proline metabolisms (L-arginine, omithine, and citrulline), and valine, leucine, and isoleucine biosyntheses (L-leucine), to achieve the treatment effect in CIA disease.
Finally, as shown in the systematic metabolic network (Fig. 8), pink CP-labelled module represents the canonical metabolic pathway, the green module represents the downregulated metabolic markers, and the red module represents the upregulated metabolic markers; these markers were relevant to CIA disease treated by WJHL. Lipid metabolism, small molecule biochemistry, and carbohydrate metabolism were also presumed related with the treatment of CIA with WJHL from IPA predictive analysis of disease and function.
Conclusions
In summary, our work suggested that plasma metabolomics, as a robust platform to explore the pathogenesis of CIA, exhibits considerable potential in elucidating the response mechanisms of WJHL. Specifically, 93 retention time–exact mass pairs in CIA group compared with the control group on day 30 to analyze the early pathogenesis of CIA. In addition, 68 regulated metabolites were determined in WJHL group compared with the CIA group on day 69 to identify the effect of WJHL for the treatment of CIA. In addition, six most significant metabolic pathways and three most significant therapeutic intervention metabolic pathways were related to the early diagnosis of CIA disease and the advanced therapy of CIA disease, respectively. Furthermore, lipid metabolism, small molecule biochemistry, and carbohydrate metabolism were also presumed related with the treatment of CIA with WJHL from IPA predictive analysis of disease and function.Conflicts of interest
All authors declare that they have no conflicts of interests.References
- J. R. Everett, Comput. Struct. Biotechnol. J., 2015, 13, 131–144 CrossRef CAS PubMed.
- M. C. Menon, K. L. Keung, B. Murphy and P. J. O'Connell, Transplantation, 2016, 100, 1405–1414 CrossRef CAS PubMed.
- M. Villar, N. Ayllón, P. Alberdi, A. Moreno, M. Moreno, R. Tobes, L. Mateos- Hernández, S. Weisheit, L. Bell-Sakyi and J. de la Fuente, Mol. Cell. Proteomics, 2015, 14, 3154–3172 CrossRef CAS PubMed.
- C. Chang, L. Li, C. Zhang, S. Wu, K. Guo, J. Zi, Z. Chen, J. Jiang, J. Ma, Q. Yu, F. Fan, P. Qin, M. Han, N. Su, T. Chen, K. Wang, L. Zhai, T. Zhang, W. Ying, Z. Xu, Y. Zhang, Y. Liu, X. Liu, F. Zhong, H. Shen, Q. Wang, G. Hou, H. Zhao, G. Li, S. Liu, W. Gu, G. Wang, T. Wang, G. Zhang, X. Qian, N. Li, Q. Y. He, L. Lin, P. Yang, Y. Zhu, F. He and P. Xu, J. Proteome Res., 2014, 13, 38–49 CrossRef CAS PubMed.
- Y. V. Sun and Y. J. Hu, Adv. Genet., 2016, 93, 147–190 Search PubMed.
- Y. T. Liu, J. J. Cui, Y. H. Hu, G. H. Du and X. M. Qin, Chemom. Intell. Lab. Syst., 2017, 164, 16–25 CrossRef CAS.
- J. W. Fang, L. P. Wang, Y. Wang, M. F. Qiu and Y. Y. Zhang, Mol. BioSyst., 2017, 13, 1575 RSC.
- J. W. Yan, S. L. Risacher, L. Shen and A. J. Saykin, Briefings Bioinf., 2018, 19, 1370–1381 Search PubMed.
- M. Suarez-Diez, J. Adam, J. Adamski, S. A. Chasapi, C. Luchinat, A. Peters, C. Prehn, C. Santucci, A. Spyridonidis, G. A. Spyroulias, L. Tenori, R. Wang-Sattler and E. Saccenti, J. Proteome Res., 2017, 16, 2547–2559 CrossRef CAS PubMed.
- S. J. Kim, S. H. Kim, J. H. Kim and H. J. Yoo, Endocrinol. Metab., 2016, 31, 7–16 CrossRef CAS PubMed.
- R. Yang, Y. Z. Zhang, L. Wang, J. Hu, J. A. Wen, L. X. Xue, M. Tang, Z. C. Liu and J. X. Fu, Oncotarget, 2016, 8, 15420–15430 Search PubMed.
- N. Liu, X. Feng, W. B. Wang, X. K. Zhao and X. Li, Inflammation Res., 2017, 66, 603–610 CrossRef CAS PubMed.
- L. Zhu, H. Z. Wang, Y. Wu, Z. W. He, Y. H. Qin and Q. Shen, Mediators Inflammation, 2017, 2017, 7623145 Search PubMed.
- Y. Araki and T. Mimura, J. Immunol. Res., 2016, 2016, 6290682 Search PubMed.
- K. Schinnerling, J. C. Aguillón, D. Catalán and L. Soto, Clin. Exp. Immunol., 2017, 189, 12–20 CrossRef CAS PubMed.
- Y. Q. Zhang, X. Mao, Q. Y. Guo, M. Bai, B. Zhang, C. F. Liu, Y. Q. Sun, S. Li and N. Lin, Oncotarget, 2016, 7, 15885–15900 Search PubMed.
- M. He, W. E. Van, W. H. Van, M. Wang, M. Sun, S. Koval, W. R. Van, T. Hankemeier and D. G. J. Van, J. Photochem. Photobiol., B, 2017, 168, 98–106 CrossRef CAS PubMed.
- K. E. Kim, S. Kim, S. Park, Y. Houh, Y. Yang, S. B. Park, S. Kim, D. Kim, D. Y. Hur, S. Kim, H. J. Park, S. I. Bang and D. Cho, Oncotarget, 2016, 7, 76354–76361 Search PubMed.
- K. Loupasakis, D. Kuo, U. K. Sokhi, C. Sohn, B. Syracuse, E. G. Glannopoulou, S. H. Park, H. Kang, G. Rätsch, L. B. Ivashkiv and G. D. Kalliolias, PLoS One, 2017, 12, e0179762 CrossRef PubMed.
- B. Nie, X. Li, Y. Wei, M. Chen, J. W. Zhou, L. X. Lou, B. Dong, A. M. Wu, D. M. Zhang, L. Q. Zhu, J. L. Zhao and L. M. Chai, Evid.-Based Complementary Altern. Med., 2016, 2016, 1–14 CrossRef PubMed.
- X. Wu, Q. Y. Shou, C. W. Chen, H. Cai, J. D. Zhang, S. Q. Tang, B. C. Cai, D. X. Tang and G. Cao, Oncotarget, 2017, 8, 44242–44254 Search PubMed.
- H. W. Zhang, P. Fu, B. L. Ke, S. P. Wang, M. Li, L. Han, C. C. Peng, W. D. Zhang and R. H. Liu, J. Ethnopharmacol., 2014, 154, 55–64 CrossRef PubMed.
- C. S. Zheng, M. S. Qiu, X. J. Xu, H. Z. Ye, Q. Zhang, Y. H. Li, X. X. Liu and J. C. Chen, Exp. Ther. Med., 2016, 12, 87–94 CrossRef CAS PubMed.
- T. Zuzana, M. Carole, P. Melanie, G. Philippe, L. Thierry, M. Hubert, T. Jacques, P. G. Estelle and S. Martin, Variations in the Metabolome in Response to Disease Activity of Rheumatoid Arthritis, BMC Musculoskeletal Disord., 2016, 17, 353 CrossRef PubMed.
- H. Y. Liu, T. J. Garrett, Z. H. Su, C. Khoo and L. W. Gu, J. Nutr. Biochem., 2017, 45, 67–76 CrossRef CAS PubMed.
- G. Lee, H. Lee, J. Hong, S. H. Lee and B. H. Jung, J. Chromatogr. B: Anal. Technol. Biomed. Life Sci., 2016, 1031, 37–49 CrossRef CAS PubMed.
- N. Lemonakis, H. Poudyal, M. Halabalaki, L. Brown, A. Tsarbopoulos, A. L. Skaltsounis and E. Gikas, J. Chromatogr. B: Anal. Technol. Biomed. Life Sci., 2017, 1041, 45–59 CrossRef PubMed.
Footnote |
| † Electronic supplementary information (ESI) available. See DOI: 10.1039/c8ra05528a |
| This journal is © The Royal Society of Chemistry 2019 |

