
 Open Access Article
 This Open Access Article is licensed under a Creative Commons Attribution-Non Commercial 3.0 Unported Licence
Interactions of neutral gold nanoparticles with DPPC and POPC lipid bilayers: simulation and experiment†
Amin Reza Zolghadr * and
Sedigheh Saddat Moosavi
* and
Sedigheh Saddat Moosavi
Department of Chemistry, College of Sciences, Shiraz University, Shiraz, 7194684795, Iran. E-mail: arzolghadr@shirazu.ac.ir
First published on 11th February 2019
Abstract
Molecular dynamics simulations of neutral gold nanoparticles (AuNPs) interacting with dipalmitoylphosphatidylcholine (DPPC) and 1-palmitoyl-2-oleoyl-sn-glycero-3-phosphocholine (POPC) membranes were studied using a model system. Spontaneous membrane insertion of AuNPs did not occur on the time scale of atomistic simulations. To overcome the limitations of time scale, we used a harmonic restraining potential to force the AuNPs into the membranes. Free energy calculations indicate that a NP has to cross a free energy barrier of about 134 kJ mol−1 prior to forming a stable contact with the membrane. This energy barrier between lipids and NPs comes from the repulsion between headgroups of lipids and AuNPs. The experimental investigations indicate that, contrary to hydrophobic AuNPs, neutral AuNPs cannot form ion channels across lipid membranes. The adsorption of NPs induces the formation of a highly ordered region in phospholipid bilayers. Our simulation results propose that the cell penetration of small uncoated AuNPs does not involve energy-independent membrane translocation but rather involves the energy-dependent formation of nanoscale membrane holes or energy-dependent endocytosis.
Introduction
Exploring gold nanoparticle (AuNP)-biomembrane interactions is of substantial interest for biomedical applications of AuNPs. In such implementation, AuNPs are needed to destroy tumor cells without damaging healthy tissues. The potential of NPs to cross cell plasma membranes is determined by their structure as well as by cell type and pH.1 In the past few years, NPs have appeared as an appropriate class of drug delivery carriers as well as tools for targeted annihilation of cancer cells.2 Therefore, a thorough, atomic-level understanding of the AuNP cellular uptake mechanism is still required.The surface chemistry of AuNPs plays an essential role in controlling cell membrane translocation. Small AuNPs with hydrophobic ligands can penetrate lipid membranes due to appropriate hydrophobic contacts between their ligands and lipid tails. Here, we used computer simulations to describe the physical interactions of neutral AuNPs with lipid membranes. The simulations are explained by experimental investigations based on electrical conductance of bilayer membranes.
To the authors' knowledge, the first publication concerning AuNPs' interaction with lipid membranes by molecular dynamics (MD) simulation appeared in 2010 with a coarse-grained (CG) model under various conditions.3 Alkyl thiol ligand terminals of the NPs were functionalized with various groups to feature distinct signs of surface charges. The potential of mean force calculations indicate that the adhesion and penetration are energy-favorable. The findings propose a way of controlling AuNP–cell interactions by tuning the percentage of cationic ammonium-functionalized ligands on an AuNP to penetrate DPPC/DPPG mixed bilayers.3 By 2014, a wide range of simulations for AuNPs/membrane systems had been reported and this process has continued to the present. The existing results show that electrostatic attraction enhances the interaction of a charged NP with a membrane,4 whereas the free energy of permeation increases with decreasing size of NPs.5 Researchers have also investigated fluid-gel transformations of a DPPC lipid bilayer in the presence of both negatively and positively charged NPs.6 Gkeka et al. have described certain interaction patterns on the surface of a NP that encourage its translocation through a lipid membrane.7,8
Atomistic MD simulations of AuNP penetration through lipid membranes are computationally demanding. The time scales of membrane interactions and internalization can differ by orders of magnitude based on the AuNP surface chemistry. Kyrychenko et al. synthesized thiol-coated colloidal AuNPs of 3.75 ± 0.06 nm which were soluble in non-polar organic solvents. Based on their experiments, a new CG MD model of AuNPs was introduced.9 Lin et al. performed CG MD simulations to study the AuNP-induced hole formation on a negative lipid bilayer.10
Gupta and Rai have used both unconstrained and constrained CG MD simulations to explore the translocation and the permeation mechanism of AuNPs through a model skin lipid membrane.11 Recently, Salassi et al. checked the performance of three different versions of the popular CG Martini force field for reproducing the atomistic free-energy profile. They indicated that the standard version of the Martini model underestimates the free-energy barriers.12
In the current study, we explore the interactions between electroneutral NPs and membranes. Moreover, comparative analysis of the structural variations of membranes shows that the surface adsorption of NPs has a remarkable impact on membrane structure. The adsorption of NPs induces the formation of highly ordered regions in bilayers. Different compositions of lipids can affect membrane functionality very differently. Noticeably, phospholipids containing the choline group moiety are the most abundant class in eukaryotic cells.13 Therefore, we considered POPC and DPPC lipid bilayers to represent membrane models. These phospholipids are among the most widely used bilayers for MD simulations as they resemble the naturally occurring phospholipids which commonly contain saturated sn-1 and unsaturated sn-2 acyl chains. Also, their simple structure and availability of experimental data allow them to be easily modelled.14 Fully atomistic MD simulations are too costly to allow for performing enhanced sampling. MD trajectories at finite times are not ergodic and leave many relevant regions of configuration space unexplored. Therefore, we turn to an umbrella sampling method that uses bias potentials.
Computational methods
AuNPs of 2 nm in diameter were simulated by GROMOS96 53a6 force field.15 We used the pre-equilibrated coordinates and force field parameters of DPPC and POPC bilayers which consist of 64 lipids per membrane leaflet. Initial coordinates for the DPPC and POPC lipid bilayers were taken from the Tieleman group website.16,17 The larger ensembles were built by duplicating this structure in the x–y plane. The negative charges of phospholipids were balanced by considering additional Na+ ions.18 The SPC/E model was employed for water.19,20 All simulations were carried out using the GROMACS 4.5.4 package.21,22 Visual Molecular Dynamics 1.9 (VMD) was used for the production of snapshots.23 Minimization was conducted for 1 ns in the NPT ensemble to eliminate potential overlaps between water and AuNPs, followed by 1 ns of dynamic simulation in the NVT ensemble at T = 310 K. The temperature was controlled using the Nosé–Hoover thermostat.24 The LINKS algorithm was employed to allow for a 2 × 10⁻³ ps time step.25 The effective calculations of coulombic interactions were accomplished by using the Ewald method with a real-space cut-off of 14 Å. van der Waals interactions were cut off with a switching function between 12 and 14 Å. We simulated four types of systems described in Table 1. For all systems, the ensemble density was adjusted by NPT simulations at 1 bar. The simulation run times are indicated in Table 1 for each system.| System | Phospholipid | Water | AuNP | Surface charge of AuNPs | Time (ns) |
|---|---|---|---|---|---|
| A | DPPC (256) | 20![[thin space (1/6-em)]](https://www.rsc.org/images/entities/char_2009.gif) 440 440 |
6 | Zero | 100 |
| B | DPPC (256) | 21190 |
1 | Positive | 100 |
| C | POPC (128) | 9227 | 1 | Negative | 100 |
| D | DPPC (128) | 7822 | 2 | Negative | 100 |
The umbrella sampling technique was used to evaluate the free energy profile of the NP approaching the extracellular leaflet of one of the bilayers.26 The reaction coordinate was selected to be the distance between the core gold atoms and the phosphorus atoms of the target leaflet in the direction normal to the bilayer (z). A harmonic biasing potential was applied, and a total of 34 windows with a spacing of 0.2 nm along the entrance route were modeled for a total of 680 ns. Sufficient sampling of the reaction coordinate was performed by using a force constant of 1000 kJ mol−1 nm−2. The data for the last 5 ns were captured in the analysis for all windows. Other simulation parameters follow those of the presented equilibrium simulations. The profiles and their statistical error estimates were obtained by the GROMACS tool g_wham.27
We used the method of interfacial tension measurement provided by Ghatee and co-workers to obtain experimental results for 1 mM solution of AuNPs.28,29 On the other hand, the interfacial tensions were calculated for the same systems by using MD simulations. The calculated interfacial tension value was 62.7 mJ m−2 which is close to the experimental interfacial tension of 64.5 mJ m−2 at 310 K.
Results and discussion
Interaction of AuNPs of different surface charge with bilayer membrane
Nanoparticles may pass through a cell membrane by direct diffusion and endocytosis. In this work we investigate nonselective direct penetration of small AuNPs into cell membranes by atomistic simulation. The mechanism of selective endocytosis perspective will be studied elsewhere. The scientific question that prompted us to do this research was as follows: can small hydrophilic AuNPs cross healthy cell membranes passively?As mentioned in Table 1, system A consists of 256 DPPC molecules located in the two halves of a planar bilayer and surrounded by a total of 20440 water molecules. Six AuNPs were initially placed 0.5 nm above the bilayer surface in the water phase. Surface AuNPs have alternate positive and negative charge. Once the simulation started, the AuNPs began to form stable aggregates quickly in the water phase. These assemblies do not form direct contacts with the membrane during the time scale of the 100 ns simulations (see Fig. 1). The corresponding density profiles are depicted in Fig. 2A.
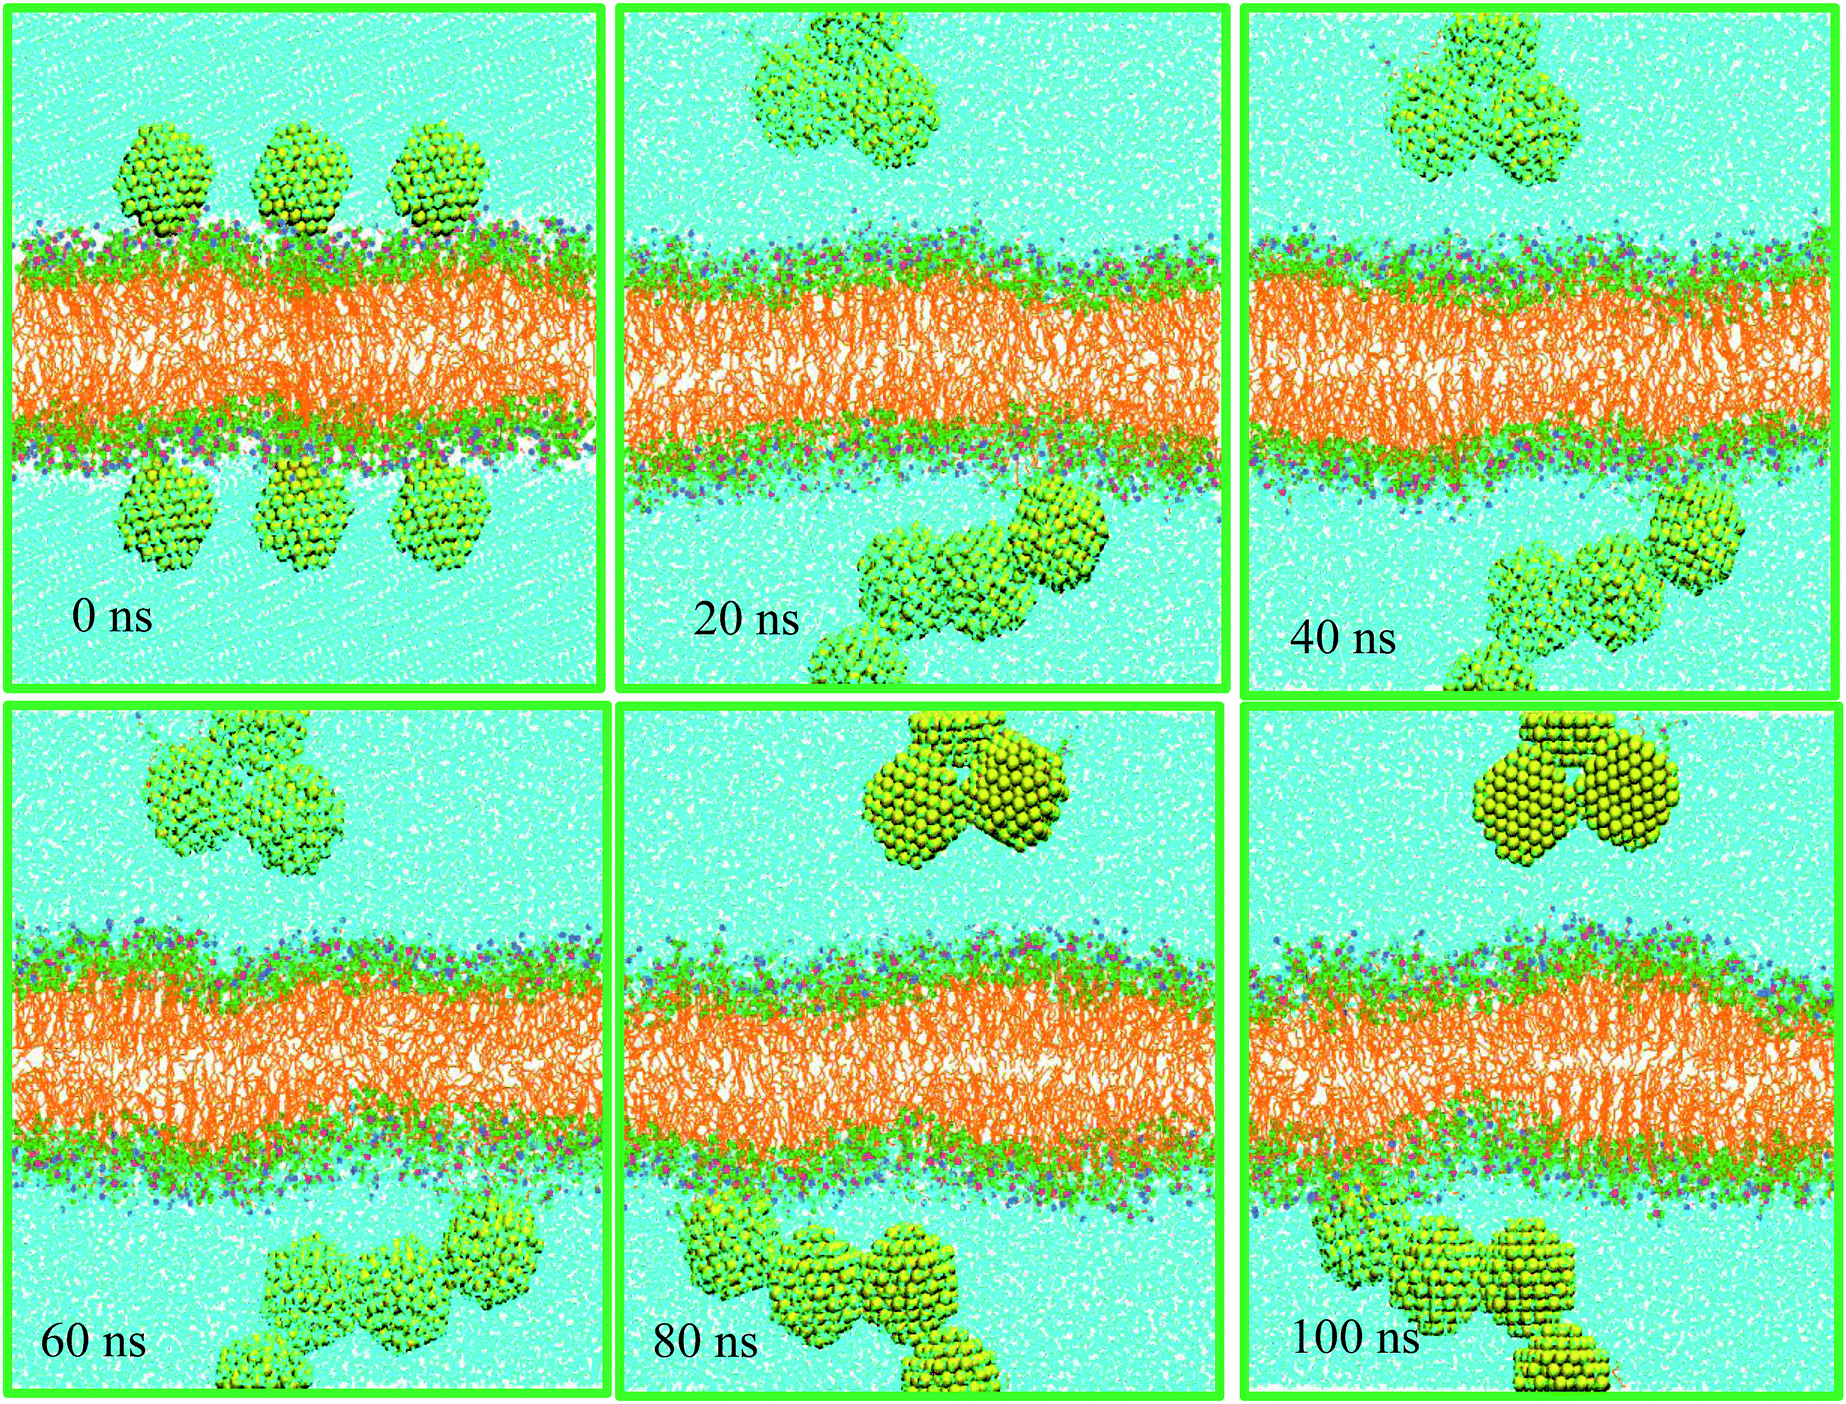 | ||
| Fig. 1 Visualization of AuNPs' interaction with DPPC membrane (system A). | ||
 | ||
| Fig. 2 (A) Density profiles of system A. (B) The evolution of distance between the lipid bilayer and AuNPs of system A. (C) Number of contacts between the AuNPs, water and lipid head and tail groups. (D) Radial distribution functions of gold atoms with respect to DPPC head, DPPC tail and water molecules for 100 ns in system A. | ||
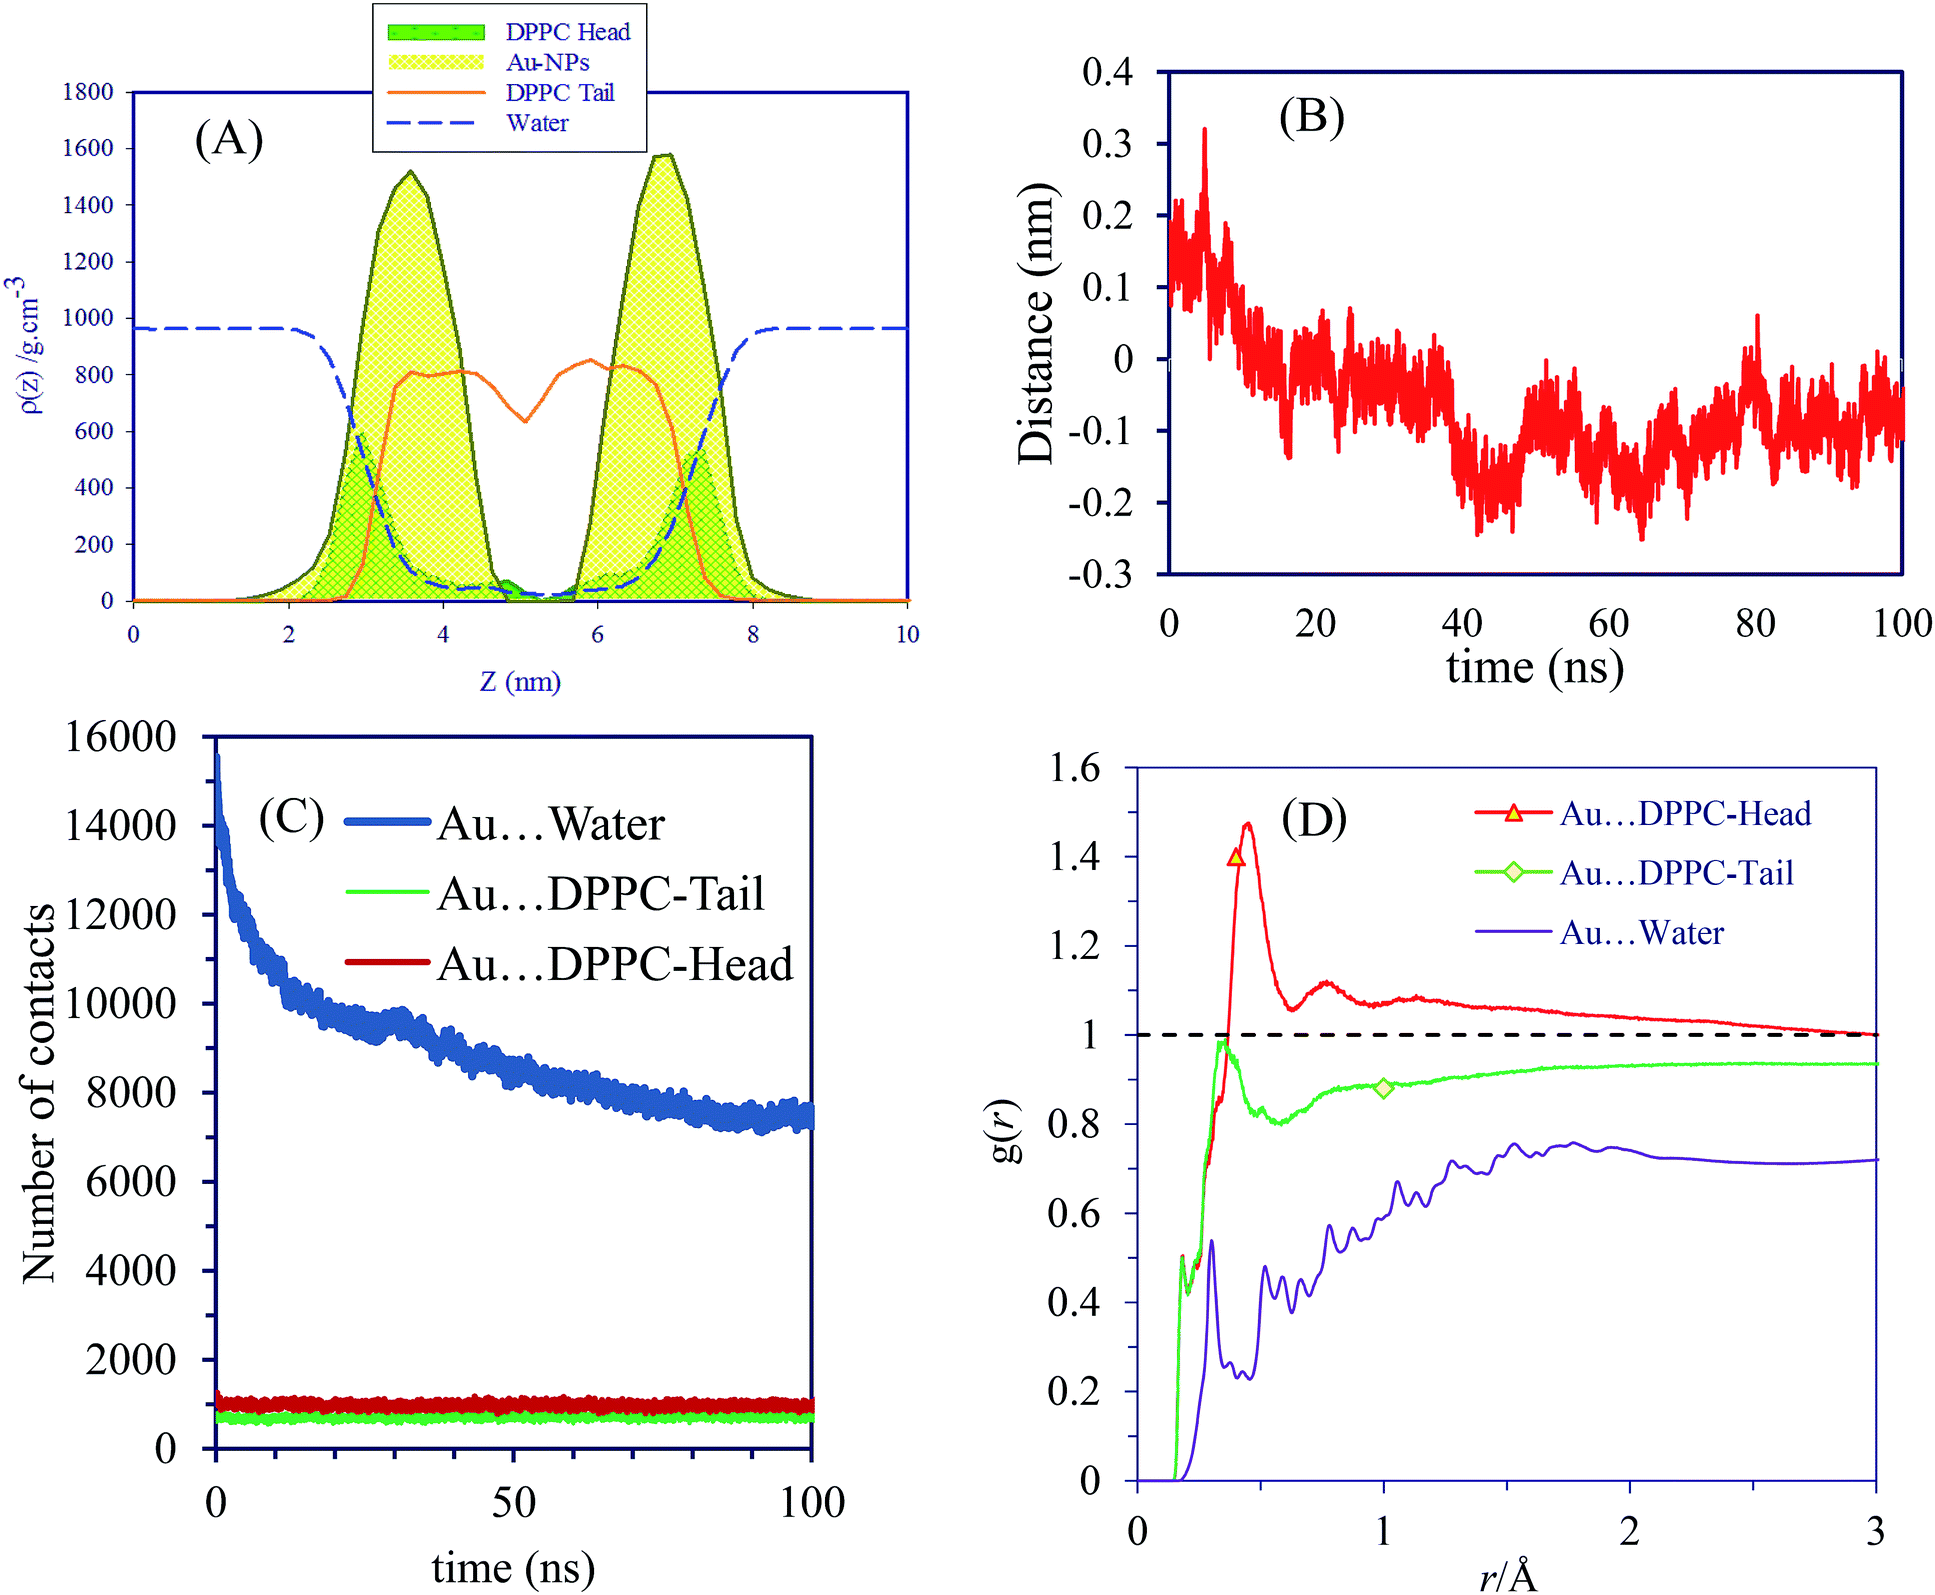
The density profiles confirm the visual assessment of the equilibrium positions of the NPs. Interestingly, our atomistic simulations indicate that self-assembled AuNPs do not bind spontaneously to the membrane. Fig. 2B shows the progress of the distance between AuNPs and membrane. The number of contacts between the AuNPs, water and different parts of lipids are shown in Fig. 2C. Interestingly the NPs accumulated in the water phase, and direct contacts with the lipid membrane components are negligible. The number of contacts between AuNPs and water molecules decreases with simulation time as the NPs tend to self-assemble in water. These results are in line with the radial distribution functions, g(r), shown in Fig. 2D. The g(r) plot describes the structure of a system as the variation in particle number density with distance from a reference particle. According to the g(r) plots, the interactions between self-assembled AuNPs and water molecules are crucial at both short and long ranges.
The deuterium order parameter SCD, which can be obtained experimentally by NMR spectroscopy, is calculated to characterize the effect of AuNPs on the lipid bilayer alignment. SCD is evaluated as 1/2〈(3cos2θ − 1)〉, where θ is the angle between the C–H bond vector of the lipid hydrocarbon chains and the bilayer normal. The averages are over the simulation trajectory. SCD provides the average orientation and order of the phospholipid tails in the bilayer with regard to the lipid membrane normal vector, quantitatively. A −SCD(n) value of 0.5 represents the perfect order of the lipid tail to the membrane normal and a value close to zero represents a random distribution. Deuterium order parameters were calculated using the GROMACS g_order program.
The order parameters −SCD are obtained as a function of the carbon atom along the lipid tails for DPPC and depicted in Fig. 3A. The chemical structure of the DPPC molecule is shown Fig. 3B in which carbon atoms of the sn-1 and sn-2 chains are numbered with their positions of 2–15. According to the obtained order parameters, the conformations of sn-1 and sn-2 chains are likely the same. The results obtained for the control system are in good agreement with reported experimental and simulation data.30
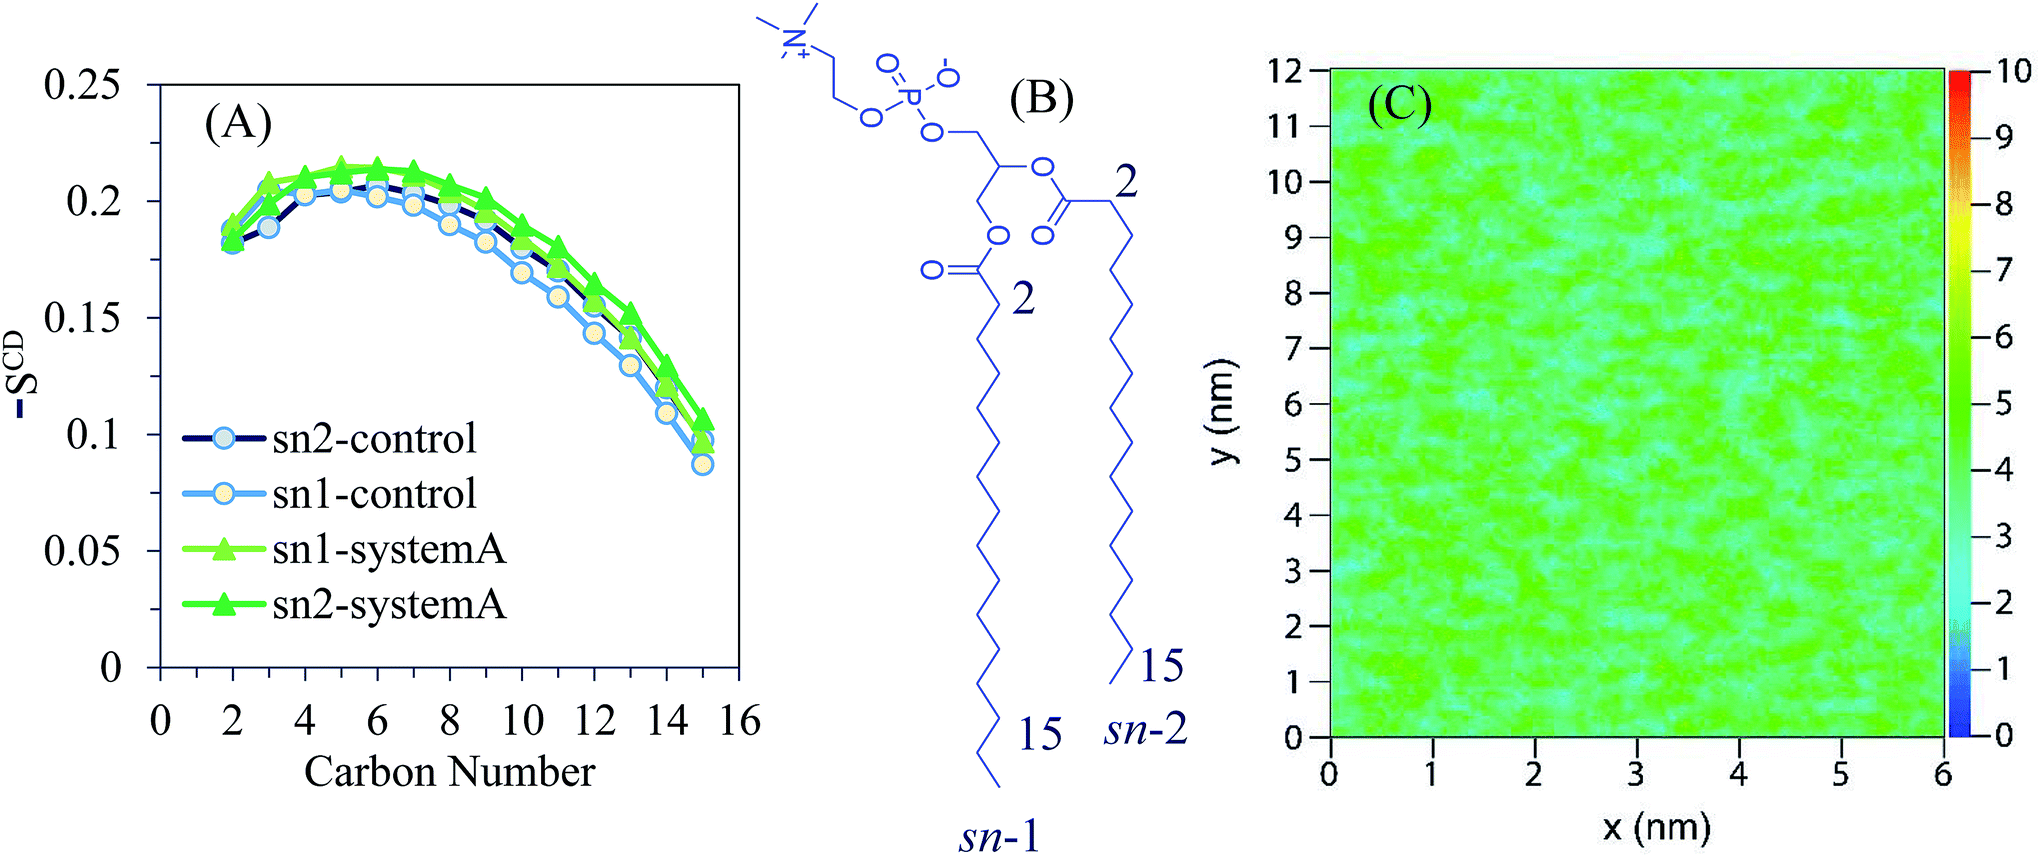 | ||
| Fig. 3 (A) Average deuterium order parameters obtained for the sn-1 and sn-2 chains of DPPC in system A over the 100 ns of the simulation. The calculated values of the control system are also shown. (B) The chemical formula of a DPPC molecule. (C) 2D map of the numeric densities of lipid heads in the distal leaflet as obtained after 100 ns of atomistic simulation for system A. | ||
The control system is recognized by the first region of relatively high lipid acyl chain order near the interface that seems like a plateau (except for deviation in the beginning of the chain), followed by a second region that reduces monotonically toward lower −SCD in the centre of the lipid bilayer. The calculated order parameter of the lipid is slightly shifted to higher values for system A when compared to the control results. According to the 2D density map of Fig. 3C, the density of the polar lipid heads is not affected by the presence of AuNPs.
As AuNPs form stable assemblies in the aqueous phase, we carried out the rest of the simulations with a single NP. The specification of system B is summarized in Table 1. The AuNP in this system has positive surface charge (see Fig. S1†). This system is a 100 ns simulation consisting of 256 DPPC and 21190 water molecules. The bilayer plane lies parallel to the xy-plane, and an AuNP is arranged in close proximity above the bilayer to interact with DPPC head groups (at a distance of about 0.5 nm). Sample snapshots of this system at different simulation times are depicted in Fig. S2.† Visual inspection of the MD trajectories indicates that AuNP is confined at the interface region. The results show that AuNPs started penetrating the bilayer surface after about 10 ns. The head groups of the upper leaflet of the bilayer, which were just under the AuNPs, also moved along with the NPs towards the bilayer centre. In this system, AuNPs remained at the phospholipid membrane/water surface for the whole simulation time and no translocation towards the outside (water region) was observed. Density profiles of Fig. S3† show the average position of the AuNP during the MD simulation for system B. RMSD calculations for AuNPs indicate that the system is well equilibrated (see Fig. S4†). Fig. S5† shows the evolution of the interaction energy between AuNP and lipid bilayer. It is seen that the interaction energy undergoes some decreases in the process. The first large decreases occur as the AuNP pierces into the bilayer and the consecutive small decreases can be related to the rotation of the NP to its resting position in the polar part of the bilayer.
Fig. S6A† compares the order parameter of sn-1 and sn-2 chains of DPPC in system B to the control system. The −SCD profiles show an additional ordering induced by the AuNP. The insertion of this AuNP created vacancies in the bilayer (see Fig. S6B† for 2D plots of the lipid heads) but these vacancies were not able to conduct water. The slight membrane deformation due to the presence of small AuNPs allows the system to reduce the repulsion between the lipid head groups around AuNPs, without exposing the hydrophobic acyl chains to the water phase. One very distinct feature of the radial distribution function for this system is the presence of a distinct peak in AuNP⋯DPPC-tail g(r) at about 0.47 nm (see Fig. S7†). The average number of contacts between AuNPs and DPPC head groups is about 300 per time frame (see Fig. S8†). We also performed simulations using an ensemble of POPC lipids, consisting of 128 POPC molecules surrounded by a total of 9227 water molecules (system C). Fascinatingly, the AuNP exhibits a profound tendency to the membrane surface (see Fig. S9†). The evolution of distance between lipid bilayer and AuNPs of system B and also RMSD calculations for AuNPs indicate that the system is well equilibrated (see Fig. S10†). The order parameters and 2D plots of the lipid head densities are shown in Fig. S11.† While the order of sn-1 chain increases relative to the control system, a decrease in the order of the first region and an increase in the order of the second is observed for the sn-2 chain. Interestingly, the number of contacts between AuNPs and POPC lipid is higher than that for DPPC (see Fig. S12†). The presence of a small peak in g(r) of AuNPs⋯POPC at around 0.18 nm indicates that short-range correlations are important (see Fig. S13†).
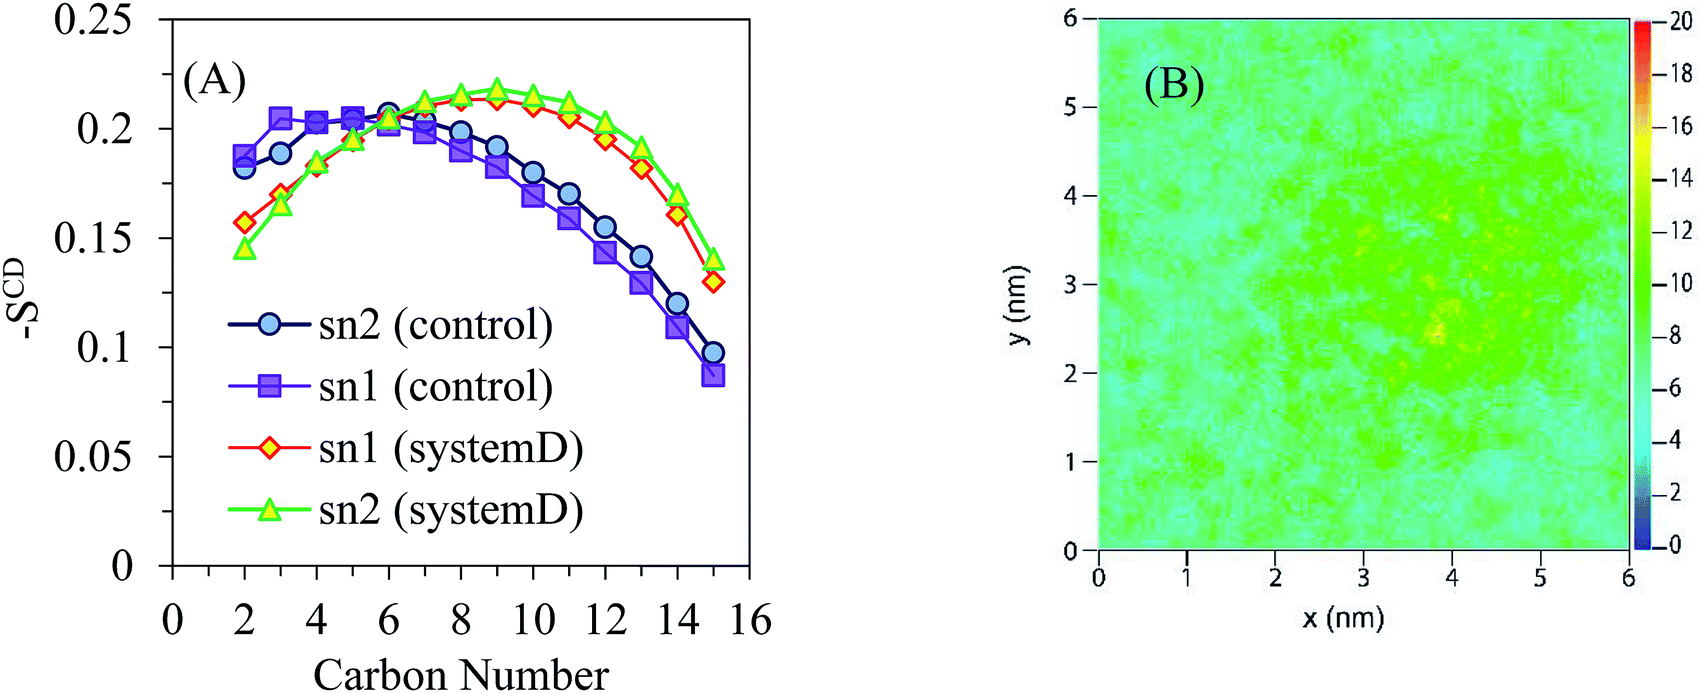
Furthermore, we performed the simulations with 128 DPPC molecules and 7822 water molecules for 100 ns to investigate the effect of surface charge on the equilibrium position of NPs. Two AuNPs of negative surface charge was inserted in the water phase. The charge density of the AuNPs in this system is provided in Fig. S14.† Earlier, we also performed simulations using an ensemble of larger surface area consisting 256 DPPC and 21190 water molecules, with one AuNP. Because no appreciable difference due to the ensemble size was noted, we continued the simulation using the smaller one (see Fig. S15†). In contrast to compounds that are able to rapidly translocate across the cell membrane, neutral AuNPs are distributed symmetrically on both sides of the bilayer in this ensemble (system D). In Fig. 4 we present sample snapshots of system D at various time intervals. The density profiles support the visual inspection of the equilibrium positions of the NPs. The corresponding density profiles are depicted in Fig. 5A. Fig. S16† shows the evolution of the interaction energy between AuNP and lipid bilayer. It is seen that the interaction energy undergoes some decreases in the process. The first large decreases occur as the NP penetrates into the bilayer and the successive small decreases can be related to the rotation of the NP to its resting position in the polar part of the bilayer. These results present convincing evidence that neutral AuNPs with negative surface charges interact strongly with the hydrophilic part of lipid bilayers to induce substantial membrane permeability.
 | ||
| Fig. 4 Sample snapshots of system D at various time intervals. | ||
 | ||
| Fig. 5 (A) Density profiles of system D. (B) The evolution of distance between the lipid bilayer and AuNPs of system D. (C) Number of contacts between the AuNPs, water and lipid head and tail groups. (D) Radial distribution functions of gold atoms with respect to DPPC head, DPPC tail and water molecules for 100 ns in system D. | ||
Also, the distance between AuNP and lipid membrane over the course of 100 ns simulation is shown in Fig. 5B. The time evolution of the distance in the present case shows strong correlations with the minimum distance between the AuNP and lipid membrane center of mass. Number of contacts and radial distribution function analysis indicate that these AuNPs bind strongly to the bilayer surface (see Fig. 5C and D). The first and second peaks in g(r) plots indicate that AuNPs interact with DPPC head groups with a relatively high probability and small dynamics at short ranges. The subsequent peaks of Au⋯water g(r) are an indication of rather good coordination at long range. The obtained order parameters of this system (see Fig. 6A) reveal that the presence of AuNPs leads to a decrease in the order of the first region and an increase in that of the second. The decrease in the order of the first region can be explained mainly by electrostatic interactions between the NP and the lipid head groups. It is clear from the order parameter that the severe disruption on the bilayer is caused by the strong attractions between the AuNPs and the head groups of DPPC. Interestingly, the density of the polar lipid heads is increased around the region where the AuNPs interact with the membrane (see Fig. 6B). It is noteworthy that, if the initial distance between NPs and bilayer is increased, the entry of NPs into the bilayer will not be observed within the limited simulation time.
 | ||
| Fig. 6 (A) Average deuterium order parameters obtained for the sn-1 and sn-2 chains of DPPC in system D. (B) 2D map of the numeric densities of lipid heads in the distal leaflet as obtained after 100 ns of atomistic simulation for system D. | ||
Free energy calculations
We wanted to elucidate the mechanism by which AuNPs enter bilayer membranes and determine whether uptake is energy-dependent. Atomistic MD simulations did not show spontaneous piercing of the AuNPs into the lipid membrane. This indicates that penetration of AuNPs from water phase into the membrane must overcome a free-energy barrier. Therefore, we performed potential of mean force (PMF) calculations to obtain the height of the atomistic free-energy barriers for the membrane translocation of uncoated AuNPs by using an umbrella sampling technique and a weighted histogram analysis method. All PMF are aligned so that they have a value of zero in the water phase, Eref, and thus all free energy changes are relative to NPs in water. The energy barriers are calculated according to this reference point: ΔE = Emax − Eref, where Emax indicates the maximum value of PMF. The interaction between a neutral AuNP and the membrane is purely repulsive. The onset of the repulsion appears at about 5.66 nm.Fig. 7 shows the PMF as a function of the distance between the center of mass of neutral (Fig. 7A) and hydrophobic (Fig. 7B) AuNPs and lipid bilayer. Interestingly, the free energy for the penetration of the neutral AuNPs from the water phase to the hydrophilic surface of the lipid bilayer is found to be about 134 kJ mol−1. According to the comparison of two independent runs, the average uncertainty of the results is about ±4.2 kJ mol−1. This free energy barrier is typically larger than those obtained for translocation of Cl− anion in DPPC (100.8 ± 1.3 kJ mol−1) by atomistic force fields.31 Our results are in accordance with recent metadynamics calculation of Salassi et al. for ligand-coated AuNPs.12 Their results showed that the CG model underestimates the energy penalty of AuNP translocation when compared to the atomistic model. For the neutral AuNP system, an energy maximum can be observed at a distance of 2.08 nm from the centre of the bilayer. This may be due to the electrostatic interactions between AuNPs of negative surface charge with the positively charged choline groups of the lipids. As the AuNPs translocate across the bilayer centre, another energy penalty appeared which indicates the process is non-spontaneous. Our results indicate substantial free energy barrier to AuNP penetration across the bilayer with the maximum lying at the AuNP–membrane interface. According to our simulations, direct translocation across the membrane could not be a relevant mechanism for cell membrane permeation. The entry of NPs into cells may occur by receptor-mediated endocytosis. For the sake of comparison, we have simulated AuNPs that were coated by 60 octanethiol –S–(CH2)7–CH3 ligands. Fig. 7B indicates that the PMF curve descends sharply at the bilayer interior. Therefore, the preference of hydrophobic NPs into the bilayer interior is high. However, as energy barriers are situated between the AuNPs and the lipid membrane, the entrance of the AuNPs into the inner part of lipid membrane was not noticed in the simulations.
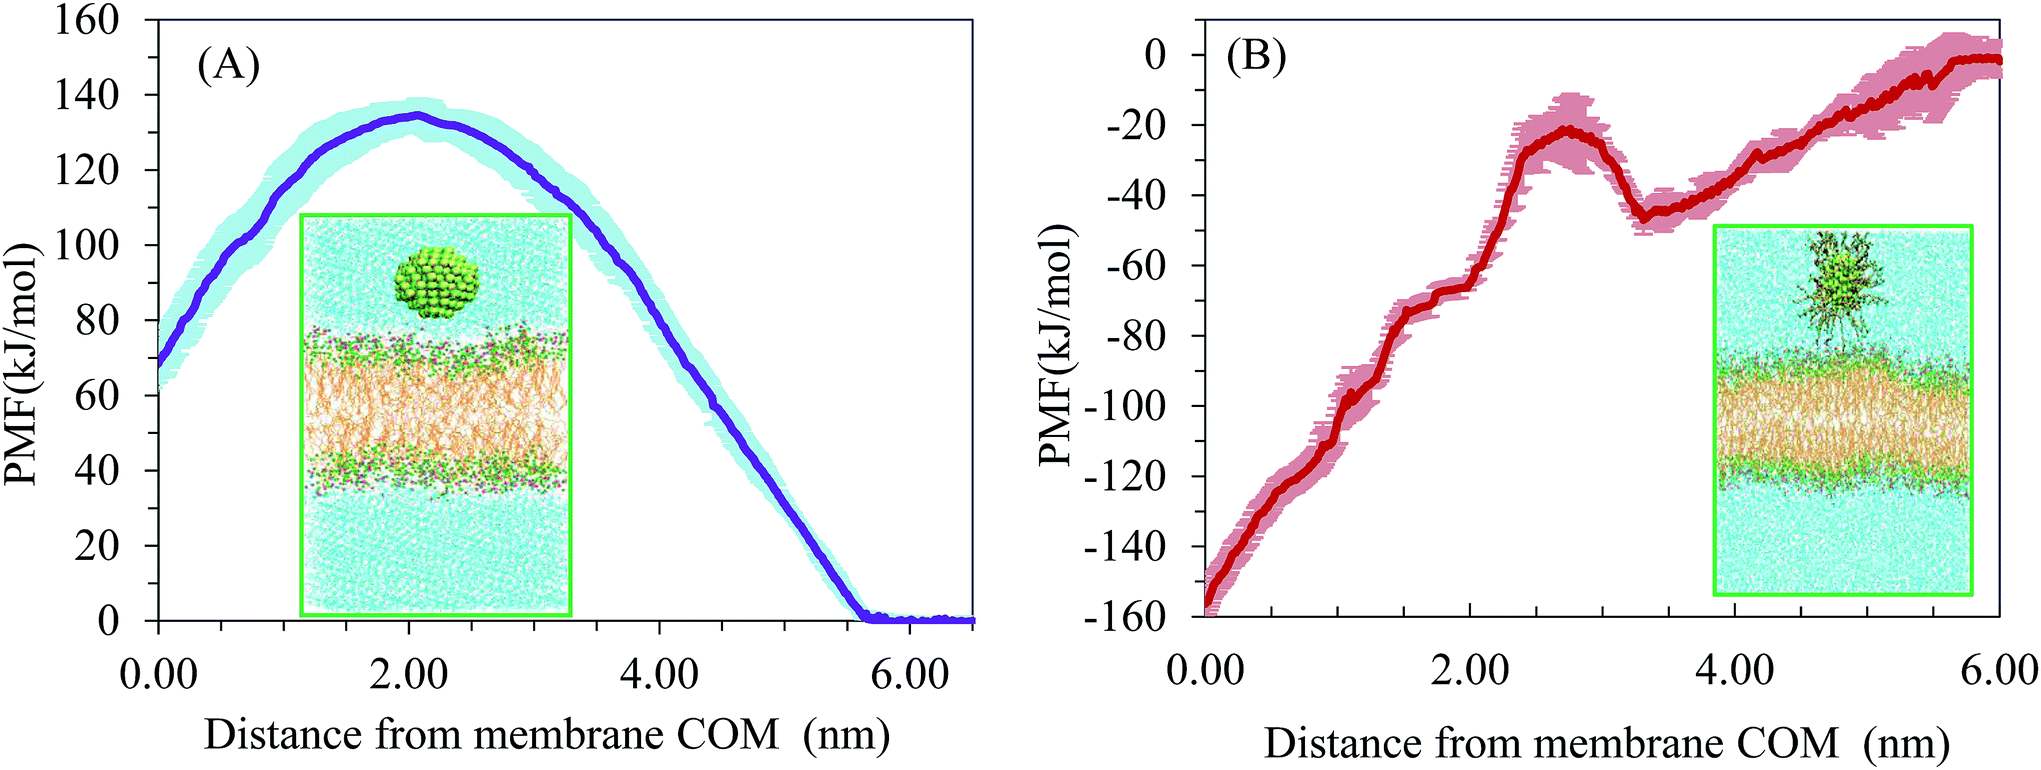 | ||
| Fig. 7 The potential of mean force for (A) neutral AuNPs and (B) hydrophobic AuNPs penetrating the bilayer. | ||
Experimental current–voltage investigation
To test whether neutral AuNPs permeate the cell membrane, we measured electrical conductance of bilayer membranes before and after exposure to NPs. AuNPs (8.3 nm) were prepared based on the standard sodium citrate reducing methodology described in the literature.32 Then, we centrifuged them at 14000 rpm for 20 minutes. Finally, the sample was air-dried and re-dispersed in water by sonication at a concentration of 10 μg mL−1. A typical TEM image of this system is shown in Fig. 8A. KCl (40 mM) was added to the solution. Planar bilayers were formed by applying a suspension of synthetic POPC (ACROS) in decane. Analysis of the records was carried out using a digital oscilloscope. Current–voltage (I–V) relationships before (control) and after exposure to the neutral and hydrophobic AuNPs are illustrated in Fig. 8B. The I–V curves represent the mean value of at least three readings of the amplitude of the current at the potential indicated. Distinct conductance changes that are characteristic of ion channel formation (as is clearly seen in the case of hydrophobic AuNPs) were not observed after addition of neutral AuNP solution. In other words, the conductance (slope of the I–V relationship) after 20 min exposure to the neutral AuNPs does not change substantially as compared with the control system. I–V data indicate that exposure to the neutral AuNPs could not result in membrane disruption and ion transport.
 | ||
| Fig. 8 (A) TEM image of AuNPs. (B) Current–voltage relationships (the inset is focused on control and neutral AuNP systems). | ||
Conclusions
The NP-membrane interaction is very relevant for studying biomedical applications and potential toxic effects of nanomaterials. In this work, we have performed atomistic MD simulations of neutral AuNPs' interactions with DPPC and POPC environments in order to test their tendency to penetrate through the cell membrane and shed light on the molecular mechanisms involved. The simulation results suggest that hydrophilic AuNPs cannot rapidly cross cell membranes. Also, recent published data suggest that some CG models can lead to an artificial uptake of these NPs by direct diffusion. The PMF produced from the pulling simulation followed by umbrella sampling MD provides a thermodynamic aspect of the interactions of AuNPs with the lipid bilayer. The results indicate that AuNPs experience a free energy barrier to bind with the extracellular leaflet, in agreement with experiments.33 Our simulations show that AuNPs attach to a phospholipid membrane surface in a stable manner, after the crossing of a free energy barrier. The experimental results show that the exposure of the membrane to neutral NPs cannot lead to the formation of defects that enhance penetration through the membrane.Conflicts of interest
There are no conflicts to declare.Acknowledgements
The authors wish to express their gratitude to Shiraz University Research Council for the financial support of this work. We also thank the Iran Science Elites Federation for partial support of this work.References
- P. Gkeka, P. Angelikopoulos, L. Sarkisov and Z. Cournia, PLoS Comput. Biol., 2014, 10, e1003917 CrossRef PubMed.
- P. Gkeka, L. Sarkisov and P. Angelikopoulos, J. Phys. Chem. Lett., 2013, 4, 1907–1912 CrossRef CAS PubMed.
- J. Q. Lin, H. Zhang, Z. Chen and Y. Zheng, ACS Nano, 2010, 4, 5421–5429 CrossRef CAS PubMed.
- Y. Li and N. Gu, J. Phys. Chem. B, 2010, 114, 2749–2754 CrossRef CAS PubMed.
- X. Lin, Y. Li and N. Gu, J. Comput. Theor. Nanosci., 2010, 7, 269–276 CrossRef CAS.
- J. P. Prates Ramalho, P. Gkeka and L. Sarkisov, Langmuir, 2011, 27, 3723–3730 CrossRef CAS PubMed.
- P. Gkeka and P. Angelikopoulos, Curr. Nanosci., 2011, 7, 690–698 CrossRef CAS.
- P. Gkeka, L. Sarkisov and P. Angelikopoulos, J. Phys. Chem. Lett., 2011, 4, 1907–1912 CrossRef PubMed.
- A. Kyrychenko, G. V. Karpushina, S. I. Bogatyrenko, A. P. Kryshtal and A. O. Doroshenko, Comput. Theor. Chem., 2011, 977, 34–39 CrossRef CAS.
- J. Q. Lin, Y. G. Zheng, H. W. Zhang and Z. Chen, Langmuir, 2011, 27, 8323–8332 CrossRef CAS PubMed.
- R. Gupta and B. Rai, J. Phys. Chem. B, 2016, 120, 7133–7142 CrossRef CAS PubMed.
- S. Salassi, F. Simonelli, D. Bochicchio, R. Ferrando and G. Rossi, J. Phys. Chem. C, 2017, 121, 10927–10935 CrossRef CAS.
- B. Agranoff and D. Goldberg, Lancet, 1974, 304, 1061–1066 CrossRef.
- S. Li, H. N. Lin, Z. Q. Wang and C. Huang, Biophys. J., 1994, 66, 2005 CrossRef CAS PubMed.
- S. Mann, Nat. Mater., 2009, 8, 781 CrossRef CAS PubMed.
- Biocomputing at the University of Calgary, http://moose.bio.ucalgary.ca/index.php?page=Structures_and_Topologies, accessed April 2018.
- D. P. Tieleman and H. J. C. Berendsen, J. Chem. Phys., 1996, 105, 4871–4880 CrossRef CAS.
- D. Van Der Spoel, E. Lindahl, B. Hess, G. Groenhof, A. E. Mark and H. J. Berendsen, J. Comput. Chem., 2005, 26, 1701–1718 CrossRef CAS PubMed.
- P. Mark and L. Nilsson, J. Phys. Chem. A, 2001, 105, 9954–9960 CrossRef CAS.
- B. Guillot, J. Mol. Liq., 2002, 101, 219–260 CrossRef CAS.
- H. J. C. Berendsen, D. van der Spoel and D. van Drunen, Comput. Phys. Commun., 1995, 91, 43–56 CrossRef CAS.
- E. Lindahl, B. Hess and D. van der Spoel, J. Mol. Model., 2001, 7, 306–317 CrossRef CAS.
- W. Humphrey, A. Dalke and K. Schulten, J. Mol. Graphics, 1996, 14, 33–38 CrossRef CAS PubMed.
- P. H. Hünenberger, Advanced computer simulation, 2005, pp. 130–130 Search PubMed.
- B. Hess, H. Bekker, H. J. Berendsen and J. G. Fraaije, J. Comput. Chem., 1997, 18, 1463–1472 CrossRef CAS.
- G. M. Torrie and J. P. Valleau, J. Comput. Phys., 1977, 23, 187–199 CrossRef.
- J. S. Hub, B. L. De Groot and D. Van Der Spoel, J. Chem. Theory Comput., 2010, 6, 3713–3720 CrossRef CAS.
- M. H. Ghatee and A. R. Zolghadr, Fluid Phase Equilib., 2008, 263, 168 CrossRef CAS.
- M. H. Ghatee and H. Ghazipour, Fluid Phase Equilib., 2014, 377, 76 CrossRef CAS.
- A. Seelig and J. Seelig, Biochemistry, 1974, 13, 4839–4845 CrossRef CAS PubMed.
- I. Vorobyov, T. E. Olson, J. H. Kim, R. E. Koeppe, O. S. Andersen and T. W. Allen, Biophys. J., 2014, 106, 586–597 CrossRef CAS PubMed.
- G. Frens, Controlled nucleation for the regulation of the particle size in monodisperse gold suspensions, Nature, 1973, 241(105), 20–22 CAS.
- S. Tatur, M. Maccarini, R. Barker, A. Nelson and G. Fragneto, Langmuir, 2013, 29, 6606–6614 CrossRef CAS PubMed.
Footnote |
| † Electronic supplementary information (ESI) available. See DOI: 10.1039/c8ra06777e |
| This journal is © The Royal Society of Chemistry 2019 |