 Open Access Article
Creative Commons Attribution 3.0 Unported Licence
The impact of humic acid on metaldehyde adsorption onto powdered activated carbon in aqueous solution†
Zhuojun Li a,
Yuchen Yangb,
Ulises Jáuregui-Haza
 c,
Zhengxiao Guo
 b and
Luiza Cintra Campos
 *a
*a
aDepartment of Civil, Environmental and Geomatic Engineering, University College London, Gower Street, London WC1E 6BT, UK. E-mail: zhuojun.li.09@ucl.ac.uk; l.campos@ucl.ac.uk; Tel: +44(0)-207-679-4162
bDepartment of Chemistry, University College London, Gower Street, London WC1E 6BT, UK. E-mail: yu.yang.13@ucl.ac.uk; x.guo@ucl.ac.uk
cInstituto Superior de Tecnologías y Ciencias Aplicadas (InSTEC), Universidad de La Habana, La Habana, CP 10600, Cuba. E-mail: ulises.jauregui@infomed.sld.cu
First published on 19th December 2018
Abstract
Metaldehyde has been detected in surface water and drinking water in the UK, exceeding the EU and UK standard of 0.1 μg L−1. The presence of natural organic matter (NOM) is considered to affect the removal efficiency of metaldehyde using traditional treatment methods such as adsorption by granular activated carbon. This paper selected humic acid (HA) to represent NOM and investigated the single and binary adsorption systems of metaldehyde and HA by powdered activated carbon (PAC). Metaldehyde was effectively removed by PAC in both systems. Since the percentage removal of metaldehyde was only 3% lower in the binary adsorption system, HA was therefore not considered as a significant compound competing with metaldehyde for adsorption sites on PAC. An adsorption equilibrium study and kinetic study for metaldehyde in a single system suggested that the Langmuir isotherm and the pseudo-second order kinetic model were more suitable in this case than the Freundlich isotherm and the pseudo-first order kinetic model. The two models revealed that the maximum adsorption capacity (qm) of metaldehyde by PAC was 28.3 mg g−1 and the adsorption rate (k2) was 0.16 g mg−1 min−1. The effect of pH of metaldehyde solution was also investigated in a single system. Higher percentage removal of metaldehyde was found under alkaline conditions. In contrast to metaldehyde, HA was not effectively and efficiently removed by PAC in both systems, even with higher PAC dosages and longer contact times. Hence, the microporous and mesoporous PAC was suitable for removing metaldehyde even in the binary system.
1. Introduction
Metaldehyde (C8H16O4), a highly polar organic compound and a cyclic tetramer of aldehyde (CH3CHO), is the active ingredient in 80% of slug repellents and it has been widely-used globally for agricultural purposes and gardening.1 Its IUPAC name is 2,4,6,8-tetramethyl-1,3,5,7-tetraoxocane and has a molecular mass of 176.21 g mol−1. The solubility of metaldehyde in water is 0.188 g L−1 at 20 °C.2 Its frequent release and persistence in natural water bodies has been polluting surface water resources, which can be used for drinking water. In fact, metaldehyde has been detected in some surface water (up to 8 μg L−1)3 and drinking water (1 μg L−1) which is considerably higher than the EU and UK standards of 0.1 μg L−1 for pesticides allowed in drinking water.4 Hence, it is of great significance to investigate and develop an effective treatment method to remove metaldehyde from water.Adsorption by activated carbon and advanced oxidation processes (AOPs) are the most common treatment methods to remove pesticides in water. Granular activated carbon (GAC) is a universally-used adsorbent for treating pollutants in water for its low price and efficient results. For example, GAC filtration is quite effective in removing pharmaceutical and personal care products such as paracetamol and caffeine.5 However, it is not effective in removing metaldehyde in water treatment plants due to the physiochemical properties of metaldehyde4 such as its low log octanol/water partition coefficient (Kow) of 0.12 at 20 °C![[thin space (1/6-em)]](https://www.rsc.org/images/entities/char_2009.gif) 2 that indicates low sorption potential.6 Advanced oxidation is a trending treatment method that often involves UV radiation and catalysts to break down organic pollutants into benign substances such as water and carbon dioxide. Autin et al. have shown that photocatalysis including UV/H2O2 and UV/TiO2 can degrade metaldehyde successfully, however this requires high energy input at a high cost.7 Therefore, a cost-effective treatment to remove metaldehyde from water is needed.
2 that indicates low sorption potential.6 Advanced oxidation is a trending treatment method that often involves UV radiation and catalysts to break down organic pollutants into benign substances such as water and carbon dioxide. Autin et al. have shown that photocatalysis including UV/H2O2 and UV/TiO2 can degrade metaldehyde successfully, however this requires high energy input at a high cost.7 Therefore, a cost-effective treatment to remove metaldehyde from water is needed.
Our previous research has shown that powdered activated carbon (PAC) can be an alternative adsorbent to GAC given its excellent ability of removing metaldehyde from water with high efficiency compared to photocatalysis using nanoparticles made in the National Chemical Laboratory, India.8 Due to the effective results of using PAC as adsorbent, it is worth further investigating the adsorption mechanism of metaldehyde onto PAC.
Regarding adsorption processes of pollutants such as metaldehyde in water, it is necessary to take background organic materials into account. Radian and Mishael argued that interactions between pollutant and dissolved organic matter (DOM) are significant concerning the fate of pollutants in the environment and in water treatment processes.9 Background organic matter also affects adsorbents such as GAC and PAC. Zadaka et al. indicated that removal of atrazine (the most commonly-used herbicide) by GAC was reduced by 20% in the presence of DOM.10 Research by Matsui et al. showed that the adsorption capacity of PAC would be significantly affected by the presence of natural organic matter (NOM).11 The presence of background organic matter has negative effects on removal of metaldehyde as well. For example, Autin et al. claimed that NOM molecules would block the active sites of the catalyst and subsequently inhibit the degradation process of metaldehyde and the presence of background organic matter would affect the adsorption system more than oxidation.7 Moreover, Nabeerasool et al. stated that removal efficiency of metaldehyde by electrochemical processes involving novel adsorbents was reduced due to competition for active binding sites with other organic components in high NOM peat water.12 Hence, the background concentration of organic matter may impact the adsorption of metaldehyde onto PAC.
This study investigated the adsorption of metaldehyde onto PAC with and without the presence of background organic matter, with a control study including adsorption of only organic matter onto PAC. Specifically, humic acid (HA) was selected to represent background organic matter in this study since it is not only a significant component of background organic matter but also a common contaminant in surface water.9 In fact, HA accounts for 50–90% of organic matter in surface water, especially water from terrestrial origins, where the typical concentration of HA in surface water is around 30 mg L−1.13 Removal of HA in the water treatment process is also essential because the residue of HA would lead to the formation of disinfection by-products (DBPs) such as trihalomethane compounds which are carcinogenic.14
Therefore, this paper aimed to study closely the single and binary adsorption systems of metaldehyde and HA onto PAC which contribute to the real application of PAC in water treatment plants. Mono-component solutions containing either metaldehyde or HA were used for single adsorption system study and multi-component solutions containing metaldehyde and HA were used for binary adsorption system study. The objectives were: (1) to investigate the effect of PAC dosage, time, and pH on adsorption of metaldehyde onto PAC in single system; (2) to study the effect of PAC dosage and time on adsorption of HA onto PAC in single system; (3) to evaluate the binary adsorption of metaldehyde and HA onto PAC, including varying the concentration of HA in the binary system and adsorption time.
2. Materials and methods
2.1 Materials
Powdered activated carbon used in this study is activated charcoal, DARCO®, 100 mesh particle size powder, purchased from Sigma-Aldrich. Metaldehyde PESTANAL and humic acid sodium salt (technical grade H16752) were also obtained from Sigma-Aldrich. HPLC grade methanol and HPLC grade dichloromethane (DCM) were purchased from Fisher Scientific.Stock solution of metaldehyde was prepared by dissolving 0.05 g metaldehyde PESTANAL in 100 mL HPLC grade methanol. Metaldehyde stock solution (100 mL of 500 mg L−1) can be stored between 1 and 10 °C for up to 1 year.3 HA stock solution was prepared by dissolving 0.5 g of humic acid sodium salt in 10 mL of NaOH (0.1 M). It was then stirred for 10 minutes before ultrapure water (MilliQ water) was added to make 500 mL of the total HA stock solution while its pH was adjusted to 7.0 by HCl (0.1 M). HA stock solution (500 mL at 1000 mg L−1) was then stirred again using a magnetic stirrer to ensure the HA was dissolved. After that, HA stock solution was filtered by 0.45 μm Whatman cellulose nitrate membrane filters to remove any remaining suspended solids.13,15 For each experiment, different amounts of metaldehyde stock solution and HA stock solution were diluted by MilliQ water to prepare corresponding sample solutions at different concentrations. The studied range of HA solution concentrations was from 3 mg L−1 to 90 mg L−1, while concentration of metaldehyde was fixed at 1 mg L−1, aiming to analyse the impact of different amounts of HA on removal of metaldehyde in the binary adsorption system.
2.2 Point of zero charge (pHpzc) of PAC
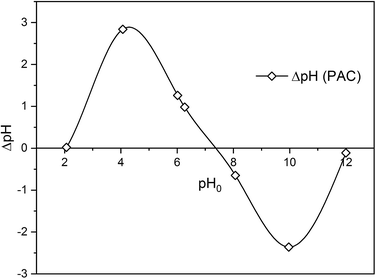
To study the mechanism of adsorption of metaldehyde onto PAC in single system, pHpzc is an essential factor to take into account. It determines the pH value where the electrical charge density on the surface of PAC is zero and this would contribute to the understanding of the surface chemistry involving interactions between metaldehyde molecules and electrons on the surface of PAC. The method of determining pHpzc of PAC follows the solid addition method.16 Seven 100 mL conical flasks with stoppers were filled with 50 mL of 0.1 M NaCl solution prepared from MilliQ water. For six of them, the initial pH values (pH0) of the solutions were adjusted using either 0.1 M HCl or 0.1 M NaOH to pH values of 2, 4, 6, 8, 10, and 12. And for one of them, pH0 was not adjusted and kept as the original pH of NaCl solution which was 6.27. After that, 0.06 g of PAC were added into each flask and mixed well with the NaCl solutions. These flasks were left to equilibrate for 48 hours with intermittent manual mixing. Finally, the final pH values (pH48) of the mixtures were recorded. The differences between pH0 and pH48 were calculated as ΔpH which were then plotted against pH0. Fig. 1 shows that the pHpzc of PAC which is 7.35 i.e. the point where ΔpH = 0.2.3 Adsorption experiments
To study the removal of metaldehyde from water using PAC in both systems, three sets of experiments were carried out. The percentage removal of pollutants, and the adsorbed amount of pollutants onto PAC were calculated using the following equations:13,16
 | (1) |
 | (2) |
 | (3) |
Eqn (1) describes the percentage removal of metaldehyde or HA from water where C0 is the initial concentration of adsorbate before treatment and Ce is the final concentration of adsorbate after treatment at equilibrium. Eqn (2) describes the amount of metaldehyde or HA adsorbed at equilibrium, where V is the volume of the solution and m is the mass of adsorbent. Eqn (3) is similar to eqn (2) where qt is the amount of metaldehyde or HA adsorbed at a specific time and Ct is the concentration of adsorbate at a specific time.
All experiments were performed as batch tests using a mono-component metaldehyde solution for single system study, a mono-component HA solution for single system study, and a multi-component solution containing metaldehyde and HA for binary system study, together with added PAC and consistent mixing by magnetic stirrer to ensure PAC was in contact with the solutions. Sample solution (3 mL) was taken and used as triplicates (1 mL per triplicate) and filtered through 0.45 μm Whatman cellulose nitrate membrane to remove suspended PAC from the solution at the end of the 2 hour experiments. For single adsorption of metaldehyde, PAC dosage, pH of the solution, and adsorption time were varied. For single adsorption of HA, PAC dosage and adsorption time were varied. For the binary adsorption of metaldehyde and HA, initial HA concentration and adsorption time were varied (details of adsorption experiment are provided in ESI†).
2.4 Analytical methods
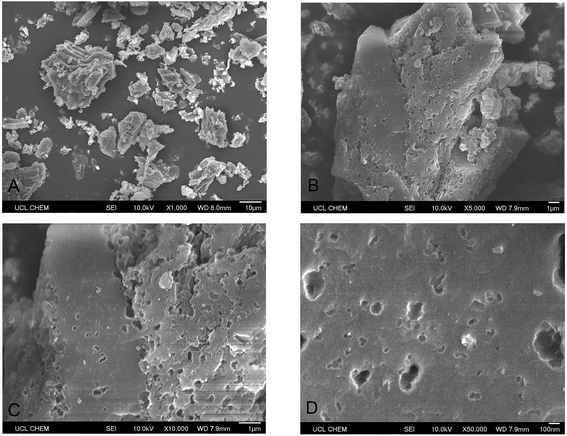
Metaldehyde was analysed by gas chromatography (Perkin Elmer precisely Clarus 500) with mass spectrometry (GC-MS), as recommended by the UK Environment Agency.3 Sample solutions containing metaldehyde were taken and analysed using the same solid phase extraction (SPE) and the GC-MS methods described in our previous research with a detection limit of metaldehyde from 1 to 5 μg L−1.8 The concentration of samples containing HA were determined by CamSpec M550 Double Beam Scanning UV-Vis Spectrophotometer at 254 nm. Sample solutions from binary adsorption tests containing both metaldehyde and HA were analysed by both methods to determine the concentrations of metaldehyde and HA separately. The presence of HA does not affect the detection of metaldehyde in the binary adsorption system and vice versa. pH values were measured by the pH meter SevenMulti, Mettler Toledo. Brunauer–Emmett–Teller (BET) specific surface area analysis of PAC was done by Autosorb-iQ2 automated gas sorption analyser (Quantachrome Instruments) via adsorption and desorption of nitrogen gas at 77 K after PAC sample being degassed at temperature of 180 °C for 24 hours. Scanning Electron Microscope (SEM) images of PAC were taken by JSM-6701F Field Emission Scanning Electron Microscope (JEOL) at 10 kV under secondary electron imaging mode (SEI).3. Results and discussion
3.1 PAC characterization
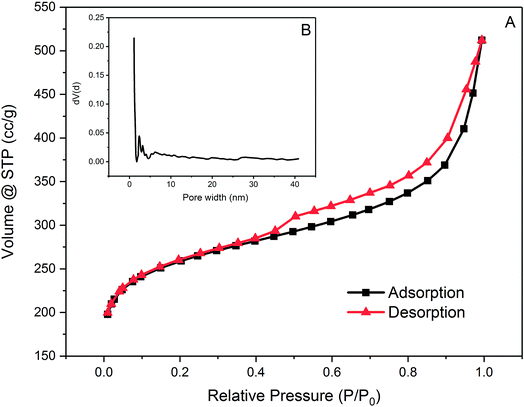 | ||
| Fig. 2 (A) Nitrogen adsorption and desorption isotherm of PAC at 77 K and (B) pore distribution of PAC. | ||
PAC is dominated by micropores which have pore widths smaller than 2 nm with abundant mesopores with pore widths between 2 nm and 5 nm. Regarding its pore size distribution, PAC is considered to be favourable for adsorption of small molecules such as metaldehyde for its large numbers of micro-and mesopores. However, for compounds which has a large and complex structure, such as HA, adsorption onto this PAC might not be as effective.
3.2 Removal of metaldehyde in single adsorption system
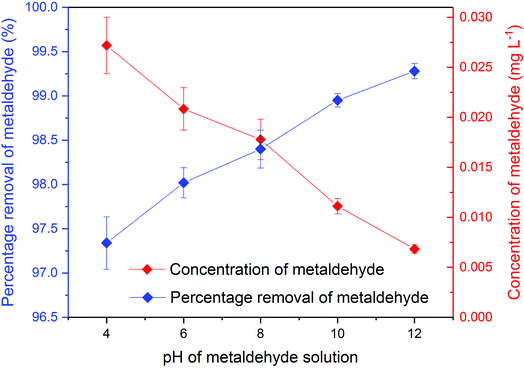 | ||
| Fig. 6 Concentration and percentage removal of 500 mL of 1 mg L−1 metaldehyde after 2 hour treatment using 0.05 g of PAC under different pH environments in single adsorption system. | ||
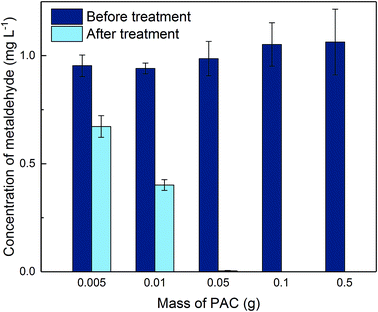
There were significant differences (p < 0.05) between concentrations of metaldehyde before and after 0.05 g dosages of PAC treatment at pH 4, 6, 8, 10, and 12. Removal of metaldehyde slightly increased from 97.4% to 99.3% as the pH increased from 4 to 12. This suggests that adsorption of metaldehyde onto PAC is favoured in an alkaline environment, which can be confirmed by the pHpzc of PAC at 7.35. The surface of PAC is negatively charged when the pH is higher than 7.35 and will interact with positively charged species and vice versa.18 Metaldehyde as a highly polar chemical with a positively charged surface will therefore prefer the negatively charged surface of PAC under a high pH environment.
The pseudo-first order model was proposed by Lagergren for a liquid–solid adsorption system which is based on solid capacity.19,20 It assumes that the adsorption rate is proportional to the difference of qt and qe, demonstrated by eqn (4) and (5) where k1 is the pseudo-first order kinetic rate constant.
 | (4) |
ln(qe − qt) = ln![[thin space (1/6-em)]](https://www.rsc.org/images/entities/char_2009.gif) qe − k1t qe − k1t
| (5) |
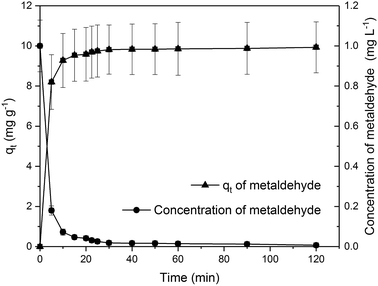
Experimental data were not well fitted to the pseudo-first order model with R2 = 0.6532 (Fig. 1 in ESI†). The calculated value of qe from this model was −2.527 mg g−1 and k1 was 0.0203 min−1. Although the negative value of qe clearly contradicted with the experimental value of qe = 9.932 mg g−1, the value of k1 suggests quite a fast adsorption rate. It is much higher than the k1 of 7.5 × 10⁻³ min−1 for adsorption of metaldehyde onto GAC stated by Salvestrini et al.21 This implies that the abundant mesopores in PAC facilitate the fast diffusion of metaldehyde molecules into micropores while GAC does not have large number of mesopores and micropores which assist the efficient diffusion.22
The pseudo-first order model can also be separated into two gradient stages from 0 minute to 30 minutes and from 30 minutes to 120 minutes which corresponds to fast adsorption and slow adsorption, respectively (Fig. 2 in ESI†). Data were better fitted with two stages (R0–30 min2 = 0.9031, R30–120 min2 = 0.9882). According to Li et al., for a chemically-controlled model, two gradients suggest two chemically different adsorption sites.23 For a diffusion-controlled model, two different rates imply different diffusion rates. The first rate (k1 = 0.0571 min−1) indicates a higher rate of diffusion via the easily accessed external adsorption sites and macropores. The second rate (k1 = 0.0053 min−1) which is much slower than the first one represents slower rate of diffusion via mesopores and micropores. For this model, they stated that the adsorption rate is determined by the pore diffusion rate.23 In this study, it is unlikely that PAC has two chemically different adsorption sites. Therefore, the adsorption of metaldehyde fitted into the pseudo-first order model can be best explained as diffusion-controlled.
The pseudo-second order equation24 describes the adsorption rates as proportional to the difference of qe and qt squared as shown by eqn (6) and (7) where k2 is the pseudo-second order kinetic rate constant.21 The pseudo-second order model assumes that the adsorption rate could be explained by the intraparticle diffusion model. It is limited by the rate of adsorbate diffusion inside the pores of adsorbent, and k2 is dependent on the initial adsorbate concentration and solid-solution ratio.25
 | (6) |
 | (7) |
Data were very well fitted to the pseudo-second model with R2 = 0.9999 (Fig. 3 in ESI†). Calculated qe from this model is 9.97 mg g−1 which is very close to the experimental value of 9.932 mg g−1. This confirms that the pseudo-second model is suitable for analysing these data, indicating that the intraparticle diffusion mechanism could probably dominate the adsorption process of metaldehyde onto the PAC in the study and the rate of direct adsorption which is regarded as surface reaction controls the adsorption kinetics.26 The value of k2 in this study is 0.16 g mg−1 min−1 which is much higher than the one obtained by Salvestrini et al.21 (8 × 10⁻⁵ g mg−1 min−1) using GAC, implying very fast adsorption rate of metaldehyde onto PAC.
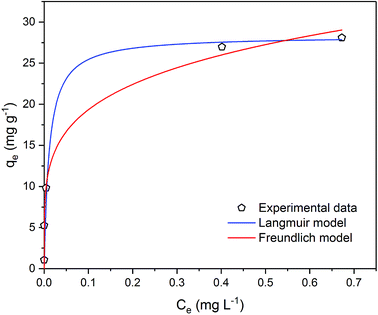 | ||
| Fig. 7 Metaldehyde adsorption equilibrium curve with Langmuir and Freundlich isotherm models fitted to experimental data in single adsorption system. | ||
It is very important to select the best fitted isotherm model to correlate the equilibrium curve shown in Fig. 7. Freundlich isotherm is generally used for heterogeneous adsorption systems. It predicts that the adsorbate concentrations on the adsorbent will increase given there is an increase of the adsorbate in the liquid. Eqn (8) and (9) describe the Freundlich isotherm model where 1/n is the heterogeneity factor (i.e. adsorption intensity) and KF is the Freundlich constant (i.e. adsorption capacity).16,19
| qe = KFCe1/n | (8) |
 | (9) |
Data were well fitted with R2 = 0.9966 (Fig. 4 in ESI†) and the fitting gave 1/n value of 0.211 (n = 4.732) and the KF value of 0.176 (mg g−1)/(mg L−1)1/n. As Kumar et al. stated that 1/n indicates the relative distribution of energy sites and the higher the 1/n, the higher the affinity is between adsorbate and adsorbent, and the adsorbent sites will be more heterogeneous.16 In this case, 21.1% of the active adsorption sites would have equal energy levels. A low value of 1/n such as 0.211 suggests that the affinity between the PAC used in our study and metaldehyde is low and the heterogeneity of PAC sites is low. As an indicator of adsorption capacity, the KF value obtained in this study is 0.176 (mg g−1)/(mg L−1)1/n, more than 10 times smaller than the one obtained by Kumar et al. around 2.5 (mg g−1)/(mg L−1)1/n.16 Kumar et al. argued that their high KF value suggests effective adsorption;16 therefore, the low KF value obtained in our study cannot explain the effective removal of metaldehyde by PAC in the experiment. The low 1/n value also suggests that the heterogeneity of the system is low, implying that Freundlich isotherm is not suitable for fitting the data.16
Langmuir isotherm is a commonly used model for adsorption studies with homogeneous surfaces. It assumes the existence of monolayer coverage of the adsorbate at the surface of the adsorbent. Therefore, the adsorbent has a maximum capacity for the adsorbate and once a saturation is reached, there will be no more adsorption.19 Eqn (10) and (11) describe Langmuir isotherm where KL (L mg−1) is the Langmuir constant, and qm (mg g−1) is the saturation/maximum adsorption capacity.
 | (10) |
 | (11) |
Data were very well fitted with R2 = 0.9994 (Fig. 5 in ESI†) and the fitting gave qm of 28.3 mg g−1 and KL of 88.3 L mg−1. The maximum adsorption capacity qm represents the saturation of the one molecule thick metaldehyde on the surface of PAC at equilibrium. KL correlates to the concentration where the amount of metaldehyde adsorbed onto PAC is equal to qm/2. A high KL value in this case indicates high affinity of metaldehyde to bind with PAC which can be confirmed by the effective removal of metaldehyde. Therefore, Langmuir isotherm is suitable for representing metaldehyde adsorption onto PAC.
Statistically, both Freundlich and Langmuir models were fitted to the experimental data using a non-linear regression algorithm27 which selects the best-fitting model based on the experimental data. The Akaike information criterion (AIC) method finds the best model considering the residual sum of squares (RSS) and the number of free parameters.28 In this study, AIC analysis confirmed that the Langmuir model is more suitable since it has a lower AIC value of 11.5 compared to the Freundlich model which has an AIC value of 13.1.
3.3 Removal of HA in single adsorption system
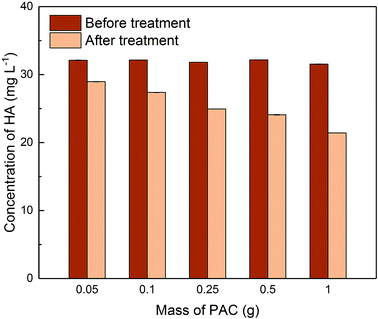
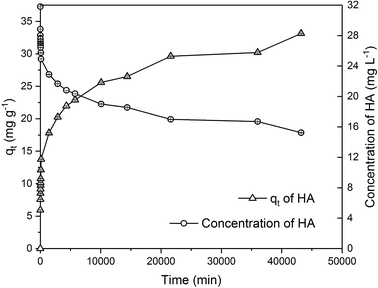
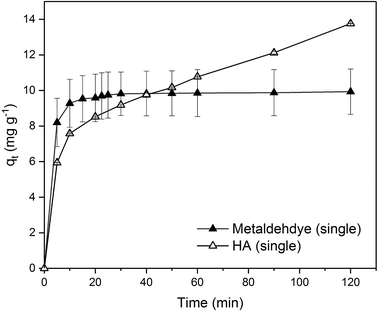
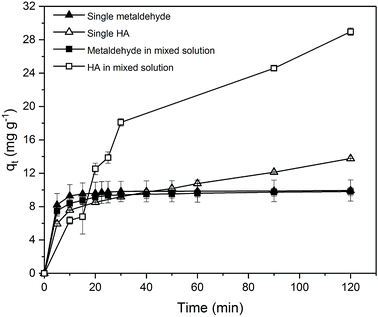
Due to the different behaviour of adsorption of HA and metaldehyde onto PAC over time, the first 120 minutes of HA adsorption curve was compared with that of metaldehyde in single adsorption system (Fig. 10). In the first 5 minutes, both HA and metaldehyde were rapidly adsorbed on PAC. However, after that, adsorption of metaldehyde slowed down significantly and trended towards equilibrium while adsorption of HA was not as fast over the first 5 minutes but kept increasing at a steady, slightly slower rate. Interestingly, the trend of the adsorption of HA onto PAC over the shorter time scale (from 0 minute to 120 minutes) was very similar to the trend over the longer time scale (from 0 minutes to 30 days).
Data were well fitted to the pseudo-second order kinetic model with R2 = 0.9918 (Fig. 6 in ESI†), suggesting that adsorption of HA onto the PAC used in this study could also be explained by the intraparticle diffusion model. Calculated qe is 31.65 mg g−1 while qt at the end of 30 days was found to be 33.14 mg g−1 which implies the system would have reached equilibrium with a qe of 31.65 mg g−1 in 30 days if the system followed the pseudo-second order model completely. The value of k2 is 4.23 × 10⁻⁵ g mg−1 min−1, indicating a very slow adsorption rate compared to that of metaldehyde.
To compare with other studies, it was argued by Capasso et al. that there was fast adsorption of HA onto zeolitic tuffs at first, then it reached pseudo steady-state in a few days; however, uptake of HA increased again and reached equilibrium in 2 months.29 The trend reported by them and the trend of HA adsorbed onto the PAC in this study share some similarities. Fig. 9 demonstrates that there was 29% removal of HA in the first day, and 50% removal of HA at 30 days in this study while Capasso et al. found 50% removal of HA on the first day and 96% removal of HA at the end of their experiment. They explained this two-step behaviour by the fact adsorption of HA has two routes and one of them occurs over a few days and another is relatively slower and occurs over a longer time period.29 This also seemed very similar to the diffusion controlled model of adsorption discussed in Section 3.2.4 that had two adsorption rates.
Moreover, Kołodziej et al. used modified activated carbons with different pHpzc for HA adsorption and suggested that adsorption of HA seems to favour adsorbents with relatively low or neutral pHpzc.30 In terms of kinetic analysis, Kołodziej et al. found qe was 32.89 mg g−1 for adsorption of brown HA onto hydrogen treated activated carbon using the pseudo-second order model which was very similar to 31.65 mg g−1 obtained in this study. However, their k2 value was 9.57 × 10⁻³ g mg−1 min−1, much higher than the k2 obtained in this study because adsorption of HA reached equilibrium in a shorter time in their study.30
3.4 Removal of metaldehyde and HA in binary adsorption system (competitive adsorption)
The pseudo-second order model was applied to adsorption of HA in the binary system (Fig. 9 in ESI†) with R2 = 0.8459. Calculated qe is 35.71 mg g−1 which is very close to the qe obtained for adsorption of HA onto PAC in single system and k2 is 7.84 × 10⁻⁴ g mg−1 min−1 which means adsorption of HA in the binary system is faster than that of the single system, implying the presence of metaldehyde would promote the adsorption of HA.
3.5 Adsorption mechanism of metaldehyde and HA
In general, the PAC used in this study as an adsorbent was very effective to remove metaldehyde from water, especially in the single adsorption system (Table 1 in ESI†). Combined with the BET analysis of PAC, effective removal of metaldehyde could be explained by the characteristics of the PAC used in this study. The specific surface area of the PAC is quite large which is 962 m2 g−1 and it is dominated by micropores with abundant mesopores present. According to Busquets et al., adsorption of metaldehyde could be greatly enhanced with carbon materials that are highly microporous with the presence of mesopores which could assist diffusive transport.22| Kinetic constants | ||
|---|---|---|
| The pseudo-first order constant k1 (min−1) | The pseudo-second order constant k2 (g mg−1 min−1) | |
| Metaldehyde (single) | 0.0203 | 0.16 |
| HA (single) | n/a | 4.23 × 10⁻⁵ |
| Metaldehyde (binary) | 0.0193 | 0.069 |
| HA (binary) | n/a | 7.84 × 10⁻⁴ |
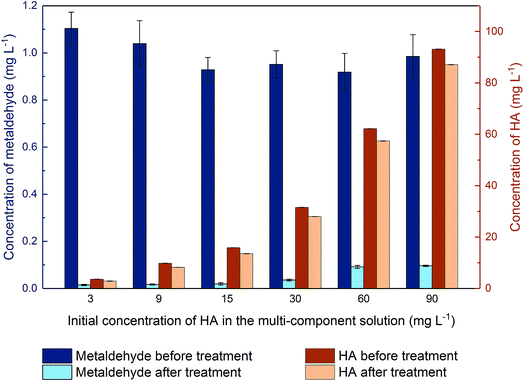
In this study, the average removal of metaldehyde in the binary system of metaldehyde (1 mg L−1) and HA (30 mg L−1) was around 97.5% by 100 mg L−1 PAC while removal of 25 mg L−1 metaldehyde in surface water and tap water is 94% by Nguyen et al.31 with the oxidation reaction using 100 mg L−1 graphene oxide and 1% H2O2 via modified Fenton's process. In both researches, the presence of HA only slightly affects the removal of metaldehyde. Nguyen et al.31 argued that this is due to the limited adsorption capacity of graphene oxide for DOM or the oxidation process takes place very quickly before the active sites of graphene oxide become occupied. In our study, compared to metaldehyde, HA was not effectively removed by the PAC used. Moreover, when increasing the proportion of HA in the binary system, the removal of metaldehyde was still only moderately affected. This could be explained by the pore structure of the PAC used. Micropores and mesopores are suitable for adsorbing small-sized compounds with a stable structure such as metaldehyde. On the other hand, HA is a large and complex compound with a variety of components which could not fit in the micropores of this PAC. The average 10–20% removal of HA could be explained by the attachment of HA to the surface and limited macrospores of PAC. Hence, regarding the removal of metaldehyde by the PAC used, HA is not considered as a competitive compound.
Table 1 demonstrates the kinetic constants analysed for metaldehyde and HA in both systems, and Table 2 shows the equilibrium study of metaldehyde in single adsorption system. A table of comparing adsorption capacities for metaldehyde, specific surface area, and adsorption efficiency of different adsorbents can be found in our previous research.8 In this study, the maximum adsorption capacity of PAC for metaldehyde was 28 mg g−1 which is much higher than the 15 mg g−1 of GAC used by Busquets et al.22 And the adsorption rate (k2) of 0.16 g mg−1 min−1 for metaldehyde in single system was much higher than 8 × 10⁻⁵ g mg−1 min−1 of GAC used by Salvestrini et al.,21 and 5.8 × 10⁻⁴ g mg−1 min−1 of GAC used by Tao and Fletcher32 which suggests that single adsorption of metaldehyde onto PAC is very fast. GAC has also been used in this study for adsorption of metaldehyde and HA to compare with PAC. It was found that the dosage of GAC required to remove the same amount of metaldehyde in single system was 10 times larger than PAC. Details of comparison are shown in Table 2 in the ESI.†
| Equilibrium isotherm constants | ||||
|---|---|---|---|---|
| Langmuir isotherm | Freundlich isotherm | |||
| KL (L mg−1) | qm (mg g−1) | KF (mg g−1)/(mg L−1)1/n | 1/n | |
| Parameter values | 88.3 | 28.3 | 0.176 | 0.211 |
| Residual sum of square (RSS) | 33.6 | 30.6 | ||
| Akaike information criterion (AIC) | 11.5 | 13.1 | ||
Additionally, k2 decreased to 0.069 g mg−1 min−1 for metaldehyde in binary system, indicating HA moderately affected the adsorption rate of metaldehyde in binary system and led to a delay for the system to reach equilibrium. Adsorption rates of HA were much slower than metaldehyde in both systems. However, it is interesting that the adsorption rate of HA in binary system (7.84 × 10⁻⁴ g mg−1 min−1) was higher than that of the single system (4.23 × 10⁻⁵ g mg−1 min−1). This suggests that in the binary system, metaldehyde promotes the adsorption rate of HA while HA would slow down the adsorption rate of metaldehyde.
4. Conclusion
Metaldehyde could be effectively removed from aqueous media by the PAC used in this study with a maximum adsorption capacity (qm) of 28.3 mg g−1 and it could reach equilibrium with an adsorption rate (k2) of 0.16 g mg−1 min−1. Adsorption of metaldehyde onto PAC with pHpzc of 7.35 was slightly more effective under alkaline conditions. HA could not effectively be removed by the investigated PAC with maximum percentage removal of 50% in 30 days using 30 mg L−1 HA solution and 0.25 g of PAC. Furthermore, it could take a very long time to reach equilibrium; presumably more than 30 days. The presence of HA in the binary system did not significantly affect the amount of metaldehyde adsorbed onto the PAC used in this study but it slowed down the adsorption rate of metaldehyde while speeding up the adsorption rate of HA. This could be explained by the fact that small metaldehyde molecules would prefer the abundant micropores and mesopores of PAC while large and complex HA would only attach to the surface of PAC or adsorbed onto the less common macropores of PAC. When two compounds appear in the same adsorption system, the system would seek to balance the adsorption rate of each compound. Adsorption of metaldehyde onto the PAC used in this study could be best described by the Langmuir isotherm model and pseudo-second order model, suggesting this adsorption process can be explained by the attachment of a single layer of metaldehyde molecule onto the surface of PAC and promoted by intraparticle diffusion. Understanding the adsorption mechanism of metaldehyde by PAC contributes to enhancing the application of PAC in water treatment plants. Since the presence of HA showed not affect the removal of metaldehyde in the binary system by PAC, there are many water treatment stages to choose from such as coagulation/flocculation and pre-ozonation to add PAC in. PAC could then be removed from a later stage such as sedimentation or filtration.Some aspects of this research are recommended to be further studied. The mechanism of interaction of pollutants with the surface groups of activated carbon is a complex phenomenon, especially when working with activated carbons with heterogeneous surface, as is the case of this work. The interactions depend on the nature of the contaminant (metaldehyde), and on the surface groups, as well as the state of their ionization, related with the pH of the medium. For that reason, the studies to explain the mechanisms of action of metaldehyde with surface groups are ongoing at this moment and the results will be published soon. In addition, possible desorption of metaldehyde from PAC back into water will be studied along with possible regeneration of PAC to investigate the number of cycles that PAC could be used before becoming exhausted. Moreover, natural water will be used instead of synthetic water in the next step of our research. Metaldehyde solution will be prepared using water from different stages at water treatment plant and the best stage to add PAC in the treatment process will be identified.
Conflicts of interest
There are no conflicts to declare.Acknowledgements
The authors thank the UCL’s Global Engagement Office for funding the research collaboration between the UCL-Civil, Environmental and Geomatic Engineering Department, UCL-Chemistry Department and the Instituto Superior de Tecnologías y Ciencias Aplicadas (InSTEC), Universidad de La Habana. Also, thanks to Mr Juntao Li, Mr Jian Guo, and Mr Zhuangnan Li for their help and consultation during this project. Finally, the authors thank Miss Yihang Yuan for collecting part of the data on removal of metaldehyde and HA by GAC during her MSc project for our research group.References
- G. D. Castle, G. A. Mills, A. Gravell, L. Jones, I. Townsend, D. G. Cameron and G. R. Fones, Environ. Sci.: Water Res. Technol., 2017, 3, 415–428 RSC.
- PPDB: Pesticide Properties DataBase, http://sitem.herts.ac.uk/aeru/ppdb/en/Reports/446.htm, (accessed 23rd January 2018, 2018).
- T. Cotterill, P. Cummings, J. Fothergill, S. Hickson, N. Hudson, G. Mills, M. Morgan, M. Pinchin, M. Rawlinson, S. Roberts, G. Telfer, A. Tonkin, S. Verik, P. Whittle and J. Williams, The determination of metaldehyde in waters using chromatography with mass spectrometric detection, UK Environment Agency, 2009 Search PubMed.
- J. Marshall, Briefing paper on metaldehyde, Water UK, 2013 Search PubMed.
- J. Li, Q. Zhou and L. C. Campos, Sci. Total Environ., 2018, 635, 1182–1190 CrossRef CAS PubMed.
- Y. Luo, W. Guo, H. H. Ngo, L. D. Nghiem, F. I. Hai, J. Zhang, S. Liang and X. C. Wang, Sci. Total Environ., 2014, 473–474, 619–641 CrossRef CAS PubMed.
- O. Autin, J. Hart, P. Jarvis, J. MacAdam, S. A. Parsons and B. Jefferson, Water Res., 2012, 46, 5655–5662 CrossRef CAS PubMed.
- Z. Li, J. K. Kim, V. Chaudhari, S. Mayadevi and L. C. Campos, Environ. Sci. Pollut. Res. Int., 2017, 24, 17861–17873 CrossRef CAS PubMed.
- A. Radian and Y. Mishael, Environ. Sci. Technol., 2012, 46, 6228–6235 CrossRef CAS PubMed.
- D. Zadaka, S. Nir, A. Radian and Y. G. Mishael, Water Res., 2009, 43, 677–683 CrossRef CAS PubMed.
- Y. Matsui, Y. Fukuda, T. Inoue and T. Matsushita, Water Res., 2003, 37, 4413–4424 CrossRef CAS PubMed.
- M. Nabeerasool, A. Campen, D. Polya, N. Brown and B. van Dongen, Water, 2015, 7, 3057–3071 CrossRef CAS.
- M. Wang, L. Liao, X. Zhang and Z. Li, Appl. Clay Sci., 2012, 67–68, 164–168 CrossRef CAS.
- K. Gopal, S. S. Tripathy, J. L. Bersillon and S. P. Dubey, J. Hazard. Mater., 2007, 140, 1–6 CrossRef CAS PubMed.
- J. K. Kim, J. Alajmy, A. C. Borges, J. C. Joo, H. Ahn and L. C. Campos, Water, Air, & Soil Pollution, 2013, p. 224 Search PubMed.
- A. Kumar, B. Prasad and I. M. Mishra, J. Hazard. Mater., 2008, 152, 589–600 CrossRef CAS PubMed.
- R. C. Gupta, Veterinary Toxicology: Basic and Clinical Principles, Elsevier, 2012 Search PubMed.
- N. Fiol and I. Villaescusa, Environ. Chem. Lett., 2008, 7, 79–84 CrossRef.
- Y. C. Wong, Y. S. Szeto, W. H. Cheung and G. McKay, J. Appl. Polym. Sci., 2004, 92, 1633–1645 CrossRef CAS.
- S. Lagergren, K. Sven. Vetenskapsakad. Handl., 1898, 24, 1–39 Search PubMed.
- S. Salvestrini, P. Vanore, A. Bogush, S. Mayadevi and L. C. Campos, J. Water Reuse Desalin., 2017, 7, 280–287 CrossRef.
- R. Busquets, O. P. Kozynchenko, R. L. Whitby, S. R. Tennison and A. B. Cundy, Water Res., 2014, 61, 46–56 CrossRef CAS PubMed.
- P. H. Y. Li, R. L. Bruce and M. D. Hobday, J. Chem. Technol. Biotechnol., 1999, 74, 55–59 CrossRef CAS.
- Y. S. Ho and G. McKay, Process Biochem., 1999, 34, 451–465 CrossRef CAS.
- W. Plazinski, J. Dziuba and W. Rudzinski, Adsorption, 2013, 19, 1055–1064 CrossRef CAS.
- W. Plazinski, W. Rudzinski and A. Plazinska, Adv. Colloid Interface Sci., 2009, 152, 2–13 CrossRef CAS PubMed.
- I. Quesada-Peñate, C. Julcour-Lebigue, U.-J. Jáuregui-Haza, A.-M. Wilhelm and H. Delmas, Chem. Eng. J., 2009, 152, 183–188 CrossRef.
- H. Akaike, IEEE Trans. Autom. Control, 1974, 19, 716–723 CrossRef.
- S. Capasso, E. Coppola, P. Iovino, S. Salvestrini and C. Colella, Microporous Mesoporous Mater., 2007, 105, 324–328 CrossRef CAS.
- A. Kołodziej, M. Fuentes, R. Baigorri, E. Lorenc-Grabowska, J. M. García-Mina, P. Burg and G. Gryglewicz, Adsorption, 2014, 20, 667–675 CrossRef.
- L. V. Nguyen, R. Busquets, S. Ray and A. B. Cundy, Chem. Eng. J., 2017, 307, 159–167 CrossRef CAS.
- B. Tao and A. J. Fletcher, J. Hazard. Mater., 2013, 244–245, 240–250 CrossRef CAS PubMed.
Footnote |
| † Electronic supplementary information (ESI) available. See DOI: 10.1039/c8ra06802j |
| This journal is © The Royal Society of Chemistry 2019 |

