 Open Access Article
Creative Commons Attribution 3.0 Unported Licence
Synthesis and characterization of methylammonium phosphates as crystalline approximants for anhydrous, low melting phosphate glasses†
Martin Mangstl a,
Jan Konrad Wieda,
Johannes Weber
 a,
Christian Pritzelb,
Reinhard Trettinb and
Jörn Schmedt auf der Günne
 *a
*a
aInorganic Materials Chemistry, Universität Siegen, Adolf-Reichwein-Straße 2, 57076 Siegen, Germany. E-mail: gunnej@chemie.uni-siegen.de
bInstitute for Building and Materials Chemistry, Universität Siegen, Paul-Bonatz-Straße 9-11, 57076 Siegen, Germany
First published on 15th January 2019
Abstract
Low-melting methylammonium phosphate glasses are synthesized from crystalline starting agents. To this end crystalline tris(methylammonium) cyclotriphosphate [CH3NH3]3P3O9, was synthesized by a novel and simple synthesis route from P4O10 and N-methylformamide. It, undergoes an irreversible phase transition to methylammonium catena-polyphosphate [CH3NH3]PO3. The crystal structure of the catena-polyphosphate was solved and refined from X-ray powder diffraction data by the Rietveld method using constraints obtained by solid-state 31P and 1H NMR spectroscopy. This compound crystallizes in a triclinic space group with a = 13.2236(9), b = 7.8924(6), c = 4.6553(2) Å, α = 91.068(4), β = 87.840(5) and γ = 106.550(3)°. Quantum chemical calculations confirm that the obtained structure lies at an energetic minimum. Finally the reaction of tris(methylammonium) cyclotriphosphate and P4O10 into methylammonium phosphate glass is presented. The synthesized, water-free phosphate glass shows a very low glass transition temperature Tg of 33 °C, which was verified by dynamic scanning calorimetry and NMR. The chain-like crystal structure of the high-temperature methylammoniumphosphate [CH3NH3]PO3 serves as an approximation for the short-range order of the glass.
1. Introduction
Phosphate glasses find wide application in industry and medicine, for example as implant coatings, for tissue engineering,1–4 as optical materials5,6 and ionic-conducting materials.7,8 An application of glasses with low glass transition temperatures are glass seals.9–11 Glasses with extremely low glass transition temperatures would however open a much wider range of applications, for example enabling organic compounds as glass additives.Lower glass transitions should be achievable for a given glass former by increasing the ionic radius of the cation of the network modifier, which lowers its cationic field strength12 and thus the Coulomb interaction between anion and cation. Indeed for monovalent glasses, the decrease of the glass transition temperature Tg in the sequence LiPO3, AgPO3, RbPO3 and CsPO3 is correlated with the progressive increase in the ionic radius. This effect has been attributed especially to the Coulomb interaction between the cations and the non-bridging oxygen atoms, which are responsible for the cross-links between phosphate chains.13 The largest stable monovalent cation in the periodic table is Cs+. Complex cations based on methylammonium offer an even lower cationic field strength and are the subject of this contribution.
Synthesis of crystalline methylammonium phosphates which are required as starting agents cannot proceed via the routine high-temperature pathway, because methyl ammonium ions decompose under these conditions. Despite this complication ammonium phosphates including mono-, di-, tri- or tetramethylammoniumphosphate find widespread application: ammonium polyphosphates are used as flame-retardant additives for organic polymers and for intumescent coatings in industry.14,15 In polyphosphate fertilizers usually between 50 and 75% of the phosphorus content is present in chained polymers. Only the remaining orthophosphates (monophosphates) are available for immediate uptake and the polyphosphates (phosphate rings or chains formed by condensed orthophosphates) are reduced to smaller pieces by microorganisms over time. Therefore the fertilizing effect can be warranted for a longer time period.16,17 In food industry ammonium polyphosphate (E545) is used for instance as additive for processed cheese due to its emulsifying properties. In contrast to the ammonium catena-polyphosphate II18 no crystal structure of methylammonium catena-polyphosphate is reported in literature. Solely the structures of tris(methylammonium) cyclotriphosphate19,20 [CH3NH3]3P3O9 and tris(methylammonium) hydrogenphosphate dihydrogenphosphate21 are known. The first had been synthesized via the Boullé process22 which requires silver salts as starting material. A larger version of the ammonium ion is the tetrasubstituted tetramethylammonium ion [N(CH3)4]+, for which several phosphate phases23–25 and phase transitions26,27 between them have been observed. Methylammonium hydrogenphosphate (254.2 °C) and methylammonium formate (162.1 °C) have low decomposition temperatures.28 Thus for their synthesis in general low synthesis temperature are required, for example making use of solvents like dimethyl sulfoxide23,29 or water.
In this contribution the smaller but asymmetric methylammonium ion [CH3NH3]+ is explored as an alternative to the tetramethylammonium ion to produce low melting phosphate glasses. Their synthesis requires starting materials of high purity. To this end a cheaper route for crystalline, water-free, non-acidic methylammonium phosphates is sought. In this context the question, if N-methylformamide may act as source of the methylammonium ion in the synthesis, is tested.30
2. Experimental details
2.1 Sample preparation
All solid reagents were stored inside a glove box (MBraun, Garching, Germany) filled with dry argon. For synthesis of crystalline trismethylammonium cyclotriphosphate 7 mL N-methylformamide (Alfa Aesar, 99%) was added drop-wise under ice cooling to 1.0 mmol (284 mg) P4O10 (Sigma Aldrich, 99%). After reaching room temperature the solution was heated to 45 °C for 96 hours. The obtained product was precipitated and washed five times with acetonitrile (Chemsolute, 99.9%). In order to obtain crystalline methylammonium catena-polyphosphate 0.6 mmol (200 mg) trismethylammonium cyclotriphosphate were heated to 245(5) °C for 2 h inside a Teflon crucible within a Schlenk flask under vacuum and subsequently cooled down slowly (2 K min−1).For the synthesis of glassy methylammonium phosphate trismethylammonium cyclotriphosphate and P4O10 with different ratios were heated to 245(5) °C inside a Teflon crucible within a Schlenk flask under vacuum. After holding the temperature for 2 h the sample was cooled down fast by water quenching.
2.2 XRD measurements and refinements
Powder X-ray diffraction patterns were recorded at 298 K on a STOE Stadi P powder diffractometer (STOE, Darmstadt, Germany) in Debye–Scherrer geometry (capillary inner diameter: 0.48 mm) by using Ge(111)-monochromated CuKα1 radiation (154.0593 pm) and a position-sensitive detector. Extraction of the peak positions and pattern indexing were carried out by using FOX package.31 For methylammonium catena-polyphosphate indexing by using a Le Bail extraction with a least-squares optimization yielded a triclinic unit cell with the best score for space group P![[1 with combining macron]](https://www.rsc.org/images/entities/char_0031_0304.gif) with a = 13.215 b = 7.887, c = 4.654 Å, α = 91.100, β = 87.899 and γ = 106.557°. All the likely space groups are subjected to a “multiple world simulation” within the FOX program (best 10 scores are shown in Table S1†). Structure solution was done with the method “parallel tempering”. The molecules were restrained in different ways: catena-polyphosphate units with the flexibility model “automatic from restraints, strict” and methylammonium units with the flexibility model “rigid bodies”. The molecules chosen reflect the prior knowledge concerning the NMR experiments. Rietveld refinement of the final structure model was realized by applying the fundamental parameter approach implemented in TOPAS (direct convolution of source emission profiles, axial instrument contributions, crystallite size and micro-strain effects).32,33
with a = 13.215 b = 7.887, c = 4.654 Å, α = 91.100, β = 87.899 and γ = 106.557°. All the likely space groups are subjected to a “multiple world simulation” within the FOX program (best 10 scores are shown in Table S1†). Structure solution was done with the method “parallel tempering”. The molecules were restrained in different ways: catena-polyphosphate units with the flexibility model “automatic from restraints, strict” and methylammonium units with the flexibility model “rigid bodies”. The molecules chosen reflect the prior knowledge concerning the NMR experiments. Rietveld refinement of the final structure model was realized by applying the fundamental parameter approach implemented in TOPAS (direct convolution of source emission profiles, axial instrument contributions, crystallite size and micro-strain effects).32,33
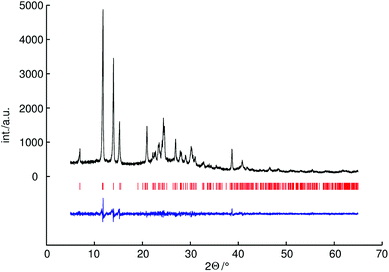
It is difficult to determine the hydrogen positions by powder X-ray diffraction because of the low scattering power of hydrogen atoms. Therefore the hydrogen positions were constrained based on neutron diffraction analysis data of a known methylammonium salt. For the methylammonium cation the bond lengths of C–H were constrained to 0.96 Å (as proposed by Sheldrick) and N–C–H angles to 109.6°, the bond lengths of N–H were constrained to 0.89 Å and C–N–H angles to 109.6°.21 For P–O distances soft restraints were used on the basis of an average values of known catena-polyphosphates (1.60 Å for bridging and 1.48 Å for terminal P–O distances).34,35 For C–N distances soft restraints were used on the basis of the crystal structure of methylammonium chloride (1.47 Å).36 The crystallographic data and further details of the data collection are given in Table 1. The experimental powder diffraction pattern, the difference profile of the Rietveld refinement and peak positions are shown in Fig. 1.
| a Estimated standard deviations are given in parentheses. | |
|---|---|
| Crystal structure data | |
| Formula | C2H12N2O6P2 |
| Formula mass/(g mol−1) | 222.075 |
| Crystal system | Triclinic |
| Space group | P![[1 with combining macron]](https://www.rsc.org/images/entities/char_0031_0304.gif) |
| a/Å | 13.2236(9) |
| b/Å | 7.8924(6) |
| c/Å | 4.6553(2) |
| α/° | 91.068(4) |
| β/° | 87.840(5) |
| γ/° | 106.550(3) |
| Cell volume/Å3 | 465.38(5) |
| Z | 2 |
| ρ/(g cm−3) calc. from XRD | 1.5848(2) |
| Data collection | |
| Diffractometer | Stoe Stadi P |
| Radiation, monochromator | CuKα1, λ = 154.06 pm, Ge(111) |
| Detector, internal step width/° | Linear PSD (Δ(2θ) = 5°), 0.01 |
| Temperature/K | 294(2) |
| 2θ range/° | 5.00–64.99 |
| Step width/° | 0.01 |
| Points | 6000 |
| Number of observed reflections | 342 |
| Structure refinement | |
| Structure refinement method | Fundamental parameter model33 |
| Program used | TOPAS-Academic 4.1 |
| Background function/parameters shifted | Chebyshev/16 |
| Number of atomic parameters | 42 |
| Number of profile and other parameters | 16 |
| Constraints/restraints | 46/10 |
| χ2 | 1.191 |
| Rp | 0.049 |
| wRp | 0.063 |
2.3 NMR measurements
For all solid-state NMR measurements the 1H resonance of 1% Si(CH3)4 in CDCl3 served as an external secondary reference using the Ξ values for 31P as reported by the IUPAC.37 All experiments used a saturation pulse comb in front of every repetition delay.The 1H and 31P solid-state NMR spectra were measured on a Bruker Avance II spectrometer operating at the frequencies of 300.13 and 121.49 MHz, respectively (magnetic flux density B0 = 7.05 T). Magic angle sample spinning (MAS) was carried out with a McKay 4.0 mm MAS probe. The 31P–31P 2D double-quantum (DQ) single-quantum (SQ) correlation MAS NMR spectrum of trismethylammonium cyclotriphosphate was obtained at a sample spinning frequency of 12.5 kHz with a repetition delay of 36 s using a transient adapted PostC7 sequence38,39 with a conversion period of 0.64 ms and rotor-synchronized data sampling of the indirect dimension. It accumulated 32 transients per FID. Proton decoupling was implemented using CW decoupling with a nutation frequency of 100 kHz. The 31P–31P 2D double-quantum (DQ) single-quantum (SQ) correlation MAS NMR spectrum of methylammonium catena-polyphosphate was obtained at a sample spinning frequency of 12.5 kHz with a repetition delay of 16 s using a transient adapted PostC7 sequence with a conversion period of 1.28 ms and rotor-synchronized data sampling of the indirect dimension. It accumulated 32 transients per FID. The 31P MAS NMR spectrum of amorphous methylammonium phosphate was received at a sample spinning frequency of 12.5 kHz with a repetition delay of 32 s. The 31P–31P 2D double-quantum (DQ) single-quantum (SQ) correlation MAS NMR spectrum of amorphous methylammonium phosphate was acquired at a sample spinning frequency of 12.5 kHz with a repetition delay of 20 s using a transient adapted PostC7 sequence with a conversion period of 0.96 ms and rotor-synchronized data sampling of the indirect dimension. It accumulated 128 transients per FID. The variable temperature static 31P NMR spectra of amorphous methylammonium phosphate were measured between 273 and 383 K with a repetition delay of 24 s. Liquid state 1H and 13C measurements were carried out on a Jeol ECZ operating at the frequencies of 500.13 and 125.76 MHz, respectively (magnetic flux density B0 = 11.75 T).
2.4 Differential scanning calorimetry
Differential scanning calorimetry measurements were done on a Netzsch DSC 204 F1 Phoenix calorimeter (Netzsch-Gerätebau GmbH, Selb, Germany). For the glassy methylammonium phosphate 10.9 mg of the sample were sealed within an aluminum crucible inside a glove box under argon atmosphere. The measurements were carried out under nitrogen atmosphere (20 mL min−1) with a heating and cooling rate of 5 K min−1. For the determination of specific heat capacities CP (DIN 51007) sapphire was used as a standard.402.5 Computational chemistry
The atomic positions of the Rietveld refined unit cell of methylammonium catena-polyphosphate were relaxed under periodic boundary conditions by the Quantum ESPRESSO v.6.2 software.41,42 The input file for PWscf featured the usage of an energy cutoff of 80 Ry (1088 eV), and a Monkhorst–Pack43 like k-point mesh of 5 × 5 × 5 over the irreducible Brillouin zone, resulting in 63 k-points including the gamma point. All fractional atomic coordinates were allowed to relax freely without symmetry restrictions. Norm-conserving Troullier–Martins type44 pseudo potentials with PAW reconstruction45 (X.pbe-tm-new-gipaw-dc.UPF files, X = P, O, N, C, H) created by D. Ceresoli between 14 Sep 2009 and 25 May 2010 (ref. 46) were chosen, as we liked to calculate also NMR parameters. The PBE47,48 density functional was used, together with a nonempirical van der Waals correction term (VdW-DF49–52). The convergence threshold for self-consistency of the electronic wave function was set to 10−13 a.u., while the thresholds for the total energy and the atomic forces were set to 10−12 a.u. and 10−9 a.u., respectively. The cif2cell53 program was used to assist the input file generation. To obtain NMR parameters GIPAW calculations54,55 with standard setup (job = nmr, q_gipaw = 0.01, and spline_ps = .true.) were performed at the unrelaxed as well as at the relaxed structure. It turned out that the errors for calculated NMR parameters are too big for an unambiguous assignment of the phosphorus atoms.3. Results and discussion
In order to obtain phase pure starting materials for the glass synthesis we established a novel synthesis route for tris(methylammonium) cyclotriphosphate (see tentative reaction equation below). Subsequently its thermodynamical stable high temperature phase methylammonium catena-polyphosphate was characterized. Ultimately we present the synthesis and investigation of the low melting methylammonium phosphate glass.The reaction of N-methylformamide and P4O10 yielded a pale yellow powder which could be indexed within a monoclinic unit cell P21/n. The powder XRD pattern is in agreement with that of tris(methylammonium) cyclotriphosphate [CH3NH3]3 P3O9.19
Solution NMR spectra of N-methylformamide and P4O10 after the reaction show additional signals compared to the spectra for pure N-methylformamide. The 1H NMR signal at 8.3 ppm can be assigned to the formate anion and the signal at 2.2 ppm to the methylammonium cation. Furthermore the 13C signal at 165.8 ppm can be assigned to the formate anion and the signal at 24.5 ppm to the methylammonium cation.30,56 Additionally, the formation of carbon monoxide could be confirmed by using an electrochemical sensor (see ESI†). Thus, the total reaction for the synthesis of tris(methylammonium) cyclotriphosphate could be described by the following tentative reaction equation:
| 12CH3NHCOH + 6H2O + 3P4O10 → 4[CH3NH3]3 P3O9 + 12CO |
In the following the Qn nomenclature is used to describe phosphorus atoms within phosphate tetrahedron units.57,58 The variable n is defined as the number of bridging oxygen atoms which are connected to the observed phosphorus atom (n = 0–3). The homonuclear 31P MAS single-quantum (SQ) double-quantum (DQ) correlation spectrum (Fig. 2) shows that all three signals belong to the same crystalline phase because of the presence of three sets of DQ correlation peaks.
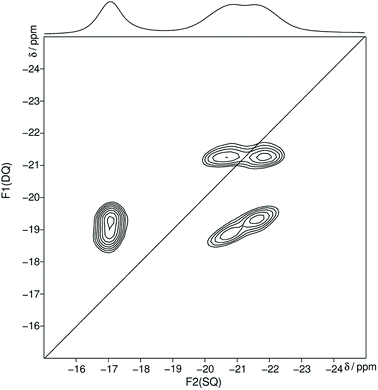 | ||
| Fig. 2 Homonuclear 31P–31P MAS NMR single-quantum double-quantum correlation spectrum of trismethylammonium cyclotriphosphate [CH3NH3]3P3O9 obtained at a sample spinning frequency of 12.5 kHz. The 1D projection at the top of the 2D spectrum stems from a separate one-pulse experiment (Fig. S1†). Correlation peaks are shown via contour plots. The diagonal line refers to the hypothetic peak position of two isochronous spins (autocorrelation diagonal). | ||
The obtained 31P isotropic chemical shift values δiso, peak areas A, spin–lattice relaxation times T1 and 31P anisotropic chemical shift values δaniso are shown in Table 2. These values as well as the correlation pattern are consistent with that of the published structure of the cyclotriphosphate.
| Peak 1 | Peak 2 | Peak 3 | |
|---|---|---|---|
| δiso/ppm | −17.1 | −20.7 | −21.7 |
| δaniso/ppm | −152 | −162 | −159 |
| η | 0.33 | 0.26 | 0.43 |
| δ11/ppm | 50.1 | 47.5 | 53.9 |
| δ22/ppm | 16.7 | 19.4 | 8.4 |
| δ33/ppm | −118.1 | −129.0 | −127.4 |
| A/a.u. | 1.00 | 1.08 | 1.16 |
| T1/s | 28 | 29 | 28 |
After heating trismethylammonium cyclotriphosphate slightly above the melting point and subsequent slow cooling another crystalline phase was obtained. The structure of this phase could be characterized by X-ray diffraction and NMR spectroscopy. It was possible to solve and refine the structure from powder X-ray diffraction data by using constraints obtained by NMR spectroscopy. The homonuclear 31P MAS single-quantum (SQ) double-quantum (DQ) correlation spectrum (Fig. 3) indicates that these two signals must belong to the same crystalline phase because of their correlation peaks. The connectivity corresponding to the 2D spectrum is consistent with that of a catena-polyphosphate with a phosphate chain, which contains two different crystallographic orbits for the phosphorus atoms.
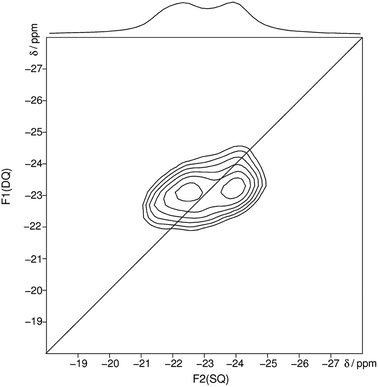 | ||
| Fig. 3 Homonuclear 31P–31P MAS NMR single-quantum double-quantum correlation spectrum of methylammonium catena-polyphosphate [CH3NH3]PO3 received at a sample spinning frequency of 12.5 kHz. The 1D projection at the top of the 2D spectrum stems from a separate one-pulse experiment (Fig. S2†). Correlation peaks are shown via contour plots. The diagonal line refers to the hypothetic peak position of two isochronous spins (autocorrelation diagonal). | ||
The received 31P isotropic chemical shift values δiso, peak areas A, spin–lattice relaxation times T1 and 31P anisotropic chemical shift values δaniso are shown in Table 3. A minor amorphous side phase can be observed at −12 ppm which differs clearly in T1 relaxation time (9 s) and full width half maximum from peak 1 and 2 (Fig. S2†). 31P NMR gives evidence of two P-sites with equal frequency. The chemical shift anisotropy is typical for Q2 phosphates.
| Peak 1 | Peak 2 | |
|---|---|---|
| δiso/ppm | −22.2 | −23.8 |
| δaniso/ppm | −141 | −143 |
| η | 0.43 | 0.59 |
| δ11/ppm | 45.0 | 52.0 |
| δ22/ppm | 4.6 | −4.3 |
| δ33/ppm | −116.2 | −119.1 |
| A/a.u. | 2.09 | 1.92 |
| T1/s | 48 | 50 |
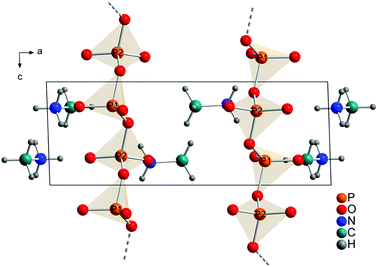
The technical process of how to obtain the crystal structure is described in the Experimental part. All observed reflections were indexed with one crystalline phase on the basis of triclinic unit cell. A Rietveld refinement was then performed in space group P![[1 with combining macron]](https://www.rsc.org/images/entities/char_0031_0304.gif) with a structure model that contained 2 phosphorus, 6 oxygen, 2 nitrogen, 2 carbon and 12 hydrogen atoms in the asymmetric unit (Fig. 4). This solution is in agreement with the results from XRD, NMR and quantum chemical calculations.
with a structure model that contained 2 phosphorus, 6 oxygen, 2 nitrogen, 2 carbon and 12 hydrogen atoms in the asymmetric unit (Fig. 4). This solution is in agreement with the results from XRD, NMR and quantum chemical calculations.
Each P-atom (Q2) is connected via 2 bridging O-atoms to the neighboring P-atom through the whole structure. The methylammonium molecules are located in the empty space between this polyphosphate chains. The orientation of the methylammonium molecules is influenced by hydrogen bonds between hydrogen atoms attached to nitrogen and non-bridging oxygen atoms of the phosphate chains. For atom N1 two moderate and three weak hydrogen bonds (Fig. S9/S10 and Tables S4/S5†) and for N2 three moderate hydrogen bonds can be observed (Fig. S11/S12 and Tables S4/S5†).59,60 On the contrary the orientation of the hydrogen atoms attached to the carbon atom is dominated by intramolecular interactions (staggered conformation). In comparison the hydrogen bond distances are shorter for the calculated than for the experimental structure. This can be explained with the relatively short constrained bond distance for N–H within the experimental structure. Relevant bond distances for hydrogen bonding are given in Tables S4 and S5.† Bridging P–O–P bonds show bigger P–O distances than terminal P–O bonds, as expected. The lengths of the bridging P–O–P bonds are between 1.60(1) and 1.64(2) Å, while the terminal P–O bonds vary between 1.47(1) and 1.50(1) Å. The O–P–O angles vary between 97.9(7) and 129.0(5)° which also represent reasonable values. The arrangement of the phosphate tetrahedron within the phosphate chains shows analogy with (KPO3)n.61
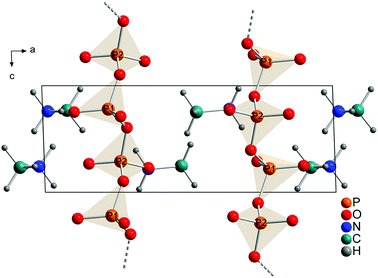
The comparison of the calculated (Fig. 5) and the refined structure (Fig. 4) shows only minor deviations for bond angles and lengths within the phosphate chains and for the orientations of the methylammonium molecules. Fractional coordinates and selected bond distances are given in Tables S2 and S3.† Similarly the diffraction pattern of the measured and the calculated structures show only minor differences (Fig. S3†).
A comparison of crystalline chain-phosphates of the alkali metals shows an increase of the coordination number as determined with the help of the Voronoi polyhedra of the cations from 7–8 for LiPO3 (ICSD collection code 51630) to 8–12 RbPO3 (ICSD collection codes 74736, 70035). The newly found crystal structure of [CH3NH3]PO3 fits into this pattern, which is also known as Pauling's first rule, with a coordination number of 11–12.
If crystalline trismethylammonium cyclotriphosphate is molten together with P4O10 and subsequently quenched an X-ray amorphous compound is obtained. The X-ray powder diffraction pattern (Fig. S4†) shows only 2 broad reflexes in the low angle regime which is consistent with the presence of a glass.
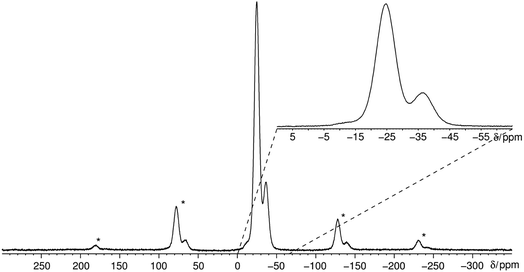
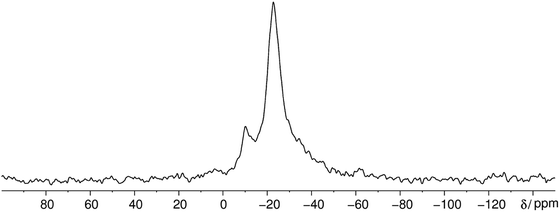
The 31P MAS NMR spectrum (Fig. 6) shows a signal at −24.7 ppm which can be assigned to a Q2 phosphate and a signal at −36.7 ppm which can be assigned to a Q3 phosphate. The full width half maximum of the observed peaks is relatively broad (850 Hz) which is consistent with the presence of a glassy phosphate which consists mainly out of Q2 and Q3 phosphate units (peak areas Q2![[thin space (1/6-em)]](https://www.rsc.org/images/entities/char_2009.gif) :
:![[thin space (1/6-em)]](https://www.rsc.org/images/entities/char_2009.gif) Q3 = 5
Q3 = 5![[thin space (1/6-em)]](https://www.rsc.org/images/entities/char_2009.gif) :
:![[thin space (1/6-em)]](https://www.rsc.org/images/entities/char_2009.gif) 1). Note that there is no signal at −45 ppm which means that P4O10 reacts quantitatively. The obtained 31P isotropic chemical shift values δiso, peak areas A, spin–lattice relaxation times T1 and 31P anisotropic chemical shift values δaniso are shown in Table 4. The homonuclear 31P MAS single-quantum (SQ) double-quantum (DQ) correlation spectrum (Fig. 7) indicates that these two signals must belong to the same amorphous phase because of their correlation peaks. This correlation pattern as well as the peak areas are consistent with that of a polyphosphate which contains cross-linked phosphate chains. The lower the P4O10 content the lower the amount of cross-links between chains, which means the glass structure of pure trismethylammonium cyclotriphosphate should consist mostly of long chains as expected from its crystalline approximant,62,63 i.e. [CH3NH3]PO3.
1). Note that there is no signal at −45 ppm which means that P4O10 reacts quantitatively. The obtained 31P isotropic chemical shift values δiso, peak areas A, spin–lattice relaxation times T1 and 31P anisotropic chemical shift values δaniso are shown in Table 4. The homonuclear 31P MAS single-quantum (SQ) double-quantum (DQ) correlation spectrum (Fig. 7) indicates that these two signals must belong to the same amorphous phase because of their correlation peaks. This correlation pattern as well as the peak areas are consistent with that of a polyphosphate which contains cross-linked phosphate chains. The lower the P4O10 content the lower the amount of cross-links between chains, which means the glass structure of pure trismethylammonium cyclotriphosphate should consist mostly of long chains as expected from its crystalline approximant,62,63 i.e. [CH3NH3]PO3.
| Peak 1 | Peak 2 | |
|---|---|---|
| δiso/ppm | −24.7 | −36.7 |
| δaniso/ppm | −147 | −133 |
| η | 0.40 | 0.16 |
| δ11/ppm | 43.7 | 14.9 |
| δ22/ppm | 4.6 | 0.7 |
| δ33/ppm | −122.4 | −125.6 |
| A/a.u. | 5.08 | 1 |
| T1/s | 16 | 16 |
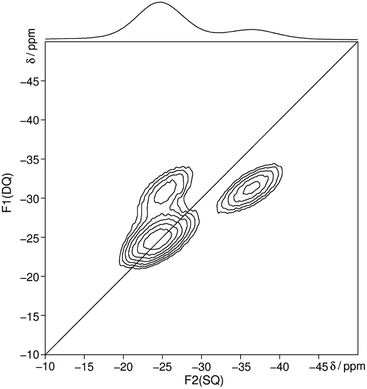 | ||
| Fig. 7 Homonuclear 31P–31P MAS NMR single-quantum double-quantum correlation spectrum of methylammonium phosphate glass of the composition 3.11 [CH3NH3]3P3O9·P4O10 recorded at a sample spinning frequency of 12.5 kHz. The 1D projection at the top of the 2D spectrum stems from a separate one-pulse experiment (Fig. 6). Correlation peaks are shown via contour plots. The diagonal line refers to the hypothetic peak position of two isochronous spins (autocorrelation diagonal). | ||
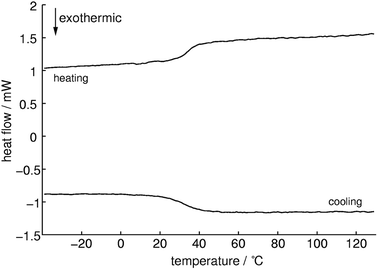
Differential scanning calorimetry measurements (Fig. 8) show an endothermic signal with an onset temperature of 33 °C during heating which can be assigned to a glass transition. Whereas cooling approximately at the same temperature an exothermic process occurs which is indicating a reversible process. This could be confirmed with successive measurements which showed almost the same results (1st: 32.9, 2nd: 32.5 and 3rd: 32.9 °C). The Tg of methylammonium phosphate glass is considerably lower than for CsPO3 glass (Tg = 240 °C).64 No signals for cold crystallization and subsequent melting could be observed which means that this compound tends not to crystallize. The quotient of the change in specific heat capacity and the heat capacity of the crystalline phase ΔCP/CP(cryst) is 0.4 ± 0.1 which is a relatively low value and therefore it can be expected that a fairly strong glass in the sense of Angell is formed.65
Static variable temperature 31P-NMR experiments show a sharp decrease of the second moment M2 at elevated temperatures. This decrease is indicative for an activation of rotational and translational degrees of freedom of the phosphate tetrahedron, which lead to motional averaging like in an isotropic liquid phase, as expected above the glass transition temperature. The activation energy for this process can be estimated by the Waugh–Fedin equation EA ≈ 1.617 × 10⁻³Tonset eV K−1 with an error of approximately 10% for Tonset which results in an activation energy EA of 0.52 ± 0.05 eV.66 The temperature Tonset is defined as the onset temperature (323 ± 32 K) for a decrease in the second moment M2 of the NMR spectrum during heating (Fig. 9).
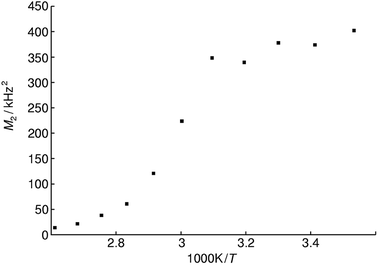 | ||
| Fig. 9 Plot of second moments M2 of the static 31P NMR line shape for methylammonium phosphate glass of the composition 4.14 [CH3NH3]3P3O9·P4O10 at various reciprocal temperatures. | ||
Interestingly the static 31P NMR spectrum obtained at 383 K shows 3 different signals at 383 K at approximately −10, −23 and −36 ppm (Fig. 10). Usually it is not possible to resolve different phosphorus environments with 31P NMR at elevated temperatures within phosphate glasses due to fast exchange as for instance in silver phosphate glass systems (unpublished results). Solely in aluminum phosphate glasses this finding is reported in literature where aluminum phosphate subunits are stable on the NMR timescale and lead to resolvable peaks.67 The vast majority of the phosphorus sites have a Q2 environment which is in agreement with the phase transition of the cyclophosphate into the catena-polyphosphate at elevated temperatures.
4. Conclusions
We could show that the crystal structure of trismethylammonium cyclotriphosphate undergoes a phase transition from space group P21/n to P![[1 with combining macron]](https://www.rsc.org/images/entities/char_0031_0304.gif) . Interestingly during this process the cyclic phosphate transforms into a catena-polyphosphate which is the thermodynamical stable phase at higher temperature. If the trismethylammonium cyclotriphosphate is reacted with P4O10 at elevated temperatures and fast subsequent cooling is applied, a glassy polyphosphate containing Q2 and Q3 phosphate environments can be obtained. This glass shows a low glass transition temperature Tg of 33 °C which enables the possibility to incorporate thermal sensitive compounds into the glass melt. Hence this can be especially interesting for embedding organic molecules. To the best of our knowledge this is the first binary phosphate glass system free of acidic protons which has a glass transition temperature below 40 °C. Such glasses are also interesting for fundamental studies about dynamic processes of the α-process of the glass transition in phosphate glasses, because the breaking of P–O–P bridges could be studied in situ by NMR.
. Interestingly during this process the cyclic phosphate transforms into a catena-polyphosphate which is the thermodynamical stable phase at higher temperature. If the trismethylammonium cyclotriphosphate is reacted with P4O10 at elevated temperatures and fast subsequent cooling is applied, a glassy polyphosphate containing Q2 and Q3 phosphate environments can be obtained. This glass shows a low glass transition temperature Tg of 33 °C which enables the possibility to incorporate thermal sensitive compounds into the glass melt. Hence this can be especially interesting for embedding organic molecules. To the best of our knowledge this is the first binary phosphate glass system free of acidic protons which has a glass transition temperature below 40 °C. Such glasses are also interesting for fundamental studies about dynamic processes of the α-process of the glass transition in phosphate glasses, because the breaking of P–O–P bridges could be studied in situ by NMR.
Conflicts of interest
There are no conflicts to declare.Acknowledgements
We want to acknowledge Max Müller for practical support and Dr Thomas Paululat for solution NMR spectroscopy measurements.References
- M. C. Kim, K. N. Kim, K. M. Kim, S. H. Choi, C. K. Kim, R. Z. LeGeros and Y. K. Lee, Key Eng. Mater., 2005, 284–286, 513–516 CAS.
- S. Pina, J. M. Oliveira and R. L. Reis, Adv. Mater., 2015, 27, 1143–1169 CrossRef CAS PubMed.
- L. L. Hench, J. Am. Ceram. Soc., 1998, 81, 1705–1728 CrossRef CAS.
- B. H. Lee, M. C. Kim, K. N. Kim, K. M. Kim, S. H. Choi, C. K. Kim, R. Z. LeGeros and Y. K. Lee, Key Eng. Mater., 2005, 284–286, 109–112 CAS.
- E. Buresi, J. Coutant, R. Dautray, M. Decroisette, B. Duborgel, P. Guillaneux, J. Launspach, P. Nelson, C. Patou and J. M. Reisse, et al., Laser Part. Beams, 1986, 4, 531–544 CrossRef CAS.
- W. J. Miniscalco, J. Lightwave Technol., 1991, 9, 234–250 CrossRef CAS.
- S. W. Martin, J. Am. Ceram. Soc., 1991, 74, 1767–1784 CrossRef CAS.
- M. Sayer and A. Mansingh, Phys. Rev. B: Solid State, 1972, 6, 4629–4643 CrossRef CAS.
- E. H. Oelkers and J.-M. Montel, Elements, 2008, 4, 113–116 CrossRef CAS.
- M. E. Dumesnil and L. Finkelstein, Low Melting Glass Composition, US Pat., US4743302A, 1988.
- J. A. Wilder, J. Non-Cryst. Solids, 1980, 38–39, 879–884 CrossRef CAS.
- S.-H. Kim and J.-S. Kim, Macromolecules, 2003, 36, 2382–2386 CrossRef CAS.
- J. Schneider, J. Tsuchida and H. Eckert, Phys. Chem. Chem. Phys., 2013, 15, 14328 RSC.
- E. D. Weil, J. Fire Sci., 2011, 29, 259–296 CrossRef CAS.
- M. Watanabe, M. Sakurai and M. Maeda, Phosphorus Res. Bull., 2009, 23, 35–44 CrossRef CAS.
- T. V. Kulakovskaya, V. M. Vagabov and I. S. Kulaev, Process Biochem. Int., 2012, 47, 1–10 CrossRef CAS.
- S. K. Ray, C. Varadachari and K. Ghosh, J. Agric. Food Chem., 1997, 45, 1447–1453 CrossRef CAS.
- B. Birke and J. Martin, Z. Anorg. Allg. Chem., 2004, 620, 931–935 Search PubMed.
- M. T. Averbuch-Pouchot, A. Durif and J. C. Guitel, Acta Crystallogr., Sect. C: Cryst. Struct. Commun., 1988, 44, 97–98 CrossRef.
- B. L. George, I. H. Joe and G. Aruldhas, J. Raman Spectrosc., 1992, 23, 417–419 CrossRef CAS.
- J. Fábry, R. Krupková, P. Vaněk and M. Dušek, Acta Crystallogr., Sect. C: Cryst. Struct. Commun., 2006, 62, o73–o75 CrossRef PubMed.
- A. Boullé, C. R. Hebd. Seances Acad. Sci., 1939, 206, 517–519 Search PubMed.
- M. Mangstl, V. R. Celinski, S. Johansson, J. Weber, F. An and J. Schmedt auf der Günne, Dalton Trans., 2014, 43, 10033–10039 RSC.
- K. Fujita, D. R. MacFarlane, K. Noguchi and H. Ohno, Acta Crystallogr., Sect. E: Struct. Rep. Online, 2009, 65, o797 CrossRef CAS PubMed.
- N. Ohama, M. Machida, T. Nakamura and Y. Kunifuji, Acta Crystallogr., Sect. C: Cryst. Struct. Commun., 1987, 43, 962–964 CrossRef.
- M. Mangstl, V. R. Celinski, C. Pritzel, R. Trettin and J. Schmedt auf der Günne, Z. Anorg. Allg. Chem., 2017, 643, 1609–1614 CrossRef CAS.
- M. Mangstl, J. Weber, D. Jardón-Álvarez, O. Burghaus, B. Roling and J. Schmedt auf der Günne, Chem.–Eur. J., 2018, 24, 8756–8759 CrossRef CAS PubMed.
- J.-P. Belieres and C. A. Angell, J. Phys. Chem. B, 2007, 111, 4926–4937 CrossRef CAS PubMed.
- S. Johansson, C. Kuhlmann, J. Weber, T. Paululat, C. Engelhard and J. Schmedt auf der Günne, Chem. Commun., 2018, 54, 7605–7608 RSC.
- J. Shamsi, A. L. Abdelhady, S. Accornero, M. Arciniegas, L. Goldoni, A. R. S. Kandada, A. Petrozza and L. Manna, ACS Energy Lett, 2016, 1, 1042–1048 CrossRef CAS PubMed.
- V. Favre-Nicolin and R. Černý, J. Appl. Crystallogr., 2002, 35, 734–743 CrossRef CAS.
- A. A. Coelho, TOPAS-Academic, Coelho Software, Brisbane, Australia, 2007 Search PubMed.
- J. Bergmann, R. Kleeberg, A. Haase and B. Breidenstein, Mater. Sci. Forum, 2000, 347–349, 303–308 CAS.
- K. V. Terebilenko, I. V. Zatovsky, I. V. Ogorodnyk, V. N. Baumer and N. S. Slobodyanik, Acta Crystallogr., Sect. E: Struct. Rep. Online, 2011, 67, i22 CrossRef CAS PubMed.
- A. McAdam, K. H. Jost and B. Beagley, Acta Crystallogr., Sect. B: Struct. Crystallogr. Cryst. Chem., 1968, 24, 1621–1622 CrossRef CAS.
- E. W. Hughes and W. N. Lipscomb, J. Am. Chem. Soc., 1946, 68, 1970–1975 CrossRef CAS.
- R. K. Harris, E. D. Becker, S. M. Cabral de Menezes, P. Granger, R. E. Hoffman and K. W. Zilm, Pure Appl. Chem., 2008, 80, 59–84 CAS.
- M. Hohwy, H. J. Jakobsen, M. Edén, M. H. Levitt and N. C. Nielsen, J. Chem. Phys., 1998, 108, 2686–2694 CrossRef CAS.
- J. Weber, M. Seemann and J. Schmedt auf der Günne, Solid State Nucl. Magn. Reson., 2012, 43–44, 42–50 CrossRef CAS PubMed.
- D. A. Ditmars, S. Ishihara, S. S. Chang, G. Bernstein and E. D. West, Bur. Stand. J. Res., 1982, 87, 159 CrossRef CAS.
- P. Giannozzi, S. Baroni, N. Bonini, M. Calandra, R. Car, C. Cavazzoni, D. Ceresoli, G. L. Chiarotti, M. Cococcioni and I. Dabo, et al., J. Phys.: Condens. Matter, 2009, 21, 395502 CrossRef PubMed.
- P. Giannozzi, O. Andreussi, T. Brumme, O. Bunau, M. B. Nardelli, M. Calandra, R. Car, C. Cavazzoni, D. Ceresoli and M. Cococcioni, et al., J. Phys.: Condens. Matter, 2017, 29, 465901 CrossRef CAS PubMed.
- H. J. Monkhorst and J. D. Pack, Phys. Rev. B: Solid State, 1976, 13, 5188–5192 CrossRef.
- N. Troullier and J. L. Martins, Phys. Rev. B: Condens. Matter Mater. Phys., 1991, 43, 1993–2006 CrossRef CAS.
- P. E. Blöchl, Phys. Rev. B: Condens. Matter Mater. Phys., 1994, 50, 17953–17979 CrossRef.
- Pseudopotentials – Davide Ceresoli, can be found under https://sites.google.com/site/dceresoli/pseudopotentials, 2018.
- J. P. Perdew, K. Burke and M. Ernzerhof, Phys. Rev. Lett., 1996, 77, 3865–3868 CrossRef CAS PubMed.
- J. P. Perdew, K. Burke and M. Ernzerhof, Phys. Rev. Lett., 1997, 78, 1396 CrossRef CAS.
- T. Thonhauser, V. R. Cooper, S. Li, A. Puzder, P. Hyldgaard and D. C. Langreth, Phys. Rev. B: Condens. Matter Mater. Phys., 2007, 76, 125112 CrossRef.
- D. C. Langreth, B. I. Lundqvist, S. D. Chakarova-Käck, V. R. Cooper, M. Dion, P. Hyldgaard, A. Kelkkanen, J. Kleis, L. Kong and S. Li, et al., J. Phys.: Condens. Matter, 2009, 21, 084203 CrossRef CAS PubMed.
- T. Thonhauser, S. Zuluaga, C. A. Arter, K. Berland, E. Schröder and P. Hyldgaard, Phys. Rev. Lett., 2015, 115, 136402 CrossRef CAS PubMed.
- K. Berland, V. R. Cooper, K. Lee, E. Schröder, T. Thonhauser, P. Hyldgaard and B. I. Lundqvist, Rep. Prog. Phys., 2015, 78, 066501 CrossRef PubMed.
- T. Björkman, Comput. Phys. Commun., 2011, 182, 1183–1186 CrossRef.
- C. J. Pickard and F. Mauri, Phys. Rev. B: Condens. Matter Mater. Phys., 2001, 63, 245101 CrossRef.
- C. Gervais, L. Bonhomme-Coury, F. Mauri, F. Babonneau and C. Bonhomme, Phys. Chem. Chem. Phys., 2009, 11, 6953–6961 RSC.
- R. J. Abraham, J. J. Byrne, L. Griffiths and M. Perez, Magn. Reson. Chem., 2006, 44, 491–509 CrossRef CAS PubMed.
- E. Lippmaa, M. Maegi, A. Samoson, G. Engelhardt and A. R. Grimmer, J. Am. Chem. Soc., 1980, 102, 4889–4893 CrossRef CAS.
- F. Liebau, Structure and Bonding in Crystals II, Academic Press, New York, 1981 Search PubMed.
- G. A. Jeffrey, An Introduction to Hydrogen Bonding, Oxford University Press, New York, 1997 Search PubMed.
- T. Steiner, Angew. Chem., Int. Ed., 2002, 41, 48–76 CrossRef CAS.
- K. H. Jost, Acta Crystallogr., 1963, 16, 623–626 CrossRef CAS.
- Handbook of Solid State Chemistry, ed. R. Dronskowski, S. Kikkawa and A. Stein, Wiley-VCH Verlag GmbH & Co. KGaA, Weinheim, 2017 Search PubMed.
- A. Hirata, Mater. Trans., 2018, 59, 1047–1050 CrossRef CAS.
- R. K. Brow, C. A. Click and T. M. Alam, J. Non-Cryst. Solids, 2000, 274, 9–16 CrossRef CAS.
- C. A. Angell, Science, 1995, 267, 1924–1935 CrossRef CAS PubMed.
- J. S. Waugh and E. I. Fedin, Soviet Physics – Solid State, 1963, 4, 1633–1636 Search PubMed.
- L. van Wüllen, S. Wegner and G. Tricot, J. Phys. Chem. B, 2007, 111, 7529–7534 CrossRef PubMed.
Footnote |
| † Electronic supplementary information (ESI) available. See DOI: 10.1039/c8ra07736c |
| This journal is © The Royal Society of Chemistry 2019 |

