 Open Access Article
Preparation and properties of long chain branched high-density polyethylene based on nano-SiO2 grafted glycidyl methacrylate
Lijin Xie,
Xiaokun Liang,
Hongwei Huang,
Le Yang,
Feng Zhang,
Xiaolong Li and
Zhu Luo *
*
College of Materials & Metallurgy, Guizhou University, Guiyang 550025, People's Republic of China. E-mail: luozhu2000@sina.com
First published on 9th January 2019
Abstract
A compounded nanoparticle with multiple double bonds (C![[double bond, length as m-dash]](https://www.rsc.org/images/entities/char_e001.gif) C) was prepared by grafting glycidyl methacrylate (GMA) onto the surface of nano-SiO2. Then gel-free long chain branched polyethylene (LCBPE) was prepared by melt branching reaction in a Haake torque rheometer in the presence of initiator peroxide and GMA grafted nano-SiO2 (SiO2-g-GMA). The sampling time corresponded to the summit of the reaction peak in the torque curve. Fourier transform infrared results indicated that SiO2-g-GMA had been grafted onto the HDPE backbone via radical reaction. The reaction mechanism and the topological structure of the PE products are also discussed. Rheological results showed that the relaxation time and molecular weight distribution of modified PE were increased owing to the introduction of LCB structure, and the more SiO2-g-GMA was added, the more apparent variation could be observed. Compared with linear HDPE, both the melt strength and mechanical properties of LCBPE were improved obviously. From the differential scanning calorimetry and polarized optical microscopy results, smaller crystal size and lower growth rate were observed compared with linear HDPE, which are ascribed to the nucleation and restriction of long branching chains in the system. Well distributed nano-SiO2 without any agglomeration in the PE matrix was observed in the scanning electron microscope images when the SiO2-g-GMA content was less than 3 phr.
C) was prepared by grafting glycidyl methacrylate (GMA) onto the surface of nano-SiO2. Then gel-free long chain branched polyethylene (LCBPE) was prepared by melt branching reaction in a Haake torque rheometer in the presence of initiator peroxide and GMA grafted nano-SiO2 (SiO2-g-GMA). The sampling time corresponded to the summit of the reaction peak in the torque curve. Fourier transform infrared results indicated that SiO2-g-GMA had been grafted onto the HDPE backbone via radical reaction. The reaction mechanism and the topological structure of the PE products are also discussed. Rheological results showed that the relaxation time and molecular weight distribution of modified PE were increased owing to the introduction of LCB structure, and the more SiO2-g-GMA was added, the more apparent variation could be observed. Compared with linear HDPE, both the melt strength and mechanical properties of LCBPE were improved obviously. From the differential scanning calorimetry and polarized optical microscopy results, smaller crystal size and lower growth rate were observed compared with linear HDPE, which are ascribed to the nucleation and restriction of long branching chains in the system. Well distributed nano-SiO2 without any agglomeration in the PE matrix was observed in the scanning electron microscope images when the SiO2-g-GMA content was less than 3 phr.
1. Introduction
High-density polyethylene (HDPE) is one of the most widely used semi-crystalline polymers in our daily life owing to its many desirable and beneficial physical properties, such as good chemical resistance and mechanical strength.1,2 Compared with low-density polyethylene (LDPE) and linear low-density polyethylene (LLDPE),3 HDPE has excellent mechanical properties. However, HDPE is almost entirely composed of linear macromolecules, without any long branching chains, which makes it exhibit low melt strength in the melt state.4 Therefore, it is difficult to use ordinary commercial polyethylene in processes such as thermoforming and extrusion foaming, where entanglement properties and melt strength are dominant, owing to its linear structure and poor melt strength.5Introduction of long chain branched (LCB)6 structure into HDPE is the most efficient means to improve its melt properties. Previously, several methods have been devised to produce long chain branched polyethylene (LCBPE), mainly including in situ polymerization in a reactor,7–9 high energy irradiation10,11 and melt radical grafting.12–14 Usually, LCBPE is produced by free radical reaction with multifunctional monomers initiated by high energy rays or peroxide initiator.15 Owing to the high reactivity of the polyfunctional monomers, cross-linking of the PE is easily caused, which is not favorable for the subsequent processing. Monofunctional monomers do not produce gels, but they are unable to act as a branching center to produce branching PE, just grafted with PE. While the timing of branching reaction initiated by peroxide is very important for obtaining long chain branched polyethylene with low gel content, in previous studies the reaction time was arbitrarily set in the modification of HDPE to prepare LCBPE through melt-grafting, and so it was hard to obtain a sample with moderate LCB and no gel.16–18
The LCB topological structure can affect not only the rheological properties but also the crystallization properties of a crystalline polymer.19 There have been many studies on the crystallization of long chain branched polypropylene (LCBPP).20,21 However, there have been few publications concerning the crystallization behavior of LCBPE.
The production and application of HDPE materials have continuously expanded via compounding with nano-sized inorganic particles. Nano-SiO2, with a size range of 1 to 100 nm, possesses many unique properties. It has wide application prospects in the new material field and shows no harmful effects on the environment.22 The research of Masao Sumita et al. showed that extremely small particles, comparable in the size to the LDPE crystalline region, had a prominent reinforcing effect on the oriented polymer matrix.23 This filler size effect may be applied to other composites of any crystalline polymers. Meanwhile, Rui-Juan Zhou and others suggested that the fracture toughness of polyolefin material was improved by the addition of surface-treated SiO2 nanoparticles with different alkyl chain length, owing to the plasticization of alkyl chains in the particle–matrix interphase reducing the stiffness of boundary layers.24–26 So far, nano-SiO2 has mainly been applied to improve the crystallization behavior and mechanical properties of polyethylene. However, reports cannot be found about application of nano-SiO2 changing the topological structure of polyethylene molecular chains.
In this work, the hydroxyl groups on the surface of nano-SiO2 particles are able to react with the epoxy groups in glycidyl methacrylate (GMA) in the presence of SnCl2 as catalyst; thus the double bonds (C![[double bond, length as m-dash]](https://www.rsc.org/images/entities/char_e001.gif) C) in GMA could be grafted onto nano-silica and complex nanoparticles obtained.27 The complex nanoparticles with C
C) in GMA could be grafted onto nano-silica and complex nanoparticles obtained.27 The complex nanoparticles with C![[double bond, length as m-dash]](https://www.rsc.org/images/entities/char_e001.gif) C can react with HDPE in the presence of DCP, which can change the topological structure of HDPE to produce long branching chains and improve the mechanical properties and enhance the melt strength. In addition, the optimum reaction time was determined corresponding to the summit of reaction peak in the torque curve, so the best condition of the product was obtained and gel formation was avoided. This work may provide a new method for the application of inorganic nanoparticles to improve the processing performance of HDPE in specific applications such as thermoforming and extrusion foaming.
C can react with HDPE in the presence of DCP, which can change the topological structure of HDPE to produce long branching chains and improve the mechanical properties and enhance the melt strength. In addition, the optimum reaction time was determined corresponding to the summit of reaction peak in the torque curve, so the best condition of the product was obtained and gel formation was avoided. This work may provide a new method for the application of inorganic nanoparticles to improve the processing performance of HDPE in specific applications such as thermoforming and extrusion foaming.
2. Experimental section
2.1 Materials
Nano-silicon dioxide (SiO2) with 20 nm average particle size was supplied by Hangzhou Wanjing New Material Corporation, Hangzhou, China. HDPE pellets (5000 S) were obtained from Lanzhou Petrochemical Corporation, Lanzhou, China. Glycidyl methacrylate (GMA) was supplied by Guangzhou Liga Trading Co., Guangzhou, China. Stannous chloride (SnCl2) was purchased from Chengdu Jinshan Chemical Reagent Co., Sichuan, China. Xylene, acetone and absolute ethyl alcohol (analytically pure) were all obtained from Chongqing Chuandong Chemical Group Co., Chongqing, China. Dicumyl peroxide (DCP) was purchased from Aladdin Reagent (Shanghai) Co. Ltd.2.2 Surface grafting modification of Nano-SiO2
![[thin space (1/6-em)]](https://www.rsc.org/images/entities/char_2009.gif) 000 rpm, washed with deionized water and dried at 100 °C for 24 hours in a vacuum drying oven.
000 rpm, washed with deionized water and dried at 100 °C for 24 hours in a vacuum drying oven.![[thin space (1/6-em)]](https://www.rsc.org/images/entities/char_2009.gif) :
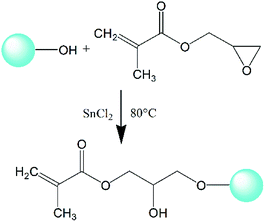
:![[thin space (1/6-em)]](https://www.rsc.org/images/entities/char_2009.gif) 1, was added along with 1000 ppm SnCl2 as catalyst. The grafting reaction was performed under mechanical stirring at 80 °C for 8 hours. The epoxy group in GMA can chemically react with the activated hydroxyl groups on the surface of nano-SiO2, as shown in Fig. 1, and a composite monomer with multiple double bonds (C
1, was added along with 1000 ppm SnCl2 as catalyst. The grafting reaction was performed under mechanical stirring at 80 °C for 8 hours. The epoxy group in GMA can chemically react with the activated hydroxyl groups on the surface of nano-SiO2, as shown in Fig. 1, and a composite monomer with multiple double bonds (C![[double bond, length as m-dash]](https://www.rsc.org/images/entities/char_e001.gif) C) focusing on nano-SiO2 can be obtained to prepare LCBPE via radical reaction. The grafted nano-SiO2 was finally acquired successively by centrifugal separation, washing and desiccation.
C) focusing on nano-SiO2 can be obtained to prepare LCBPE via radical reaction. The grafted nano-SiO2 was finally acquired successively by centrifugal separation, washing and desiccation.
2.3 Preparation of LCBPE based on grafted Nano-SiO2
Modification of HDPE took place in a torque rheometer. Before melt reaction, HDPE pellets, nano-SiO2 and peroxide initiator DCP were mixed evenly by stirring for 5 minutes. After that, the mixture was put in the torque rheometer (XSM-500, Kechuang Co., Ltd. Shanghai, China) at 170 °C and 80 rpm for a certain time to obtain modified PE. Finally, the samples were smashed to granules in a pulverizer. The contents of all formulations studied are listed in Table 1. Samples were taken at the top of the reactive peak in the torque curves if a second torque peak could be observed, but otherwise sampled at the time of equilibrium torque.| Sample | HDPE [g] | DCP [g] | Irganox 1010 [g] | SiO2 [g] | SiO2-g-GMA [g] |
|---|---|---|---|---|---|
| HDPE | 100 | — | 0.2 | — | — |
| 1-SiO2/PE | 100 | 0.1 | 0.2 | 1 | — |
| 1-SiO2-g-GMA/PE | 100 | 0.1 | 0.2 | — | 1 |
| 2-SiO2-g-GMA/PE | 100 | 0.1 | 0.2 | — | 2 |
| 3-SiO2-g-GMA/PE | 100 | 0.1 | 0.2 | — | 3 |
| 5-SiO2-g-GMA/PE | 100 | 0.1 | 0.2 | — | 5 |
2.4 Fourier transform infrared spectroscopy
Fourier transform infrared (FTIR) spectroscopy was performed with a Nexus 670 (Nicolet, Inc., WI, USA). Before testing, the modified samples were dissolved in hot xylene at 140 °C and then the solution was poured into 200 mL acetone at room temperature. The sediments were separated by filtration, and then were dried under vacuum for at least 24 hours at 80 °C. Finally, the purified sample was pressed into a thin layer with spectroscopically pure potassium bromide (KBr, SP) at room temperature and 14 MPa for FTIR measurements.2.5 Water contact angles
The contact angle on the surface was determined by using an OCA20 machine (Data-Physics, Germany) at room temperature. Three measurements at different positions on the same sample were used to obtain the average value.2.6 Melt index measurement
The melt index (MFI) of HDPE and modified samples was measured by using an SRZ-400E tester (Changchun Intelligent Instrument and Equipment Co., Ltd) at 190 °C and 5.0 kg.2.7 Rheological characterization
Rheological measurements were performed by an advanced rheometer expansion system (ARES-G2, TA instruments, USA) with a parallel-plate (25 mm in diameter) and a gap of 1 mm. The small amplitude oscillatory shear was performed in the frequency range of 0.05 to 100 rad s−1 at 190 °C with an accuracy of ± 0.5 °C. The applied strain was kept at 2% in order to ensure all samples were maintained in the linear viscoelastic region.2.8 Melt strength testing
The melt extension of PE samples prepared using SiO2-GMA was performed using a capillary rheometer (Rosand RH7, Malvern Co., UK) for haul-off test at 170 °C, equipped with a flat entrance angle (180°) of diameter 2.0 mm and an aspect ratio L/D = 20.2.9 Differential scanning calorimetry
The samples were characterized by differential scanning calorimetry (DSC) on a TA instrument. The samples were first heated from room temperature to 200 °C and held for 5 minutes to eliminate the thermal history, and then cooled back to 40 °C at a rate of 10 °C min−1. The second heating was performed from 40 °C to 200 °C at a speed of 10 °C min−1. For the whole process, all samples were kept under nitrogen at a flow rate of 40 mL min−1.2.10 Polarizing microscopy
Crystalline morphology was investigated by polarizing optical microscopy (Axio Scoppe A1, ZEISS Co., Germany) with an automatic heating stage. Samples were first melted on a glass slide at 200 °C for 5 minutes to eliminate thermal histories and then cooled to 25 °C at a speed of 20 °C min−1.2.11 Mechanical property testing
The tensile tests and bending property measurements were performed by using a universal tensile testing machine (CMT6104, MTS Sensors, China) according to GB/T 1040.2-2006 and GB/T 9341-2008 with a tensile speed of 50 mm min−1 and crosshead speed of 2 mm min−1. The notched Izod impact test was carried out on an impact testing machine (ZBC1400-B) at room temperature, using a 2.75 J pendulum. Five specimens for each sample were tested and the average values were calculated as the final result.2.12 Morphological characterization
Scanning electron microscopy (SEM), JEOL-7500F (JEOL, Japan) was used to analyse the tensile failure section structure and morphology of PE samples. Before observation, the notched PE specimen was immersed in liquid nitrogen for 2 hours and then broken by an impact pendulum. Fracture surfaces were sputtered with gold to provide enhanced conductivity.2.13 Gel content testing
The gel content was determined by an extraction experiment. The modified samples were cut into small pieces and packed in fine copper nets of 400 mesh, and then were extracted in boiling xylene (Jinshan Chemical Reagent Ltd, Chengdu, China) for 24 hours. After removal from the boiling solvent, the samples were dried at 80 °C under vacuum to remove residual xylene, and weighed to determine the percentage gel content. As a matter of fact, no gel was observed for all modified PE samples.3. Results and discussion
3.1 FTIR spectra
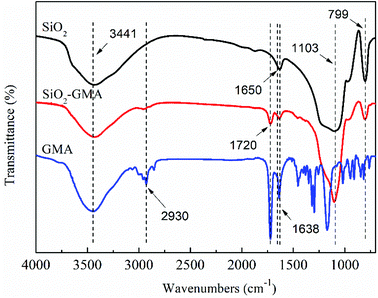
In order to characterize the change of the groups during grafting modification of nano-SiO2, the unmodified nano-SiO2 and GMA-g-nano-SiO2 were examined by FTIR. The results are shown in Fig. 2.For all nano-SiO2s, bands at about 799 cm−1 and 1103 cm−1 can be observed which correspond to the Si–O asymmetric and symmetric contraction vibration, the peak at 1638 cm−1 is the bending vibration of O–H, and the 3441 cm−1 peak is due to the telescopic vibration of Si–O–H and O–H. In the spectrum for GMA, bands at about 2930 cm−1 can be found, which correspond to the telescopic vibration of C–H, and the contraction vibration of C![[double bond, length as m-dash]](https://www.rsc.org/images/entities/char_e001.gif) C is located at about 1650 cm−1. Compared with the nano-SiO2, GMA grafted modified SiO2 shows a new characteristic peak near 1650 cm−1, which is due to the contraction vibration of –C
C is located at about 1650 cm−1. Compared with the nano-SiO2, GMA grafted modified SiO2 shows a new characteristic peak near 1650 cm−1, which is due to the contraction vibration of –C![[double bond, length as m-dash]](https://www.rsc.org/images/entities/char_e001.gif) O in GMA and may cover the C
O in GMA and may cover the C![[double bond, length as m-dash]](https://www.rsc.org/images/entities/char_e001.gif) C telescopic vibration characteristic peak, indicating that GMA was successfully grafted onto the nano-SiO2 surface. In addition, the peak intensity of modified nano-SiO2 in the vicinity of 3441 cm−1 is obviously reduced, which further illustrates that some of the –OH groups on the SiO2 surface have participated in the chemical reaction.
C telescopic vibration characteristic peak, indicating that GMA was successfully grafted onto the nano-SiO2 surface. In addition, the peak intensity of modified nano-SiO2 in the vicinity of 3441 cm−1 is obviously reduced, which further illustrates that some of the –OH groups on the SiO2 surface have participated in the chemical reaction.
3.2 Torque curves of the branching reaction
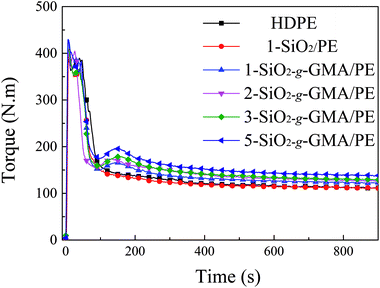
The mixing torque curves of pristine HDPE and modified HDPE samples are shown in Fig. 3. For pristine HDPE, the torque curve keeps nearly horizontal after complete melting. However, for the torque curves of modified HDPE samples with nano-SiO2-g-GMA and DCP, the second peak (reactive peak) can be obviously observed at about 1.7–2.0 minutes on the right-hand side of the melting peak, which indicates that long chain branching or cross-linking takes place in the SiO2-g-GMA/HDPE systems. As a matter of fact, no gel can be found in any of the modified HDPE samples, suggesting that the appearance of the second torque peak is basically due to the introduction of long branching chains in this system. In addition, there is no obvious reactive peak for the modified sample with unmodified SiO2 (1-SiO2/PE), and so it can be considered that LCB structure cannot be formed without grafting modification of nano-SiO2. Moreover, with the increasing dosage of SiO2-g-GMA, the torque value of the second peak and the balance torque (listed in Table 2) are correspondingly increased, which can be attributed to the generation of LCBPE with the increasing contents of SiO2-g-GMA as well as an enhancement in molecular chain entanglement. The increase of balance torque is mainly caused by the different dosage of SiO2-g-GMA. Thus, the branching reaction of the modified sample can be indirectly characterized by the difference between the second torque peak value and the balance torque, which is defined as the “relative torque”. As shown in Table 2, the relative torque gradually increases with the increasing content of SiO2-g-GMA, indicating the improvement in branching degree. As regards the melt flow index (MFI) of the sample which is taken at the summit of the reaction peak, it is found that the MFI of 1-SiO2/PE is slightly higher than that of pristine HDPE, indicating moderate degradation of PE. However, lower and lower MFI values can be observed with the increasing dosage of SiO2-g-GMA, which is ascribed to the formation of long branching structures and augmented chain entanglement.| Sample | Second peak torque [N m] | Balance torque [N m] | Relative torque [N m] | MFI [g/10 min] |
|---|---|---|---|---|
| HDPE | — | 111.8 | — | 3.24 |
| 1-SiO2/PE | — | 110.9 | — | 3.92 |
| 1-SiO2-g-GMA/PE | 166.1 | 122.6 | 43.5 | 2.05 |
| 2-SiO2-g-GMA/PE | 174.1 | 126.2 | 47.9 | 1.47 |
| 3-SiO2-g-GMA/PE | 179.7 | 128.7 | 51 | 0.8 |
| 5-SiO2-g-GMA/PE | 196.6 | 138.2 | 58.4 | 0.65 |
3.3 FTIR analysis and modification mechanism of SiO2-g-GMA modified HDPE
FTIR spectra of the purified HDPE samples are shown in Fig. 4. For all modified PEs, new absorption bands at 799 cm−1 and 1630 cm−1 can be observed, which are respectively due to the asymmetrical Si–O stretching vibration and the bending vibration peak of –OH in SiO2. The peak at 1725 cm−1 is due to the stretching vibration of –C![[double bond, length as m-dash]](https://www.rsc.org/images/entities/char_e001.gif) O in GMA, indicating that SiO2-g-GMA has been grafted onto the HDPE main chain.
O in GMA, indicating that SiO2-g-GMA has been grafted onto the HDPE main chain.
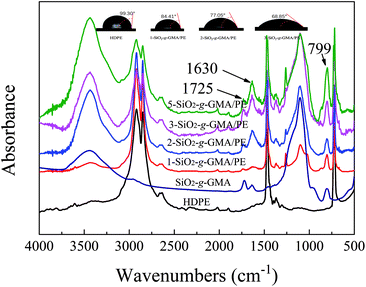 | ||
| Fig. 4 Normalized FTIR spectra of SiO2-g-GMA, pristine HDPE and modified samples after purification. Water contact angles of modified samples are also shown. | ||
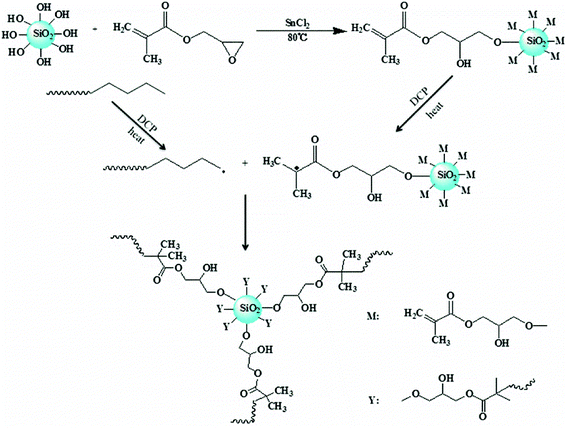
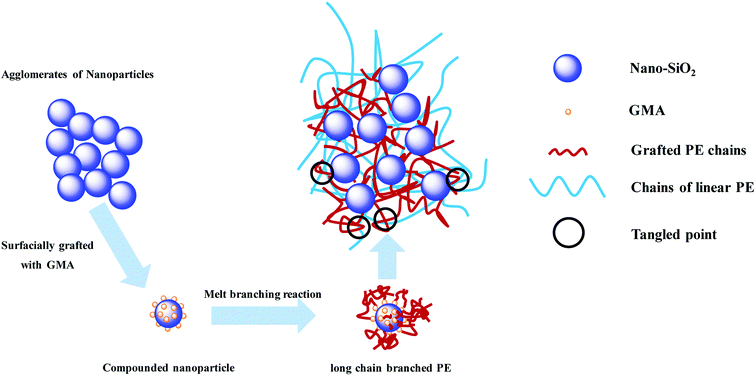
A possible mechanism for formation of LCBPE by modified nano-SiO2 is shown in Fig. 5. By reaction between the epoxy group at the end of the GMA molecule and the activated silicon hydroxy group on the surface of nano-SiO2 at 80 °C in the presence of the catalyst SnCl2, GMA is grafted onto the surface of the nano-SiO2, and the double bond is provided for the preparation of LCBPE. At a high temperature, PE macromolecular chain radicals can be induced by the initiator DCP and, meanwhile, small molecular radicals can also be formed by the opening of vinyl double bonds on the surface of GMA-g-SiO2. The PE macromolecular radicals can react with the small molecular radicals; thus GMA-g-SiO2 is grafted onto the PE backbone. On the surface of a SiO2-g-GMA particle, a plurality of PE molecular chains can be grafted to form a branching structure. Since the molecular chain of the PE macromolecular free radical is long enough, LCBPE can be prepared with the SiO2-g-GMA particles as branching centers.
Moreover, the water contact angle decreases gradually with the increasing content of SiO2-g-GMA, which means that the polarity of the PE gradually increases.
3.4 Rheological characterization
Linear viscoelastic properties are very sensitive to the topological structure of macromolecules.28 Fig. 6(a) and (b) respectively show the energy storage modulus G′ and the loss modulus G′′ vs. frequency (ω) for pristine HDPE and the modified samples. It can be observed that G′ and G′′ of modified samples with SiO2-g-GMA are obviously higher than those of pristine HDPE at low frequency, while the values for 1-SiO2/PE are lower than those of pristine HDPE over the entire frequency range. The G′ and G′′ plots of pristine HDPE and 1-SiO2/PE exhibit typical terminal behavior of a linear polymer, while for the modified samples with SiO2-g-GMA, different terminal behaviors can be observed owing to the introduction of long chain branching structures, which results in the extension of end relaxation time.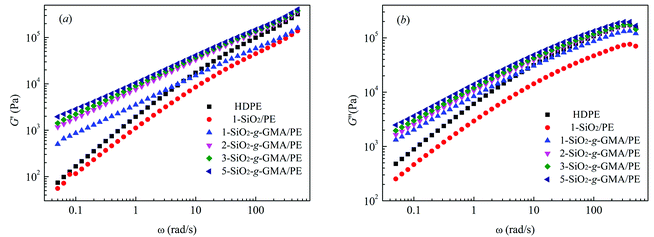 | ||
| Fig. 6 Storage modulus (a) and loss modulus (b) vs. frequency of HDPE and modified samples at 190 °C. | ||
The intersection point Gc between the curves of G′ and G′′ is usually used to characterize the transformation of elasticity and viscosity, and the corresponding frequency (ω) is related to the relaxation characteristics of the PE chain.29 The characteristic relaxation time τ = 1/ω, the intersections of the curves and the relaxation times of the features are listed in Table 3. Viscous behavior (where G′′ > G′) is exhibited in the low-frequency region, and elastic behavior (where G′′ < G′) is exhibited in the high-frequency region. This transition shifts to a low frequency with the increasing content of SiO2-g-GMA, and the fluidity of the system is reduced, with the prolongation of relaxation time.30 In addition, the molecular weight distribution can be characterized by the rheological polydispersity index, PI = 106/Gc. The smaller the PI, the narrower the molecular weight distribution. The PI calculation results are listed in Table 3. It can be found that the addition of SiO2-g-GMA broadens the molecular weight distribution of the system, and the more the SiO2-g-GMA content, the broader the molecular weight distribution.
| Sample | ω [rad s−1] | τ [s] | Gc [Pa] | PI | Ms [N] |
|---|---|---|---|---|---|
| HDPE | 143.62 | 0.007 | 1.253 × 10⁵ | 7.98 | 0.07 |
| 1-SiO2/PE | 120.16 | 0.008 | 5.042 × 10⁴ | 19.83 | 0.09 |
| 1-SiO2-g-GMA/PE | 39.36 | 0.025 | 6.703 × 10⁴ | 14.92 | 0.164 |
| 2-SiO2-g-GMA/PE | 38.41 | 0.026 | 7.484 × 10⁴ | 13.36 | 0.32 |
| 3-SiO2-g-GMA/PE | 30.45 | 0.033 | 7.247 × 10⁴ | 13.80 | 0.29 |
| 5-SiO2-g-GMA/PE | 27.75 | 0.036 | 6.269 × 10⁴ | 15.95 | 0.26 |
3.5 Melt strength
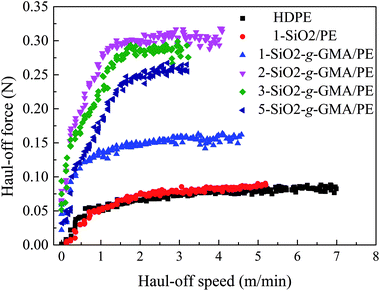
Most typical LCB polymers have high melt strength and prominent strain-hardening behavior. In the haul-off test curve, “melt strength” (Ms) is defined as the maximum force before melt strand breaking. As is shown in Fig. 7 and Table 3, the melt strength of 1-SiO2/PE is basically similar to that of pristine HDPE. However, for the other modified PEs, higher melt strength values and more obvious strain hardening can be observed compared with that of pristine PE, manifesting the introduction of LCBs improving the melt properties. With the increase of SiO2-g-GMA content, melt strength values of the modified PEs increase at first and then decrease. When the content of SiO2-g-GMA is 2 phr, the melt strength of the samples reaches a maximum of 0.32 N, which is much higher than that of pristine HDPE and 1-SiO2/PE.31A schematic of formation and entanglement of this LCBPE system is shown in Fig. 8. The entanglement among PE macromolecular chains, which provides physical crossing points, is enhanced owing to the LCBPE prepared by SiO2-g-GMA, resulting in the improvement in the chain relaxation time and melt strength. However, with the increasing dosage of SiO2-g-GMA, the number of effective entanglement points is reduced owing to the agglomeration of the nanoparticles, which causes a decline in the melt strength to a certain degree.
3.6 Crystallization behavior
The cooling and heating traces of pristine HDPE and modified PE samples are shown in Fig. 9(a) and (b), and the corresponding crystallization and melting parameters are listed in Table 4. At a certain cooling rate, the crystallization peak temperature (Tp) moves towards high temperature, which indicates that the degree of supercooling of the system decreases, and stable crystal nuclei can be formed at a higher temperature.32 The total rate for the crystallization process can be expressed as (Tc − Tp), where Tc is the initial crystallization temperature, and the smaller the value of (Tc − Tp), the faster the crystallization rate.33 From Fig. 9(a) and Table 4, it can be seen that the Tc and (Tc − Tp) of the samples modified with nano-SiO2 and SiO2-g-GMA are both higher than those of pristine HDPE, with the samples modified by SiO2-g-GMA having the uttermost values. Nano-SiO2 in this system plays a role in heterogeneous nucleation, so that PE can start nucleation at a higher temperature with nano-SiO2 as the core. As a result, the nucleation density and the value of Tc are improved in 1-SiO2/PE. The crystallization temperature of SiO2-g-GMA/PE is obviously higher than those of 1-SiO2/PE and pristine HDPE, which can be attributed to the nucleating role of LCB structure in the SiO2-g-GMA/PE system and the blocked thermal movement of the molecular chains by the branching entanglement, and stable crystal nuclei are easily formed at high temperature, which is consistent with the characteristics of LCB polymers reported by literature.34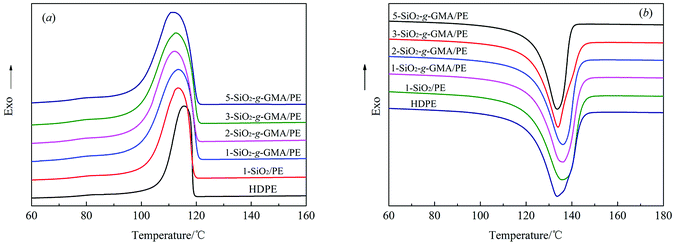 | ||
| Fig. 9 DSC cooling (a) and melting (b) traces for pristine HDPE and modified samples at a speed of 10 °C min−1. | ||
| Sample | Tc [°C] | Tp [°C] | Tc − Tp [°C] | Tm [°C] | ΔHm [kJ mol−1] | Xc [%] |
|---|---|---|---|---|---|---|
| HDPE | 118.81 | 115.53 | 3.28 | 133.63 | 188.2 | 65.12 |
| 1-SiO2/PE | 118.94 | 113.43 | 5.51 | 133.95 | 187.6 | 64.91 |
| 1-SiO2-g-GMA/PE | 120.54 | 113.37 | 7.17 | 136.10 | 181.8 | 62.91 |
| 2-SiO2-g-GMA/PE | 120.13 | 112.02 | 8.11 | 136.12 | 189.9 | 65.71 |
| 3-SiO2-g-GMA/PE | 120.46 | 112.37 | 8.09 | 135.54 | 162.0 | 56.06 |
| 5-SiO2-g-GMA/PE | 120.31 | 111.81 | 8.5 | 133.66 | 151.4 | 52.39 |
However, in the subsequent crystal growth process, the addition of nano-SiO2 decreases the free volume of the polymer molecular chains, which restricts the movement and diffusion of molecular chains, as well as the growth of crystals; thus the overall rate of crystallization is reduced, which is manifested by the augmentation in the value of Tc − Tp. In addition, LCB structure in the SiO2-g-GMA/PE system can also play a nucleating role in the crystallization process, while the presence of the LCB structure increases the entanglement among molecular chains, which drastically hinders the motion of the molecular chains of PE during the crystallization, so that the crystals grow more slowly. Therefore, the order of Tc and (Tc − Tp) is SiO2-g-GMA/PE > SiO2/PE > HDPE.
Moreover, for the SiO2-g-GMA/PE system, it is found that Tc remains basically unchanged, while (Tc − Tp) gradually increases, that is, the total crystallization rate gradually decreases with the increase of SiO2-g-GMA content.
Fig. 9(b) shows the second heating thermogram of all samples. The crystallinity (Xc) of pristine HDPE and modified samples can be determined from heating scans using the following eqn (1):
 | (1) |
The crystal morphology of pristine HDPE and modified samples was observed by polarizing optical microscopy (POM). The polarized micrographs of all samples that crystallized from 200 to 25 °C at a cooling rate of 20 °C min−1 are shown in Fig. 10(a)–(f). It can be obviously observed that the modified sample crystals are significantly refined compared with pristine HDPE. Compared with 1-SiO2/PE, the crystal grains of 1-SiO2-g-GMA/PE are smaller and the number of spherulites is bigger, which suggests that the nano-SiO2 and LCB structures can both function as nucleating agents to promote the crystal nucleation. As a result, the crystals are significantly refined, which is consistent with the previous DSC results. In addition, as the SiO2-g-GMA content increases, lots of smaller and smaller spherocrystals can be found and the boundary of each spherocrystal becomes indistinct, which can be attributed to the mutual diffusion and entanglement among the PE chains on the nano-SiO2 surface and in the matrix.
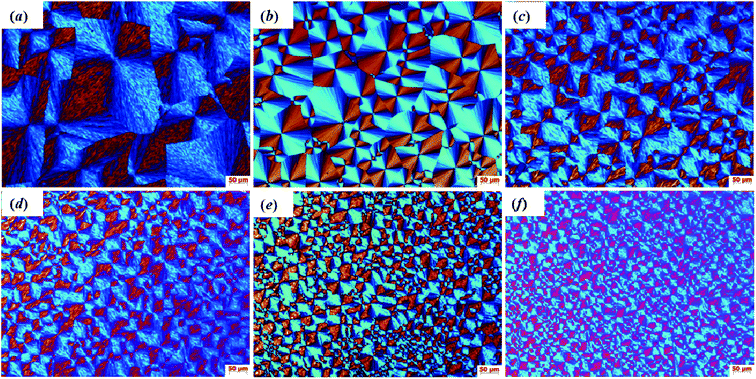 | ||
| Fig. 10 POM micrographs taken at 200× magnification for (a) HDPE, (b) 1-SiO2/PE, (c) 1-SiO2-g-GMA/PE, (d) 2-SiO2-g-GMA/PE, (e) 3-SiO2-g-GMA/PE and (f) 5-SiO2-g-GMA/PE. | ||
3.7 Mechanical properties
Table 5 shows the mechanical performances of pristine HDPE and modified samples. As a whole, the mechanical strength of PE samples increases at first and then decreases as the SiO2-g-GMA content rises, and the elongation at break is gradually decreased. First of all, the double bonds on the surface of the nano-SiO2 react with HDPE molecular chains initiated by the initiator DCP to generate LCB structure, which enhances the interfacial bonding force between nano-SiO2 and the matrix resin, thus increasing the compatibility and the dispersibility of the nanoparticles. When the specimen is stretched, this tangled complex of nanoparticles can orientate with the PE matrix along the tensile direction, with an increase in tensile strength.36 Afterwards, the crystals are significantly refined by nano-SiO2, and the smaller spherulites produce lower stress concentration. In the end, nano-SiO2 grafted with PE chains in this system enhances the chain entanglement; thus more energy can be dissipated. As a result, the tensile strength, impact strength, flexural strength and flexural modulus are all improved. When the dosage of SiO2-g-GMA is 2 phr, the tensile strength displays the maximum value of 26.06 MPa, and the highest impact strength of 20.21 kJ m−2 is 24.1% higher than that of pristine HDPE. Similarly, the highest flexural strength and flexural modulus are respectively increased by 31.9% and 23.7% compared with pristine HDPE.| Sample | Tensile strength [MPa] | Elongation at break [%] | Impact strength [kJ m−2] | Flexural strength [MPa] | Flexural modulus [MPa] |
|---|---|---|---|---|---|
| HDPE | 21.35 | 164.75 | 16.36 | 13.32 | 594.00 |
| 1-SiO2/PE | 22.55 | 94.25 | 17.77 | 16.84 | 695.00 |
| 1-SiO2-g-GMA/PE | 25.55 | 100.25 | 19.25 | 17.31 | 721.00 |
| 2-SiO2-g-GMA/PE | 26.06 | 64.75 | 20.29 | 17.77 | 730.20 |
| 3-SiO2-g-GMA/PE | 25.78 | 55.25 | 18.65 | 15.38 | 660.00 |
| 5-SiO2-g-GMA/PE | 24.58 | 52.5 | 15.59 | 14.33 | 553.60 |
However, excessive SiO2-g-GMA easily agglomerates, which goes against its dispersibility in the matrix. Under the action of external forces, the matrix resin is not uniformly stressed, and regions of stress concentration are easily formed, which decrease the mechanical strength. The elongation at break is gradually decreased, which is due to the movement of the molecular chains of PE being subjected to restriction by entanglement and the presence of nano-SiO2 particles.
3.8 Morphological characterization
Good dispersibility is critical to the preparation of polymer-based nanocomposite materials. The impact fracture surfaces of pristine HDPE and modified samples are shown in Fig. 11. Fig. 11(a) shows the fracture surface of pristine HDPE; its morphology is relatively smooth, and a certain degree of deformation can be seen. Fig. 11(b) and (c)–(f) are the SEM images of the fracture section of 1-SiO2/PE and the PE samples modified with different contents of SiO2-g-GMA, respectively. A higher degree of deformation can be seen on the fracture surfaces of the SiO2-g-GMA modified PE, and the impact strength of the samples is improved. The dispersion of nano-SiO2 within 1-SiO2-g-GMA/PE is more uniform than that within 1-SiO2/PE because the compatibility is improved for the surface-modified nano-SiO2. When the SiO2-g-GMA content is relatively low (less than 3 phr), serious agglomeration of nano-SiO2 is not found; thus the mechanical properties of modified samples are improved. When the dosage of SiO2-g-GMA is more than 3 phr, the modified samples exhibit obvious agglomeration. With the increase of SiO2-g-GMA content, the size of agglomerated particles is obviously increased, and the largest agglomerate particle size is nearly 400 nm, which easily results in excessive stress concentration and downgrades the mechanical properties of the material.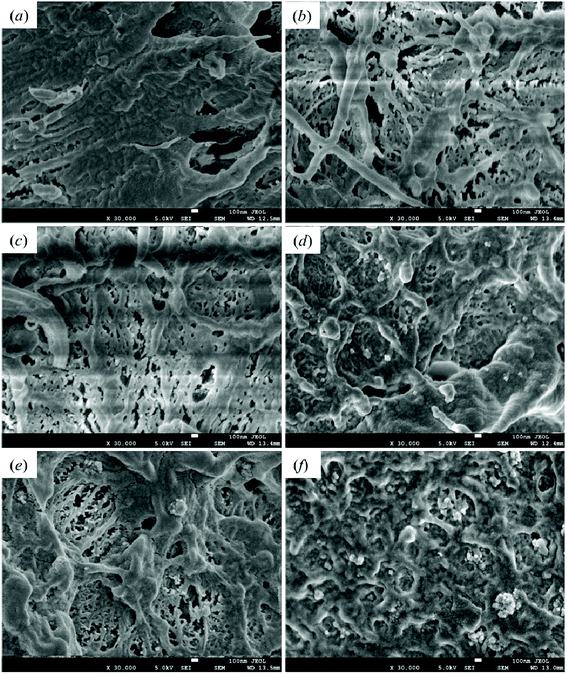 | ||
| Fig. 11 Scanning electron microscopy images of impact fracture section of (a) HDPE, (b) 1-SiO2/PE, (c) 1-SiO2-g-GMA/PE, (d) 2-SiO2-g-GMA/PE, (e) 3-SiO2-g-GMA/PE and (f) 5-SiO2-g-GMA/PE. | ||
4. Conclusions
Glycidyl methacrylate (GMA) was grafted onto the surface of nano-SiO2, and multiple double bonds (C![[double bond, length as m-dash]](https://www.rsc.org/images/entities/char_e001.gif) C) were introduced. LCBPE without gel was prepared by melt-grafting reaction in a Haake torque rheometer in the presence of peroxide and the nano-SiO2 grafted GMA (SiO2-g-GMA), when the samples were obtained at the top of the reactive peak in the torque curves. The addition of the grafted nanoparticles played an important role in the formation of long branched HDPE molecular chains by radical reaction. Rheological characterization indicated the formation of LCB structures. The prepared LCBPE had a longer relaxation time and broader molecular weight distribution, and the sample with 2 phr SiO2-g-GMA/PE possessed the highest melt strength of 0.32 N, which is much higher than that of pristine HDPE (0.07 N). The spherulites of LCBPE were much smaller and the initial crystallization temperature was higher than that of pristine HDPE, indicating that the LCB structure acted as nucleating agent. However, the total rate of crystallization was slowed down, and the degree of crystallinity was reduced, indicating that the LCB structure increases the degree of chain entanglement and restrains the movement of molecular chains at the same time. Comparing the mechanical properties of SiO2-g-GMA modified PE with pristine HDPE, the sample with 2 phr SiO2-g-GMA/PE possessed the best mechanical properties. The tensile strength increased by 24.1%, bending strength increased by 31.9% and flexural modulus increased by 23.7%, respectively. When the SiO2-g-GMA content was more than 3 phr, the inorganic nanoparticles tended to agglomerate, and the mechanical properties of the material deteriorated.
C) were introduced. LCBPE without gel was prepared by melt-grafting reaction in a Haake torque rheometer in the presence of peroxide and the nano-SiO2 grafted GMA (SiO2-g-GMA), when the samples were obtained at the top of the reactive peak in the torque curves. The addition of the grafted nanoparticles played an important role in the formation of long branched HDPE molecular chains by radical reaction. Rheological characterization indicated the formation of LCB structures. The prepared LCBPE had a longer relaxation time and broader molecular weight distribution, and the sample with 2 phr SiO2-g-GMA/PE possessed the highest melt strength of 0.32 N, which is much higher than that of pristine HDPE (0.07 N). The spherulites of LCBPE were much smaller and the initial crystallization temperature was higher than that of pristine HDPE, indicating that the LCB structure acted as nucleating agent. However, the total rate of crystallization was slowed down, and the degree of crystallinity was reduced, indicating that the LCB structure increases the degree of chain entanglement and restrains the movement of molecular chains at the same time. Comparing the mechanical properties of SiO2-g-GMA modified PE with pristine HDPE, the sample with 2 phr SiO2-g-GMA/PE possessed the best mechanical properties. The tensile strength increased by 24.1%, bending strength increased by 31.9% and flexural modulus increased by 23.7%, respectively. When the SiO2-g-GMA content was more than 3 phr, the inorganic nanoparticles tended to agglomerate, and the mechanical properties of the material deteriorated.
Conflicts of interest
There are no conflicts of interest to declare.Acknowledgements
This work was supported by the Technology Project of Guizhou Province, China (7001). We thank the National Engineering Research Center for Compounding and Modification of Polymer Materials for supporting this project.References
- G. Song, W. M. Pang, W. Li, M. Chen and C. Chen, Polym. Chem., 2017, 8, 329–334 Search PubMed
.
- Y. Na, D. Zhang and C. Chen, Polym. Chem., 2017, 8, 2405–2409 RSC
.
- Y. Na, S. Dai and C. Chen, Macromolecules, 2018, 51, 4040–4048 CrossRef CAS
.
- S. Cheng, E. Phillips and L. Parks, Radiat. Phys. Chem., 2010, 79, 329–334 CrossRef CAS
.
- L. Yang, T. Jiang, W. Gong, L. He, Z. Luo and C. Zhang, Polym. Adv. Technol., 2018, 29, 2300–2307 CrossRef CAS
.
- R. G. Larson, T. Sridhar, L. G. Leal, G. H. Mckinley, A. E. Likhtman and T. C. B. Mcleish, J. Rheol., 2003, 473, 809–818 CrossRef
.
- D. Yan, W. J. Wang and S. Zhu, Polymer, 1999, 40, 1737–1744 CrossRef CAS
.
- C. Gabriel, E. Kokko, B. Löfgren, J. Seppälä and H. Münstedt, Polymer, 2002, 43, 6383–6390 CrossRef CAS
.
- R. A. Bubeck, Mater. Sci. Eng., R, 2002, 39, 1–28 CrossRef
.
- S. Cheng, F. Dehaye, C. Bailly, J. J. Biebuyck, R. Legras and L. Parks, Nucl. Instrum. Methods Phys. Res., Sect. B, 2005, 236, 130–136 CrossRef CAS
.
- S. Cheng, E. Phillips and L. Parks, Radiat. Phys. Chem., 2009, 78, 563–566 CrossRef CAS
.
- P. D. Iedema, K. Remerie, M. V. D. Ham and E. Biemond, Polymer, 2013, 54, 4093–4104 CrossRef CAS
.
- C. J. Pérez, G. A. Cassano, E. M. Vallés, M. D. Failla and L. M. Quinzani, Polymer, 2002, 43, 2711–2720 CrossRef
.
- M. Golriz, H. A. Khonakdar and J. Morshedian, Thermochim. Acta, 2014, 590, 259–265 CrossRef CAS
.
- S. Dai and C. Chen, Macromolecules, 2018, 51, 6818–6824 CrossRef CAS
.
- A. M. Fischer, F. K. Wolf and H. Frey, Macromol. Chem. Phys., 2012, 213, 1349–1358 CrossRef CAS
.
- Z. Zhang, D. Wan, H. Xing, Z. Zhang, H. Tan, L. Wang, J. Zheng, Y. An and T. Tang, Polymer, 2012, 53, 121–129 CrossRef CAS
.
- S. Li, M. Xiao, Y. Guan, D. Wei, H. Xiao and A. Zheng, Eur. Polym. J., 2012, 48, 362–371 CrossRef CAS
.
- C. Zou, S. Dai and C. Chen, Macromolecules, 2018, 51, 49–56 CrossRef CAS
.
- J. Tian, W. Yu and C. Zhou, J. Macromol. Sci., Part B: Phys., 2010, 45, 969–985 CrossRef
.
- D. Graebling, Macromolecules, 2002, 35, 4602–4610 CrossRef CAS
.
- C. Yan, X. Fan, J. Li and S. Zhiqi Shen, J. Appl. Polym. Sci., 2011, 120, 1525–1532 CrossRef CAS
.
- M. Sumita, T. Ookuma, K. Miyasaka and K. Ishikawa, J. Appl. Polym. Sci., 1982, 27, 3059–3066 CrossRef CAS
.
- R. J. Zhou and T. Burkhart, J. Mater. Sci., 2011, 46, 1228–1238 CrossRef CAS
.
- M. Z. Rong, M. Q. Zhang, S. L. Pan and K. Friedrich, J. Appl. Polym. Sci., 2010, 92, 1771–1781 CrossRef
.
- J. P. Zhou, J. Compos. Mater., 2005, 39, 1931–1941 CrossRef CAS
.
- Y. L. Liu, C. Y. Hsu, M. L. Wang and H. S. Chen, Nanotechnology, 2003, 14, 813 CrossRef CAS
.
- P. Russo, A. Costantini, G. Luciani, F. Tescione, M. Lavorgna, F. Branda and B. Silvestri, J. Appl. Polym. Sci., 2018, 135, 46006 CrossRef
.
- M. Joshi, B. S. Butola, a. George Simon and N. Kukaleva‡, Macromolecules, 2006, 39, 1839–1849 CrossRef CAS
.
- J. Qian, P. He and K. Nie, J. Appl. Polym. Sci., 2004, 91, 1013–1019 CrossRef CAS
.
- P. Sun, T. Y. Qian, X. Y. Ji, C. Wu, Y. S. Yan and R. R. Qi, J. Appl. Polym. Sci., 2018, 135, 46768 CrossRef
.
- J. Kang, J. He, Z. Chen, F. Yang, J. Chen, Y. Cao and M. Xiang, Planta, 2015, 26, 32–40 CAS
.
- G. Liang, J. Xu and W. Xu, J. Appl. Polym. Sci., 2004, 91, 3054–3059 CrossRef CAS
.
- F. Luo, K. Wang, N. Ning, C. Geng, H. Deng, F. Chen, Q. Fu, Y. Qian and D. Zheng, Polym. Adv. Technol., 2011, 22, 2044–2054 CrossRef CAS
.
- M. Aguilar, J. F. Vega, E. Sanz and J. MartíNez-Salazar, Polymer, 2001, 42, 9713–9721 CrossRef CAS
.
- M. H. Wang, H. R. Wen, Y. F. Huang, L. Ye, M. Z. Rong and M. Q. Zhang, J. Mater. Chem., 2012, 22, 4592–4598 RSC
.
| This journal is © The Royal Society of Chemistry 2019 |

