 Open Access Article
Facile synthesis of a Bi2MoO6/TiO2 nanotube arrays composite by the solvothermal method and its application for high-performance supercapacitor†
Jiang Wen,
Shupei Sun,
Bo Zhang,
Nianfeng Shi,
Xiaoming Liao *,
Guangfu Yin
 ,
Zhongbing Huang
 ,
Xianchun Chen and
Ximing Pu
College of Materials Science and Engineering, Sichuan University, Chengdu, Sichuan 610065, China. E-mail: sherman_xm@163.com; Fax: +86 28 85413003
First published on 5th February 2019
Abstract
In this study, bismuth molybdate/titania nanotube arrays (Bi2MoO6/TNTs) as a binder-free electrode for supercapacitors were fabricated via a facile solvothermal method. The effects of precursor amounts, solvothermal time and temperature on the microstructure and electrochemical properties of the composite were analyzed. The surface morphology, microstructure, chemical composition and chemical states of the composite electrode material were analyzed using scanning electron microscopy, X-ray diffraction, energy dispersive X-ray spectroscopy, and X-ray photoelectron spectroscopy. Cyclic voltammetry tests, galvanostatic charge–discharge measurements, and electrochemical impedance spectroscopy were employed to analyze the electrochemical behavior of the composite. A specific capacitance of ∼330 mF cm−2 has been achieved for this Bi2MoO6 nanosheets/TNTs composite electrode at the current density of 1 mA cm−2. Galvanostatic charge–discharge experiments suggest a moderate cycling stability together with 76.7% capacitance retention after 1000 cycles of continuous charge–discharge operation. These results indicate that the Bi2MoO6/TNTs composite is a promising electrode material for supercapacitors.
1. Introduction
The current global energy crisis and environmental issues have led to an urgent need to exploit sustainable energy storage/conversion devices.1–3 As a momentous means of electrical energy storage through electrical double layer capacitance or pseudocapacitance, supercapacitors (SCs) have attracted tremendous attention, mainly due to their fast rechargeability, high power density, long cycle life, and bridging function for the energy and power gap between traditional dielectric capacitors and batteries.4–6 Carbon-active materials are generally employed as electrical double-layer capacitors (EDLCs), which adopt electrostatic charge diffusion and accumulation at the electrode/electrolyte interface as a charge storage mechanism.7–9 In contrast, pseudocapacitors exhibit a much higher specific capacitance compared with EDLCs owing to the fast and reversible redox reactions at the surface or subsurface of the electrodes. Therefore, they have the potential to meet the higher requirements of future energy storage systems.10 Nevertheless, some intrinsic drawbacks of the active materials used in SCs, such as poor electrical conductivity,11 inferior electrochemical properties6,12,13 and a limited electrolyte-accessible surface area14,15 still exist, which are vital barriers towards boosting specific capacitance.Among various supercapacitor materials (e.g., carbon nanotubes,7 RuO2,16,17 MnO2,14,18 NiO19,20 and polyaniline21), titanium dioxide nanotube arrays (TNTs) possess a highly ordered structure and large surface area, which promote charge and ion transfer as well as increase the reaction sites.22 However, the semiconducting nature and poor electrical conductivity of titanium dioxide (TiO2) lead to lower electrochemical activity, and thus reduce its energy density.11,13 In addition to doping with other elements23 and thermal annealing,24 the synthesis of nanocomposites with other electroactive materials (e.g., transition metal oxides, binary metal oxides, and polymers) could greatly enhance the capacitance of TNTs. For example, Ramadoss et al. reported that the nanostructured TiO2@MnO2 core–shell exhibited excellent electrochemical properties with an improved areal capacitance of 22.19 mF cm−2 at a scan rate of 5 mV s−1 in a 1 M Na2SO4 electrolyte solution.25 Sarkar et al. showed that the TiO2/BiFeO3 nanostructure yielded an enhanced capacitance of 440 F g−1 at a current density of 1.1 A g−1 in a 0.5 M Na2SO4 aqueous solution.26 The composite electrode can combine the large surface area of TNTs and the reversible electrochemical redox reaction of the electroactive materials, providing a better candidate for supercapacitors.25
Bismuth molybdate (Bi2MoO6), a typical layered Aurivillius oxide consisting of [Bi2O2]2+ layers sandwiched between [MO4]2− slabs, is widely used in photocatalytic applications due to its special physicochemical properties.27,28 Furthermore, Bi2MoO6 has also been studied in recent years as a good electrode material for supercapacitors which delivers high specific capacitances of 1075 F g−1 (6 M KOH, 0.1 A g−1) and 43 F g−1 (1 M Na2SO4, 5 mV s−1).29,30 Senthilkumar et al. reported that the active electrode material, which was obtained through coating a small piece of graphite sheet with a slurry consisting of as-prepared Bi2MoO6 nanoplates, carbon black, polyvinylidene fluoride and N-methyl-2-pyrrolidinone, exhibited a specific capacitance of 519 F g−1 at 5 mV s−1 in 1 M NaOH electrolyte.29 However, this typical method of preparing electrodes can lead to the generation of electrical contact resistance between the current collector and the electrode material. Recent research studies have manifested that the direct growth of the nanostructures on conductive substrates has the merits of enlarged contact surface areas, good ability to mitigate large volume alterations, and abundant electroactive sites.31,32 As a current collector, the well-aligned TNTs vertically oriented from the surface of a Ti substrate do not need a polymer binder and conductive additives.33,34 Therefore, Bi2MoO6 directly synthesized on the TNTs can not only result in higher volumetric energy density, but also eliminate ohmic resistance to some extent.
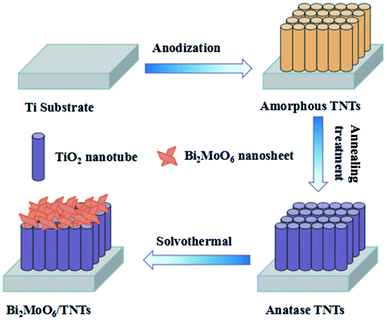
Inspired by the research above, we fabricated anatase TNTs by anodization and subsequent thermal treatment. Then, through a simple solvothermal method of loading Bi2MoO6 onto the TNTs substrate, we successfully fabricated Bi2MoO6/TNTs composite materials. The effects of the solvothermal conditions (precursor amounts, solvothermal reaction time and temperature) on the crystal structure, morphology, elemental composition, chemical states and electrochemical behavior of the Bi2MoO6/TNTs were also investigated. Our results demonstrate that the Bi2MoO6/TNTs composite is a promising electrode material.
2. Experimental procedure
2.1. Materials
Titanium sheet (TA2, purity > 99.6%, thickness of 1 mm) was purchased from LuoKe titanium Ltd. Ethylene glycerol (C2H6O2, purity > 99.5%), ammonium fluoride (NH4F, purity > 96%), bismuth nitrate pentahydrate [Bi(NO3)3·5H2O (purity > 99.0%)] and sodium molybdate dihydrate [Na2MoO4·2H2O (purity > 99.0%)] were purchased from KeLong Chemical Ltd. Other chemical reagents used in these experiments were of analytical grade and used without further purification. All aqueous solutions were prepared using deionized water.2.2. In situ preparation of anodized TNTs
The well-ordered TNTs were produced through a one-step anodization. Prior to anodization, the Ti sheet with the dimensions of 10 × 10 × 1 mm3 was degreased by acetone, ethanol and deionized water, sequentially, under ultrasonication for 20 min. The electrolyte solution was prepared by dissolving 0.3 wt% NH4F into 24.0 mL H2O and 376.0 mL ethylene glycol. Then, the degreased Ti sheet was anodized at 60 V for 30 min at 25 °C. Finally, after being rinsed with distilled water and dried in air, the obtained TNTs were annealed at 450 °C for 2 h and then naturally cooled to room temperature for improved crystallinity.2.3. Fabrication of Bi2MoO6/TNTs composite
The Bi2MoO6/TNTs composite was synthesized via a solvothermal method (Scheme 1). In a typical case, 1.0 mmol of Bi(NO3)3·5H2O and 0.5 mmol Na2MoO4·2H2O were dissolved in 50 mL ethylene glycol under stirring for 2 h. Then, the resulting solution was transferred into a 80 mL Teflon-lined autoclave to submerge the as-prepared TNTs. Next, the mixture was maintained at 160 °C for different times (4, 8, 12 and 16 h) and then cooled down to room temperature. The obtained samples were thoroughly washed with deionized water to remove any ionic residuals and dried in an oven at 60 °C for 12 h. The Bi2MoO6/TNTs prepared at 160 °C for the various durations, namely, 4 h, 8 h, 12 h and 16 h were referred to as BMO/TNT-1, BMO/TNT-2, BMO/TNT-3 and BMO/TNT-4, respectively. For comparison, Bi2MoO6 directly grown on Ti sheets at optimum solvothermal conditions was referred to as Bi2MoO6/Ti.2.4. Material characterizations
The surface morphology and crystal structure of the fabricated samples were investigated by scanning electron microscopy (SEM, Hitachi S4800, Japan) and X-ray diffraction (XRD, X'Pert ProMPD, Holland), respectively. The chemical composition of the prepared samples was characterized by an energy dispersive X-ray spectroscope (EDS, Oxford) attached to an SEM. An X-ray photoelectron spectroscope (XPS, Escalab 250Xi, USA) was employed to analyze the compositions and chemical states of the samples.2.5. Electrochemical measurements
The electrochemical properties were tested on a CHI660E (Chenhua, China) electrochemical working station with a three electrode system. The as-obtained Bi2MoO6/TNTs and Bi2MoO6/Ti were used as the working electrode. A platinum sheet and an Ag/AgCl electrode were used as the counter and reference electrodes, respectively. All of the measurements were performed in 0.5 M Na2SO4 aqueous electrolyte solution at 25 °C. The cyclic voltammetry (CV) measurements were performed in the potential range of −1.0 to 0 V at different scan rates of 10, 20, 40, 60, 80 and 100 mV s−1. The galvanostatic charge–discharge (GCD) curves were performed by chronopotentiometry (CP) at different current densities of 1.0, 2.0, 3.0, 4.0 and 5.0 mA cm−2 in the above potential range. Electrochemical impedance spectroscopy (EIS) measurements were conducted over a frequency range of 0.01 Hz to 100 kHz at an AC voltage amplitude of 5 mV. The cycling stability of the samples was tested by GCD measurements performed up to 1000 cycles at a current density of 1.0 mA cm−2.3. Results and discussion
3.1. Morphology and structure analyses
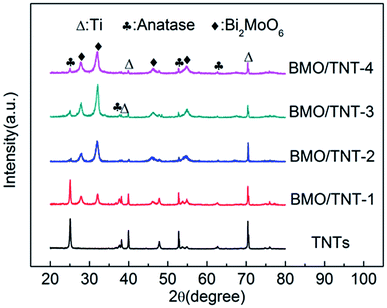
In the forepart of this study, we found that the compositions and morphologies of the Bi2MoO6/TNTs could be rationally tailored by simply adjusting the concentrations of both Bi(NO3)3·5H2O and Na2MoO4·2H2O. The corresponding XRD patterns and SEM images are shown in Fig. S1.† The results indicate that the prepared sample presents a well-crystallized structure with uniformly distributed nanosheets when the content of Na2MoO4·2H2O in the precursor is 0.5 mmol. In addition, the prepared sample also presents better electrochemical properties (Fig. S2†). Hence, 0.5 mmol was chosen as the optimum concentration and the following samples were prepared at this concentration.In addition to the precursor amounts, the reaction time also plays an important role in adjusting the morphologies of the Bi2MoO6/TNTs. Fig. 1 shows the XRD patterns obtained over a 2θ range from 20° to 80° for TNTs, BMO/TNT-1, BMO/TNT-2, BMO/TNT-3 and BMO/TNT-4. It can be seen that the main diffraction peaks at 25.3°, 37.9°, 48.0° and 53.9° are perfectly indexed to the (101), (004), (200) and (105) planes of the anatase TiO2 phase, respectively (JCPDS no. 21-1272). The peaks at 38.3°, 40.1° and 70.7° are assigned to the (002), (101), and (103) planes of the Ti, respectively (JCPDS no. 44-1294).34 In the pattern of the Bi2MoO6/TNTs, four distinct peaks with 2θ values of 28.3°, 32.9°, 47.1° and 55.3° can be well attributed to the (131), (200), (062) and (331) planes of the pure orthorhombic phase of Bi2MoO6, respectively (JCPDS no. 76-2388),27 indicating that the composites are composed of Ti, TiO2 and Bi2MoO6. Furthermore, the influence of the solvothermal reaction time on the crystalline phase is also demonstrated through the changes in the XRD patterns. With the increase in the solvothermal time from 4 h to 12 h, the diffraction peak intensity of Bi2MoO6 increases gradually. The XRD pattern of the BMO/TNT-3 shows higher intensity and narrower diffraction peaks than that of other samples, implying that the appropriate solvothermal reaction time can contribute to the enhancement of crystallization.28
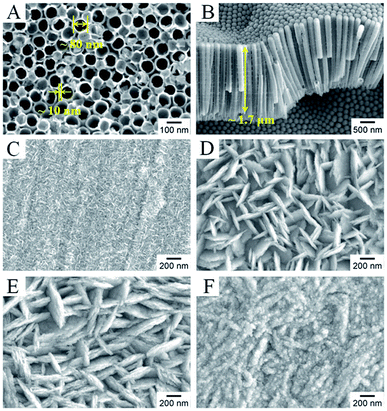
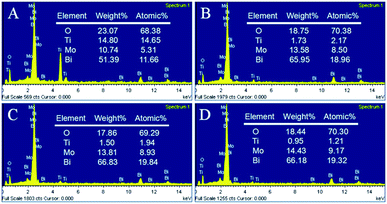
Fig. 2 shows typical scanning electron microscopy (SEM) images of the as-prepared TNTs and Bi2MoO6/TNTs. As shown in Fig. 2A and B, the obtained TNTs exhibit a highly arranged and uniform tubular structure with ∼80 nm pore diameter, ∼10 nm wall thickness and ∼1.7 μm tube length. Fig. 3B–F show the SEM images of BMO/TNT-1, BMO/TNT-2, BMO/TNT-3 and BMO/TNT-4, from which significant differences in the morphologies of Bi2MoO6 can be observed. From Fig. 2C, we can see that the surface of the sample BMO/TNT-4 is covered with many small nanoslices, indicating that Bi2MoO6 nanocrystals are formed and grown on the TNTs. The Bi2O22+ and MoO42− ions are generated under solvothermal conditions and further react to generate small nanoslices because of the high intrinsic anisotropic properties of Bi2MoO6.35 With the reaction continuing for 8 h, these small nanoslices gradually grow and further change into two-dimensional flake-like structures, predominantly with a length of 200–250 nm. As shown in Fig. 2E, the nanosheets with a larger size are obtained after 12 h. With the solvothermal reaction time prolonging to 16 h, a significant change in morphology occurs and the surface of the TNTs is uniformly composed of granule-shaped agglomerates, which apparently develop from the nanosheets. Fig. 3 shows the EDS spectra of the BMO/TNT-1, BMO/TNT-2, BMO/TNT-3 and BMO/TNT-4 composites. The result confirms that the Bi2MoO6/TNTs composites are composed of Ti, Bi, Mo, and O elements. In addition, the atomic ratios of Bi to Ti increase from 0.80![[thin space (1/6-em)]](https://www.rsc.org/images/entities/char_2009.gif) :
:![[thin space (1/6-em)]](https://www.rsc.org/images/entities/char_2009.gif) 1 to 8.74
1 to 8.74![[thin space (1/6-em)]](https://www.rsc.org/images/entities/char_2009.gif) :
:![[thin space (1/6-em)]](https://www.rsc.org/images/entities/char_2009.gif) 1, 10.22
1, 10.22![[thin space (1/6-em)]](https://www.rsc.org/images/entities/char_2009.gif) :
:![[thin space (1/6-em)]](https://www.rsc.org/images/entities/char_2009.gif) 1, and 15.97
1, and 15.97![[thin space (1/6-em)]](https://www.rsc.org/images/entities/char_2009.gif) :
:![[thin space (1/6-em)]](https://www.rsc.org/images/entities/char_2009.gif) 1 when the solvothermal reaction time is increased from 4 to 8, 12, and 16 h, respectively. The EDS measurements verify that the amounts of the Bi2MoO6 nanosheets deposited on the TNTs increase with the increase in the reaction time.
1 when the solvothermal reaction time is increased from 4 to 8, 12, and 16 h, respectively. The EDS measurements verify that the amounts of the Bi2MoO6 nanosheets deposited on the TNTs increase with the increase in the reaction time.
To further understand the elemental composition and chemical states of the as-prepared BMO/TNT-3 nanocomposite, XPS measurements were performed and the results are shown in Fig. 4. The peaks appearing at 284.5 eV, 532.4 eV and 458.9 eV refer to C 1s, O 1s and Ti 2p, respectively (Fig. 4A). As shown in Fig. 4B, the two peaks are centered at 159.0 eV for Bi 4f7/2 and 164.1 eV for Bi 4f5/2 with a spin energy separation of 5.1 eV, which shows that the Bi3+ oxidation state exists in the nanocomposite.36 The Mo 3d core level spectrum (Fig. 4C) shows two peaks with binding energies of 232.1 eV and 235.3 eV, corresponding to Mo 3d5/2 and Mo 3d3/2 of Mo6+, respectively.36 Therefore, these results indicate that the BMO/TNT-3 nanocomposite has been fabricated successfully, and are consistent with the XRD analysis.
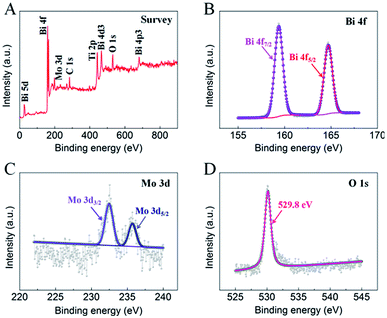 | ||
| Fig. 4 XPS spectra of the as-prepared BMO/TNT-3 nanocomposite: survey (A), Bi 4f (B), Mo 3d (C) and O 1s (D). | ||
3.2. Electrochemical characterizations
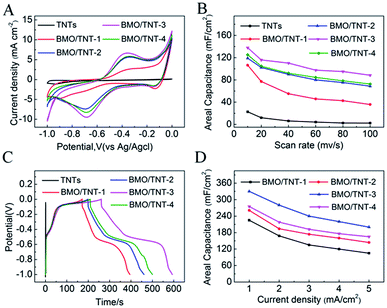
The cyclic voltammogram (CV) curves and galvanostatic charge–discharge (GCD) curves were investigated in a 0.5 M Na2SO4 aqueous electrolyte to evaluate the electrochemical properties of the prepared composites. The CV curves for the as-prepared samples collected at a scan rate of 40 mV s−1 are shown in Fig. 5A. In general, the CV curves show the occurrence of redox peaks, namely, an anodic peak at approximately −0.7 V and a cathodic peak at approximately −0.4 V, indicating the existence of pseudocapacitive behavior. Moreover, this reaction resembled the redox properties of bismuth oxide resulting from faradaic reactions that occurred between Bi(III) and Bi metal.33 Compared with pristine TiO2 NTs, the increased current of the CV curves for the Bi2MoO6/TNTs composite clearly demonstrates improved electrochemical behavior. These results suggest that the introduction of Bi2MoO6 over the TNTs' surface significantly increases the active area of the reaction platform on the surface or near surface-based redox reactions and thus, the capacitive performance is enhanced.37On the basis of the integrated area under the CV curve, the specific capacitances can be calculated by the following equation:
| Cs = C/S = I/[(dV/dt) × S] | (1) |
The areal capacitances of the TNTs, BMO/TNT-1, BMO/TNT-2, BMO/TNT-3 and BMO/TNT-4 are 6.3, 55.2, 90.1, 110.3 and 92.2 mF cm−2, respectively, at a scan rate of 40 mV s−1. The BMO/TNT-3 composited shows higher specific capacitance compared to BMO/TNT-1 and BMO/TNT-2. This is because BMO/TNT-3 has a better developed nanosheet structure and higher atomic ratio of Bi to Ti (15.97![[thin space (1/6-em)]](https://www.rsc.org/images/entities/char_2009.gif) :
:![[thin space (1/6-em)]](https://www.rsc.org/images/entities/char_2009.gif) 1), providing more active sites for faradaic reactions. We can see that the BMO/TNT-4 consists of the maximum amount of Bi2MoO6. However, the areal capacitance of BMO/TNT-4 is lower than that of BMO/TNT-3. On one hand, it has been proved that the electrode material with excess density of active substances is unfavorable for the penetration of electrolytes.38 On the other hand, the BMO/TNT-3 composite presents a uniformly distributed nanosheet morphology, which has bigger openings and channels that will in turn help to reduce the mass transfer resistance of the electrolyte through the oxide phase into the TNTs substrate beneath during the electrochemical tests (CV, GCD). Thus, BMO/TNT-3 shows better electrochemical capacitive performance.
1), providing more active sites for faradaic reactions. We can see that the BMO/TNT-4 consists of the maximum amount of Bi2MoO6. However, the areal capacitance of BMO/TNT-4 is lower than that of BMO/TNT-3. On one hand, it has been proved that the electrode material with excess density of active substances is unfavorable for the penetration of electrolytes.38 On the other hand, the BMO/TNT-3 composite presents a uniformly distributed nanosheet morphology, which has bigger openings and channels that will in turn help to reduce the mass transfer resistance of the electrolyte through the oxide phase into the TNTs substrate beneath during the electrochemical tests (CV, GCD). Thus, BMO/TNT-3 shows better electrochemical capacitive performance.
Fig. 5B shows the calculated areal capacitance of these electrodes as a function of scan rate. A decreasing trend of areal capacitance is observed in the Bi2MoO6/TNTs composite electrode with an increase in the scan rate from 10 to 100 mV s−1. The inner active sites in the oxide layer are not readily accessible by the electrolyte at higher scan rates due to diffusion limitations.26 The sustainable redox transition is not complete with an increase in scan rate of the potential, leading to a decrease in the specific capacitance. The CV curves recorded at different scan rates and the GCD curves of the BMO/TNT-3 composite are shown in Fig. S4.† The figure shows that the current response of the electrode increases with the increase in scan rate and the shapes of the cyclic voltammogram curves remain almost invariant throughout the whole range of scan rates. These results suggest that the composite electrode materials have good capacitative response and stability. Notably, the specific capacitance of the BMO/TNT-3 composite remains as high as 88.5 mF cm−2 at a high scan rate (100 mV s−1), demonstrating good rate capability and ion transportation performance. This is due to the low resistance of the BMO/TNT-3 composite, which is an important factor in determining the rate performance for supercapacitor electrode materials.39 The GCD curves for the as-prepared Bi2MoO6/TNTs composite electrodes collected at a current density of 1.0 mA cm−2 are shown in Fig. 5C. The non-linear characteristic of the discharge curve indicates that the electrochemical reaction occurs following the redox mechanism, which is concordant with the CV results.
From the discharging curves, the specific capacitances can be calculated using the following equation:
| Cs = [I × Δt]/[S × ΔV] | (2) |
In this study, the effects of the solvothermal temperature on the structure and electrochemical behaviours of the Bi2MoO6/TNTs composite were also investigated. The optimum solvothermal conditions (1.0 mmol Bi(NO3)3·5H2O and 0.5 mmol Na2MoO4·2H2O dissolved in precursor, 160 °C, 12 h) were determined (see ESI†). To better illustrate the effect of TNTs on the morphological structure and electrochemical properties of the Bi2MoO6/TNTs composite, the sample with Bi2MoO6 nanosheets directly grown on a Ti plate at optimum solvothermal conditions was prepared and the corresponding capacitive behaviours were evaluated. As shown in Fig. S7,† the XRD pattern of the Bi2MoO6/Ti sample indicates that the composites are composed of a Ti and Bi2MoO6 phase. Fig. 6A shows the SEM images of Bi2MoO6/Ti; a uniformly distributed thin nanosheet structure can be seen on the surface of the sample. Fig. 6B shows the EDS spectra of the Bi2MoO6/Ti composite. The atomic ratio of Bi to Ti (0.23![[thin space (1/6-em)]](https://www.rsc.org/images/entities/char_2009.gif) :
:![[thin space (1/6-em)]](https://www.rsc.org/images/entities/char_2009.gif) 1) is much less than that of BMO/TNT-3 (10.22
1) is much less than that of BMO/TNT-3 (10.22![[thin space (1/6-em)]](https://www.rsc.org/images/entities/char_2009.gif) :
:![[thin space (1/6-em)]](https://www.rsc.org/images/entities/char_2009.gif) 1), indicating that the TNTs can provide more sites for the adsorption of metal ions (Bi3+, Mo6+) as well as the nucleation and growth of Bi2MoO6 nanosheets. As shown in Fig. 6C, the areal capacitance of Bi2MoO6/Ti is 23.1 mF cm−2 at a scan rate of 40 mV s−1, which is also less than that of BMO/TNT-3 (110.3 mF cm−2). Generally, compared with Bi2MoO6/Ti, BMO/TNT-3 shows a uniformly distributed thick nanosheet morphology and better electrochemical performance, indicating that the existence of TNTs is beneficial to the formation of Bi2MoO6 nanosheets and improves the electrochemical properties of Bi2MoO6/TNTs composites.
1), indicating that the TNTs can provide more sites for the adsorption of metal ions (Bi3+, Mo6+) as well as the nucleation and growth of Bi2MoO6 nanosheets. As shown in Fig. 6C, the areal capacitance of Bi2MoO6/Ti is 23.1 mF cm−2 at a scan rate of 40 mV s−1, which is also less than that of BMO/TNT-3 (110.3 mF cm−2). Generally, compared with Bi2MoO6/Ti, BMO/TNT-3 shows a uniformly distributed thick nanosheet morphology and better electrochemical performance, indicating that the existence of TNTs is beneficial to the formation of Bi2MoO6 nanosheets and improves the electrochemical properties of Bi2MoO6/TNTs composites.
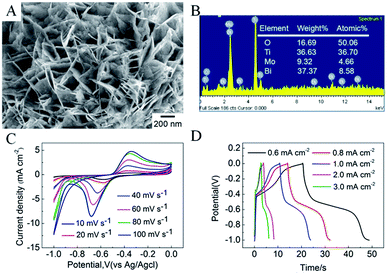 | ||
| Fig. 6 SEM images of Bi2MoO6/Ti (A), EDS spectrum of Bi2MoO6/Ti (B), the CV plots at different scan rates for Bi2MoO6/Ti (C), galvanostatic charge–discharge curves for Bi2MoO6/Ti (D). | ||
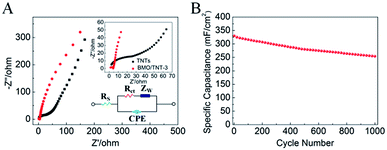
In order to reveal the origin of the electrochemical behaviors of the electrodes, electrochemical impedance spectra (EIS) measurements were recorded over a frequency range of 0.01 Hz to 100 kHz. The Nyquist plots are presented in Fig. 7A. The EIS spectra are almost similar, consisting of a semicircle in the high-frequency region, followed by a sloped line in the low-frequency region, which can be simulated by an equivalent circuit (see the bottom-right inset in Fig. 7A). Table 1 lists the fitted values for the elements of TNT and BMO/TNT-3. The linear part in the low frequency region represents the diffusive resistance of the electrolyte and proton diffusion in active materials, which can be described as the equivalent series resistance (Zw). The Nyquist plot is a vertical line for an ideal electrode material.40
| Equivalent circuit elements | Fitting values | |
|---|---|---|
| TNTs | BMO/TNT-3 | |
| Rs | 1.712 | 1.059 |
| Rct | 14.08 | 3.34 |
| W-R | 98.5 | 0.88547 |
| W-T | 0.0033071 | 0.0033546 |
| W-P | 0.36687 | 0.45265 |
| Cd | 4.1727 × 10⁻⁷ | 1.3009 × 10⁻⁶ |
| Cf | 0.00081 | 0.0498 |
It can be seen that the slope of the straight line of the BMO/TNT-3 electrode is significantly steeper than that of the TNTs, indicating the better capacitive behavior. In the high frequency region, the real axis intercept represents the internal resistance (Rs), including the sum of the intrinsic resistance of the active material, contact resistance at the active material/current collector interface and the ionic resistance of the electrolyte. The semicircle corresponds to the charge transfer resistance (Rct).41,42 As listed in Table 1, the fitted values for Rs, Rct and Zw of BMO/TNT-12 are all smaller than those of the TNTs. This is mainly due to the high electrical conductivity and nanosheet structure of Bi2MoO6, which is in agreement with the CV analysis. Cd and Cf are the double layer capacitance and the faradaic pseudo-capacitance, respectively.43 Compared with the TNTs, the fitted values for Cd and Cf of BMO/TNT-3 are greater, which is attributed to the fast redox reactions of the active materials. These results demonstrated that the BMO/TNT-3 composite electrode with enhanced electrochemical performance, which is benefited from the combined effects of fast ion diffusion and low electron-transfer resistance, was superior to the other samples according to the measurements discussed above with reference to Fig. 5 and 7.
As shown in Fig. 7B, the BMO/TNT-3 composite exhibited 76.7% retention of the initial capacitance after 1000 cycles at 1 mA cm−2, demonstrating the good cycling stability at high current densities. The decrease in active sites and the nanosheet structure damage caused by volume expansion during the cycling process are the main reasons for the reduction of the areal capacitance value.44 In spite of this, the areal capacitance value of BMO/TNT-3 still remained at 253 mF cm−2 after 1000 charge–discharge cycles.
4. Conclusions
In this study, we have reported a simple and optimized solvothermal method to synthesize a Bi2MoO6/TNTs composite material for supercapacitor applications. The morphology of the Bi2MoO6 deposits is highly sensitive to the solvothermal parameters, specifically the precursor amounts, reaction time and reaction temperature. The results indicate that the areal capacitance of the composite materials can reach very high values (∼330 mF cm−2 at a current density of 1 mA cm−2), and the composites exhibit moderate cycling stability together with 76.7% capacitance retention after 1000 continuous charge–discharge cycles. This high areal capacitance value is attained because of the combined effects of the redox reactions associated with the Bi2MoO6 in the presence of the electrolyte as well as the high surface area associated with the nanotubular nature of the substrate material. This study indicates that the Bi2MoO6/TNTs composite electrode with enhanced capacitive performance holds potential for applications in storage devices.Conflicts of interest
There are no conflicts to declare.Acknowledgements
J. Wen is very much grateful to Lingzhu Yu from the National Engineering Research Center for Biomaterials, Sichuan University for the assistance with the microscopy work. J. Wen thanks Ms Sun and Mr Luo for their care and support.References
- Z. Q. Li, W. C. Chen, F. L. Guo, L. E. Mo, L. H. Hu and S. Y. Dai, Sci. Rep., 2015, 5, 14178–14185 CrossRef CAS PubMed.
- Z. N. Yu, L. Tetard, L. Zhai and J. Thomas, Energy Environ. Sci., 2015, 8, 702–730 RSC.
- J. Yang, L. F. Lian, P. X. Xiong and M. D. Wei, Chem. Commun., 2014, 50, 5973–5975 RSC.
- D. Guo, Y. Z. Luo, X. Z. Yu, Q. H. Li and T. H. Wang, Nano Energy, 2014, 8, 174–182 CrossRef CAS.
- X. H. Lu, M. H. Yu, G. M. Wang, Y. X. Tong and Y. Li, Energy Environ. Sci., 2014, 7, 2160–2181 RSC.
- Y. Huang, M. S. Zhu, Y. Huang, H. F. Li, X. Pei, Q. Xue, Z. Liao, Z. F. Wang and C. Y. Zhi, J. Mater. Chem. A, 2016, 4, 4580–4586 RSC.
- J. Xu, Z. Q. Tan, W. C. Zeng, G. X. Chen, S. L. Wu, Y. Zhao, K. Ni, Z. C. Tao, M. Ikram, H. X. Ji and Y. W. Zhu, Adv. Mater., 2016, 28, 5222–5228 CrossRef CAS.
- M. J. Zhi, C. C. Xiang, J. T. Li, M. Li and N. Q. Wu, Nanoscale, 2013, 5, 72–88 RSC.
- S. Gao, K. Wang, Z. L. Du, Y. L. Wang, A. B. Yuan, W. Lu and L. W. Chen, Carbon, 2015, 92, 254–261 CrossRef CAS.
- J. Jiang, Y. Y. Li, J. P. Liu, X. T. Huang, C. Z. Yuan and X. W. Lou, Adv. Mater., 2012, 24, 5166–5180 CrossRef CAS.
- N. T. Nguyen, S. Ozkan, I. Hwang, X. M. Zhou and P. Schmuki, J. Mater. Chem. A, 2017, 5, 1895–1901 RSC.
- L. X. Zheng, C. D. Wang, Y. C. Dong, H. D. Bian, T. F. Hung, J. Lu and Y. Y. Li, Appl. Surf. Sci., 2016, 362, 399–405 CrossRef CAS.
- H. M. Cui, Y. Chen, S. T. Lu, S. Y. Zhang, X. F. Zhu and Y. Song, Electrochim. Acta, 2017, 253, 455–462 CrossRef CAS.
- H. Xia, J. K. Feng, H. L. Wang, M. O. Lai and L. Lu, J. Power Sources, 2010, 195, 4410–4413 CrossRef CAS.
- D. Feng, Y. Y. Lv, Z. X. Wu, Y. Q. Dou, L. Han, Z. K. Sun, Y. G. Xia, G. F. Zheng and D. Y. Zhao, J. Am. Chem. Soc., 2011, 133, 15148–15156 CrossRef CAS PubMed.
- A. Ferris, S. Garbarino, D. Guay and D. Pech, Adv. Mater., 2015, 27, 6625–6629 CrossRef CAS PubMed.
- P. Chen, H. Chen, J. Qiu and C. W. Zhou, Nano Res., 2010, 3, 594–603 CrossRef CAS.
- X. H. Lu, D. Z. Zheng, T. Zhai, Z. Q. Liu, Y. Y. Huang, S. L. Xie and Y. X. Tong, Energy Environ. Sci., 2011, 4, 2915 RSC.
- F. Gobal and M. Faraji, Electrochim. Acta, 2013, 100, 133–139 CrossRef CAS.
- Z. Gonzalez, B. Ferrari, A. J. Sanchez, A. Caballero and J. Morales, Electrochim. Acta, 2016, 211, 110–118 CrossRef CAS.
- D. S. Yuan, T. X. Zhou, S. L. Zhou, W. J. Zou, S. S. Mo and N. N. Xia, Electrochem. Commun., 2011, 13, 242–246 CrossRef CAS.
- B. Chen, J. Hou and K. Lu, Langmuir, 2013, 29, 5911–5919 CrossRef CAS PubMed.
- H. L. Tang, M. Xiong, D. Y. Qu, D. Liu, Z. J. Zhang, Z. Z. Xie, X. Wei, W. M. Tu and D. Y. Qu, Nano Energy, 2015, 15, 75–82 CrossRef CAS.
- M. Salari, K. Konstantinov and H. K. Liu, J. Mater. Chem., 2011, 21, 5128–5133 RSC.
- A. Ramadoss and S. J. Kim, Int. J. Hydrogen Energy, 2014, 39, 12201–12212 CrossRef CAS.
- A. Sarkar, A. K. Singh, D. Sarkar, G. G. Khan and K. Mandal, ACS Sustainable Chem. Eng., 2015, 3, 2254–2263 CrossRef CAS.
- L. W. Zhang, T. G. Xu, X. Zhao and Y. F. Zhu, Appl. Catal., B, 2010, 98, 138–146 CrossRef CAS.
- G. H. Tian, Y. J. Chen, W. Zhou, K. Pan, Y. Z. Dong, C. G. Tian and H. G. Fu, J. Mater. Chem., 2011, 21, 887–892 RSC.
- B. Senthilkumar, R. K. Selvan, L. Vasylechko and M. Minakshi, Solid State Sci., 2014, 35, 18–27 CrossRef CAS.
- Z. Q. Liu, L. Y. Tang, N. Li, K. Xiao, J. Wang, J. H. Zhang, Y. Z. Su and Y. X. Tong, J. Electrochem. Soc., 2012, 159, D582–D586 CrossRef CAS.
- H. D. Liu, J. L. Zhang, D. D. Xu, L. H. Huang, S. Z. Tan and W. J. Mai, J. Solid State Electrochem., 2015, 19, 135–144 CrossRef CAS.
- Z. P. Ma, G. J. Shao, Y. Q. Fan, G. L. Wang, J. J. Song and D. J. Shen, ACS Appl. Mater. Interfaces, 2016, 8, 9050–9058 CrossRef CAS.
- B. Sarma, A. L. Jurovitzki, Y. R. Smith, S. K. Mohanty and M. Misra, ACS Appl. Mater. Interfaces, 2013, 5, 1688–1697 CrossRef CAS PubMed.
- H. Zhou and Y. R. Zhang, J. Power Sources, 2014, 272, 866–879 CrossRef CAS.
- L. S. Zhang, K. H. Wong, Z. G. Chen, J. C. Yu, J. C. Zhao, C. Hu, C. Y. Chan and P. K. Wong, Appl. Catal., A, 2009, 363, 221–229 CrossRef CAS.
- F. S. Wu, X. H. Wang, W. R. Zheng, H. W. Gao, C. Hao and C. W. Ge, Electrochim. Acta, 2017, 245, 685–695 CrossRef CAS.
- A. K. Singh, D. Sarkar, G. G. Khan and K. Mandal, ACS Appl. Mater. Interfaces, 2014, 6, 4684–4692 CrossRef CAS.
- F. X. Bao, Z. Q. Zhang, W. Guo and X. Y. Liu, Electrochim. Acta, 2015, 157, 31–40 CrossRef CAS.
- R. B. Rakhi, W. Chen, D. Cha and H. N. Alshareef, J. Mater. Chem., 2011, 21, 16197–16204 RSC.
- M. D. Stoller, S. Park, Y. W. Zhu, J. An and R. S. Ruoff, Nano Lett., 2008, 8, 3498–3502 CrossRef CAS PubMed.
- Z. J. Fan, J. Yan, T. Wei, L. J. Zhi, G. Q. Ning, T. Y. Li and F. Wei, Adv. Funct. Mater., 2011, 21, 2366–2375 CrossRef CAS.
- H. Peng, G. F. Ma, K. J. Sun, J. J. Mu, H. Wang and Z. Q. Lei, J. Mater. Chem. A, 2014, 2, 3303–3307 RSC.
- M. Kundu and L. F. Liu, J. Power Sources, 2013, 243, 676–681 CrossRef CAS.
- Y. Ma, Y. L. Jia, L. N. Wang, M. Yang, Y. P. Bi and Y. X. Qi, J. Power Sources, 2016, 331, 481–486 CrossRef CAS.
Footnote |
| † Electronic supplementary information (ESI) available. See DOI: 10.1039/c8ra08604d |
| This journal is © The Royal Society of Chemistry 2019 |

