 Open Access Article
Effect of initial support particle size of MnOx/TiO2 catalysts in the selective catalytic reduction of NO with NH3†
Yang Yangab,
Zhun Hu *a,
Rongli Mia,
Dan Lia,
Xiang Yonga,
Huie Yangb and
Kunfeng Liub
aInstitute of Industrial Catalysis, School of Chemical Engineering and Technology, Xi'an Jiaotong University, Xi'an, Shaanxi 710049, China. E-mail: huzhun@mail.xjtu.edu.cn; Fax: +86-29-82663189; Tel: +86-29-82663189
bSinochem Modern Environmental Protection Chemicals (Xi'an) Co. LTD., Xi'an, Shaanxi 710201, China
First published on 6th February 2019
Abstract
A series of manganese-based catalysts supported by 5–10 nm, 10–25 nm, 40 nm and 60 nm anatase TiO2 particles was synthesized via an impregnation method to investigate the effect of the initial support particle size on the selective catalytic reduction (SCR) of NO with NH3. All catalysts were characterized by transmission electron microscopy (TEM), N2 physisorption/desorption, X-ray diffraction (XRD), temperature programmed techniques, X-ray photoelectron spectroscopy (XPS) and in situ diffuse reflectance infrared transform spectroscopy (DRIFTS). TEM results indicated that the particle sizes of the MnOx/TiO2 catalysts were similar after the calcination process, although the initial TiO2 support particle sizes were different. However, the initial TiO2 support particle sizes were found to have a significant influence on the SCR catalytic performance. XPS and NH3-TPD results of the MnOx/TiO2 catalysts illustrated that the surface Mn4+/Mn molar ratio and acid amount could be influenced by the initial TiO2 support particle sizes. The order of surface Mn4+/Mn molar ratio and acid amount over the MnOx/TiO2 catalysts was as follows: MnOx/TiO2(10–25) > MnOx/TiO2(40) > MnOx/TiO2(60) > MnOx/TiO2(5–10), which agreed well with the order of SCR performance. In situ DRIFTS results revealed that the NH3-SCR reactions over MnOx/TiO2 at low temperature occurred via a Langmuir–Hinshelwood mechanism. More importantly, it was found that the bridge and bidentate nitrates were the main active substances for the low-temperature SCR reaction, and bridge nitrate adsorbed on Mn4+ showed superior SCR activity among all the adsorbed NOx species. The variation of the initial TiO2 support particle size over MnOx/TiO2 could change the surface Mn4+/Mn molar ratio, which could influence the adsorption of NOx species, thus bringing about the diversity of the SCR catalytic performance.
1 Introduction
Nitrogen oxides (NOx), as a harmful exhaust emission, can induce various human health and environmental hazards, such as acid rain, photochemical smog, and ozone layer depletion.1,2 Increasing attention has been focused on NOx abatement, including NOx storage-reduction (NSR or LNT),3–5 NOx decomposition, and Selective Catalytic Reduction (SCR).6–8 SCR technology has been regarded as the most promising way to remove NOx, and has been commercially applied in diesel engines and power plants. However, due to increasingly strict emission legislation, it is crucial to develop future catalysts for low-temperature NOx abatement techniques, to meet future exhaust gas emission legislation.9Because of their various valence states and low cost, transition metal oxides (MnOx, FeOx, CoOx, CuOx), are usually used as catalysts in SCR research.6–18 Owing to their inherent instability and poor anti-sintering ability, transition metal oxides are usually supported on an “inert” support to enhance their thermal stability and catalyst lifespan. Pena et al.19 investigated low-temperature SCR using VOx, CrOx, MnOx, FeOx, CoOx, NiOx and CuOx catalysts supported on TiO2. The SCR activity for the various transition metal oxides as active sites supported on TiOx decreased in the following order: MnOx > CuOx ≥ CrOx ≥ CoOx > FeOx ≫ VOx ⋙ NiOx, indicating that MnOx was the most promising catalyst for future practical applications. Among supported catalysts, the properties of the support and the interaction between MnOx and the support are often considered to be the main parameters affecting the catalytic activity. Smirniotis et al.20 synthesized a series of manganese oxides supported on TiO2, Al2O3, and SiO2 to investigate the influence of the support on SCR activity with a space velocity 8000 h−1. They found that the SCR activity of the supported MnOx catalysts decreased in the following order: TiO2 (anatase) > SiO2 > TiO2 (rutile) > TiO2 (anatase, rutile) > γ-Al2O3. MnOx/TiO2 (anatase) showed excellent NOx abatement activity, even at 120 °C when it reached complete conversion. Therefore, MnOx/TiO2 catalysts have been investigated on the basis of the effects of the preparation method,21 manganese precursors22 and manganese loading23 on SCR activity.19,24 However, the interaction between manganese oxides and TiO2 has not been fully investigated, especially on the effect of the support size.
The interaction between the active component and the support is not only influenced by the support type, but also relies on the size of the support.25–30 Soykal et al.30 studied the effect of support particle size in steam reforming of ethanol over CoOx/CeO2 catalysts with CeO2 support particle sizes in the micro- and nano-range. CoOx/CeOx with smaller CeO2 particle sizes manifested superior catalytic performance and coking resistance ability. These results can be ascribed to a combination of factors, including reducibility, dispersion and redox sites on the catalyst surface. All of these properties could be affected by the particle size of the support, thus leading to different catalytic performances. Pakulska et al.28 investigated the effect of support particle size over NiO/ZrO2 and NiO/CeO2 on the catalytic oxidation of methane. They found that zirconia particles size could change the number of catalytic sites via varying the pre-exponential factor and ceria size could change the reaction activation energy by varying oxygen transport to the active sites. Xu et al.25–27 studied a series of Ni/ZrO2 catalysts with various ZrO2 particle sizes to systematically investigate the effect of support particle size on the reforming of methane with CO2. Their proposed nanocomposite catalyst, which could be defined as a catalyst with comparable Ni metal and zirconia nanocrystals, showed superior catalytic activity and long-term stability. They attributed this excellent catalytic performance to the boundary or perimeter between Ni and ZrO2, which could easily be generated by similar-sized Ni and ZrO2 particles. All of the above examples illustrate that the support size can significantly influence the catalytic performance and catalyst lifespan, by affecting the properties of active sites or the boundary between active sites and the support. However, up until now, corresponding research regarding the effect of support size on NOx abatement has rarely been reported.
In this work, a series of MnOx/TiO2 catalysts was prepared via an impregnation method with a variation of TiO2 support particle sizes to investigate the effect of the initial TiO2 support size on the SCR performance. In addition, these catalysts were characterized by N2 physisorption, TEM, XRD, H2-TPR, O2-TPD, XPS and DRIFTS, to understand the effects of the structure, redox properties and active site-support interaction on the SCR catalysis.
2 Experimental
2.1 Preparation of catalysts
Anatase TiO2 particles of various sizes (Aladdin Reagent Co., Ltd.) were used as support materials without any purification. All of the catalysts were synthesized via a wet impregnation method. In a typical process, 2 g TiO2 with various particle sizes and 0.84 mL 50 wt% Mn(NO3)2 (Tianjin Fuchen chemical reagents company) were added into 20 mL deionized water, and the mixture was vigorously stirred for 24 h at room temperature. Then the solution was dried under vacuum at 60 °C in a rotary evaporator. The obtained powder was dried at 110 °C overnight, and then calcined at 550 °C for 5 h with a heating rate of 1 °C min−1 in a muffle furnace. The obtained materials were denoted as MnOx/TiO2(n), where n represents the particle size of TiO2. The actual manganese loading of the catalysts was determined by X-ray fluorescence spectrometry (XRF).2.2 Catalytic test
A catalytic performance test for the NH3-SCR reaction was implemented in a fixed-bed plug-flow stainless-steel tubular reactor (L = 60 cm, Φin = 7 mm). The typical components of the simulated gas were as follows: 500 ppm NO, 500 ppm NH3, 5 vol% O2 and balance Ar with a space velocity of 40![[thin space (1/6-em)]](https://www.rsc.org/images/entities/char_2009.gif) 000 mL g−1 h−1. The reaction temperature was recorded by a K-type thermocouple located inside the tube near the catalyst bed. Prior to the SCR catalytic measurements, the catalyst was pretreated in 20 vol% O2/Ar at 400 °C for 1 h. The reaction was carried out from 50 °C to 350 °C with an increment of 25 °C and each temperature was held for 1 h to obtain a stable reaction conversion. The concentration of NOx was detected by a fuel analyzer (AFRISO, M 60). NOx conversion was calculated using the following equation:
000 mL g−1 h−1. The reaction temperature was recorded by a K-type thermocouple located inside the tube near the catalyst bed. Prior to the SCR catalytic measurements, the catalyst was pretreated in 20 vol% O2/Ar at 400 °C for 1 h. The reaction was carried out from 50 °C to 350 °C with an increment of 25 °C and each temperature was held for 1 h to obtain a stable reaction conversion. The concentration of NOx was detected by a fuel analyzer (AFRISO, M 60). NOx conversion was calculated using the following equation:2.3 Catalyst characterization
N2 adsorption–desorption isotherms were collected at −196 °C on a BELSORP-Max analyzer. Prior to each measurement, the catalyst was degassed under high vacuum at 300 °C for 3 h. The surface area of each sample was obtained using the Brunauer–Emmett–Teller (BET) method and the pore size distribution was determined via the Barrett–Joyner–Halenda (BJH) method using desorption branch.X-ray diffraction (XRD) patterns were measured on a SHIMADZU XRD-6100 Powder diffractometer using a Cu Kα radiation source (λ = 0.15406 nm). The diffraction patterns were recorded over a 2θ range of 10–80° with a scan speed of 6 ° min−1 and a step size of 0.02°.
H2-temperature programmed reduction (H2-TPR) experiments were performed on a Quantachrome ChemBET Pulsar chemisorption analyzer with a thermal conductivity detector (TCD). H2-TPR curves were acquired in 5 vol% H2/He from 50 °C to 800 °C with a temperature rate of 10 °C min−1 and held at 800 °C for 30 min. Prior to each measurement, about 0.040 g sample was pretreated from room temperature to 500 °C with a temperature rate of 10 °C min−1 in a flowing purified He gas (30 mL min−1) and was then kept at 500 °C for 30 min, in order to remove weakly adsorbed moisture and gas on the catalyst surface. After the sample was cooled to 50 °C, the flowing gas was switched to 5 vol% H2 + He (30 mL min−1) and the sample was purged for 30 min until the TCD signal was stable. NH3-temperature programmed desorption (NH3-TPD) experiments were carried out using the same equipment. NH3-TPD curves were obtained in flowing He (30 mL min−1) from 50 °C to 800 °C with a temperature ramp rate of 10 °C min−1, and 800 °C was held for 30 min. The pretreatment procedure for NH3-TPD was similar to that of H2-TPR. Adsorption of NH3 was conducted under flowing 5 vol% NH3 + He for ca. 30 min at 100 °C, and then purged with flowing He until the baseline became stable.
O2-TPD experiments were performed on a mass spectrometer (TILON GRP TECHNOLOGY LIMITED LC-D200M). O2-TPD curves were obtained under flowing N2 (30 mL min−1) from 100 °C to 800 °C with a temperature ramp rate of 10 °C min−1, and 800 °C was held for 30 min. Prior to each measurement, about 100 mg of sample was pretreated in a U-shaped quartz tube at 500 °C for 30 min under flowing N2 (30 mL min−1), followed by cooling to 100 °C. Adsorption of oxygen was then conducted at 20 vol% O2 + N2 for ca. 30 min at 100 °C until the O2 signal became stable. After purging with flowing N2 until the baseline signal reached a stable state, the O2-TPD signals began to be recorded with the mass-to-charge ratios (m/z = 16 and 32).
Transmission Electron Microcopy (TEM) was conducted on a Tecnai G2 F20 transmission electron microscope. More than 200 particles were randomly measured to determine the mean diameter of TiO2 and MnOx/TiO2 catalysts, using the equation d = ∑(nidi)/∑ni, where ni is the number of particles with a diameter of di.
The components of the catalysts were examined on a Bruker S8 TIGERX X-Ray Fluorescence analyzer (XRF), equipped with a 60 kV X-ray tube (Rh Kα radiation) with a maximum power of 4 W, and a maximum current of 170 mA. The XPS spectra were conducted on a Kratos Analytical AXIS Ultra DLD spectrometer with an Al Kα radiation source (hν = 1253.6 eV), operated at an accelerating power of 15 kW. The samples were degassed with vacuum-pumping to 5 × 10⁻⁷ Pa before the measurement. The binding energy was calibrated by the C 1s peak at 284.8 eV and the final spectra were obtained by subtracting a Shirley-type background.
In situ diffusion reflection infrared Fourier transformed spectroscopy (DRIFTS) experiments were conducted on a Nicolet iS50 FTIR spectrometer equipped with a DRIFT cell containing ZnSe windows and MCT detector.31 The spectra were obtained from 4000 to 525 cm−1 at a resolution of 2 cm−1 by accumulating 32 scans. The temperature was controlled by a Pike temperature controller and the gas composition was governed by mass flow control (MFC). The catalyst was pretreated at 500 °C for 1 h under flowing 20 vol% O2 + N2 (40 mL min−1) and was then cooled down to 100 °C. The background spectrum was recorded under flowing N2 at 100 °C, which was further subtracted from the sample spectrum.
3 Results and discussion
3.1 Catalytic performance
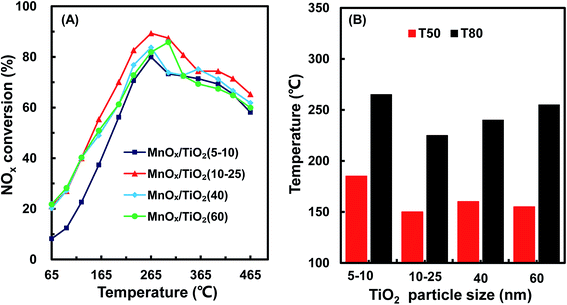
Fig. 1 shows the NH3-SCR catalytic performance of the MnOx/TiO2(n) catalysts with various TiO2 particle sizes. For all the catalysts, NOx conversion firstly increased gradually from 65 °C to 265–290 °C, and then decreased steadily with further increasing of the temperature to 400 °C. The maximum NOx conversion temperature was 265 °C for MnOx/TiO2(5–10), MnOx/TiO2(10–25) and MnOx/TiO2(40) and 290 °C for MnOx/TiO2(60). These results can be attributed to various SCR reaction pathways based on the NO2/NO ratio.6,7,9,10,32 The pathway of the NH3-SCR reaction was regarded to occur via three reaction routes; namely, standard-, fast- and slow-SCR, which rest on the NO2/NO fraction in the reaction feed.7| 4NH3 + 4NO + O2 → 4N2 + 6H2O, standard SCR |
| 4NH3 + 2NO + 2NO2 → 2N2 + 6H2O, fast SCR |
| 4NH3 + 2NO2 + O2 → ON2 + 6H2O, slow SCR |
As shown in Fig. 1, at the initial stage, the reaction occurred through a standard route. With increasing reaction temperature, the NO2/NO ratio increased through NO oxidation, inducing a variation in the main reaction pathway from the standard route to fast SCR. With increasing the reaction temperature, the ratio of NO2/NO increased above 1, causing the main reaction pathway to change to slow SCR from fast SCR.33,34 By further increasing reaction temperature, the NO2/NO ratio decreased with the restriction of the thermal equilibrium of NO2 decomposition. The main reaction pathway changed to the standard SCR, thus decreasing the SCR catalytic activity.33
In order to compare the catalytic performance of the various catalysts, T50 and T80 (the temperatures of NOx conversion at 50% and 80%) were introduced and are shown in Fig. 1B. T50 decreased from 160 °C to 155 °C and 135 °C, when the TiO2 particle sizes decreased from 60 nm to 40 nm and 10–25 nm. Nevertheless, by further decreasing the TiO2 particle size from 10–25 nm to 5–10 nm, T50 increased from 135 °C to 185 °C. A similar trend could be found in T80 as T50 over the corresponding catalysts. The catalytic activity of the MnOx/TiO2(n) catalysts showed a volcano-type dependence on the TiO2 particle size, reaching a maximum at 10–25 nm. These results illustrated that the SCR performance of the MnOx/TiO2(n) catalysts varied with the TiO2 support particle size. Soykal et al.30 reported that the support particle size could change the reducibility and relative amount of redox sites on the catalyst surface. Generally, the SCR activity could be dependent on the surface acidity property, redox property and their synergistic effects.6,32 The various initial TiO2 support sizes could affect the characteristics of the manganese oxide active sites, and could thereby have an impact on the SCR catalytic performance. Therefore, the characteristics of the supported manganese catalysts, such as redox, acidity and their synergistic effects, were then investigated to assess the effect of initial TiO2 support particle size on the SCR performance of the MnOx/TiO2(n) catalysts.
3.2 TEM
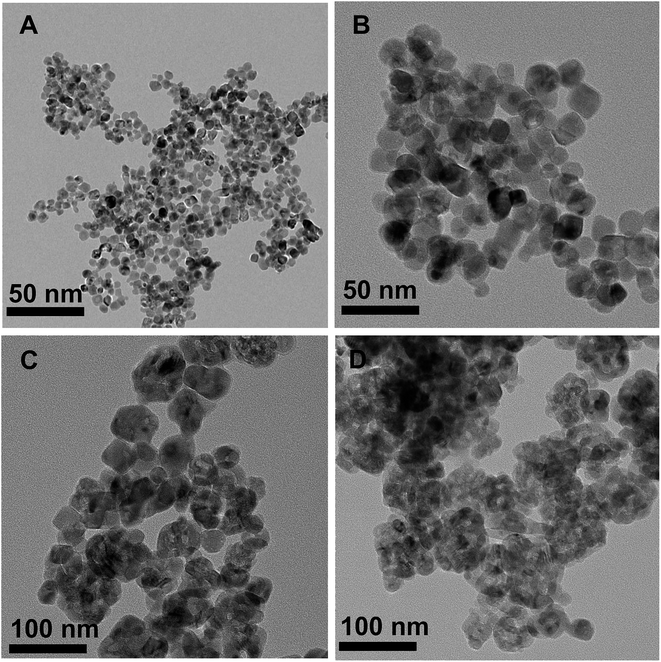
Fig. 2 shows TEM images of various TiO2 support sizes. The size distribution of the various TiO2 supports was 8.2 ± 3.5 nm, 18.3 ± 7.4 nm, 43.5 ± 5.2 nm and 63.6 ± 5.2 nm, similar to as purchased. However, the size distributions of the various MnOx/TiO2 catalysts, as shown in Fig. S1,† were similar. All the MnOx/TiO2 catalysts had an average diameter of ca. 55 nm. These results revealed that the impregnation and calcination process resulted in the variation in the particle sizes of the MnOx/TiO2 catalysts.3.3 XRD
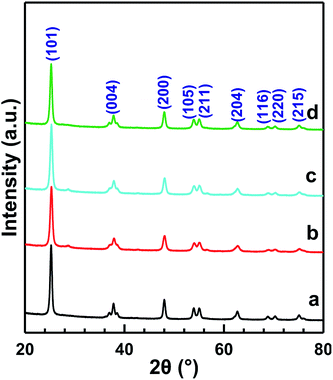
Fig. 3 shows the XRD patterns of MnOx/TiO2(n) with various TiO2 particle sizes. All of the catalysts showed the same 2θ diffraction positions and different diffraction intensities. The diffraction of 2θ at 25.3°, 37.8°, 48.0°, 53.9°, 55.1°, 62.8°, 68.9°, 70.5° and 75.2° could be assigned to (101), (004), (200), (105), (211), (204), (116), (220) and (215) planes of anatase-TiO2 (JCPDS, 65-5714), respectively. The theoretical monolayer coverage amount could be estimated from structural calculations.35–37 Based on the cation density of MnOx, a reference value of 15 Å2 per MnOx unit was used to calculate the monolayer surface coverage.35–37 The virtual loading was ca. 3.1 wt% Mn for monolayer surface coverage, according to the surface area of our investigated samples. Mn loading in our investigated catalysts was 10 wt%, which was more than three times that of the monolayer manganese amount. However, no independent diffraction peaks corresponding to manganese oxides could be observed in all the samples, indicating that the incorporated manganese oxides were in a highly dispersed state or in an amorphous or poorly crystalline state. These results could be ascribed to the strong interaction between Mn and anatase TiO2, which is in agreement with the previous reports.20,233.4 Textural properties of the catalysts
Fig. 4 shows the N2 adsorption/desorption isotherms and pore size distributions of the MnOx/TiO2(n) catalysts with various TiO2 particle sizes. For all the MnOx/TiO2(n) catalysts, the N2 adsorption/desorption isotherms show similar type IV behavior and hysteresis loops attributed to type H1. The corresponding quantification parameters of the textural properties, including BET specific surface area, total pore volume and average pore diameter, are shown in Table 1. All of the catalysts showed similar specific surface areas (50.2–57.4 m2 g−1), pore volumes (0.27–0.29 mL g−1) and mean pore diameters (20–27 nm). It should be noted that the pore sizes were much larger than the dynamic size of the feed gas, indicating that the pore structures of the MnOx/TiO2(n) catalysts were feasible for reactant molecule diffusion.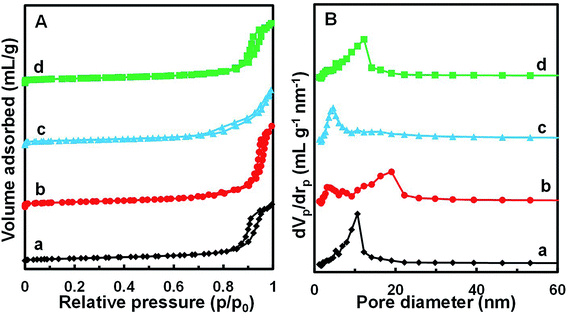 | ||
| Fig. 4 N2 adsorption/desorption isotherms (A) and BJH pore distribution curves (B) of MnOx/TiO2(n) catalysts: n = 5–10 (a), 10–25 (b), 40 (c) and 60 (d). | ||
3.5 H2-TPR
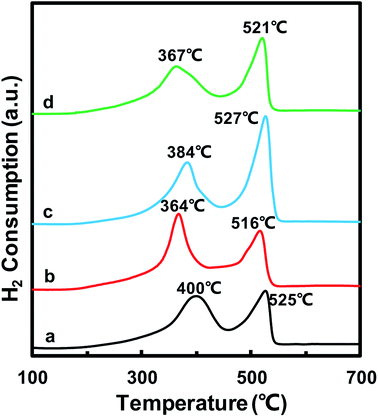
The redox properties of catalysts play an important role in the NH3-SCR reaction. Thus, H2-TPR experiments were carried out to determine the oxidative properties of the MnOx/TiO2(n) catalysts and the results are shown in Fig. 5. All of the catalysts exhibited two broad hydrogen consumption peaks. The lower temperature reduction peak in the temperature range of 300–450 °C could be attributed to the reduction of Mn4+ to Mn3+ and Ti4+ to Ti3+, which originated from interaction between MnOx and TiO2.23,38–41 The higher temperature peak in the temperature range of 450–600 °C could be ascribed to the reduction of Mn3+ to Mn2+.38,42,43 It should be noted that the temperature peaks were different for MnOx/TiO2(n) with different initial TiO2 particle sizes. For MnOx/TiO2(5–10), MnOx/TiO2(10–25), MnOx/TiO2(40) and MnOx/TiO2(60), the reduction peaks at lower temperature were centered at 400 °C, 364 °C, 384 °C and 367 °C, while the higher temperature reduction peaks were 525 °C, 516 °C, 527 °C and 521 °C, respectively. In previous studies, the SCR performance of MnOx/TiO2 catalysts has been related to the oxidation state of surface Mn atoms, especially the properties of surface Mn4+ species.38,42,43 The lower peak temperature of MnOx/TiO2(n) represents a higher oxidative property and oxygen mobility. The order of the peak temperatures in the temperature range of 300–450 °C for the MnOx/TiO2(n) catalysts was as follows: MnOx/TiO2(10–25) (364 °C) < MnOx/TiO2(60) (367 °C) < MnOx/TiO2(40) (384 °C) < MnOx/TiO2(5–10) (400 °C). MnOx/TiO2(60) and MnOx/TiO2(40) showed different trends in their corresponding SCR catalytic activity. The catalytic activity was not only decided by the properties of active sites, but also relied on the number of active sites. The peak area in the temperature range of 300–450 °C for MnOx/TiO2(40), which was associated with the amount of Mn4+, was higher than that for MnOx/TiO2(60). Therefore, the properties and amount of Mn4+ in MnOx/TiO2(n) could also be affected by the TiO2 particle size, thus influencing the SCR catalytic activity.3.6 O2-TPD
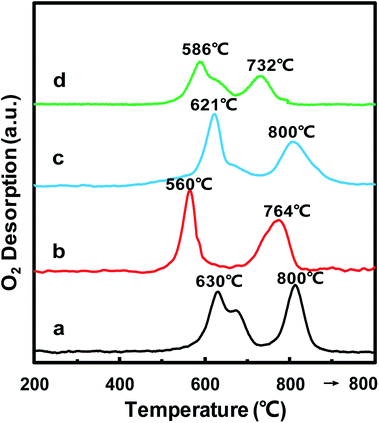
In order to further confirm the oxidative properties and oxygen mobility, O2-TPD was then used to characterize the oxygen mobility of the MnOx/TiO2(n) catalysts. Fig. 6 shows the O2-TPD curves of the MnOx/TiO2(n) catalysts with various TiO2 particle sizes. For all of the MnOx/TiO2(n) catalysts, there are two desorption peaks centered at 500–700 °C and 700–800 °C, respectively. The desorption of O2 at a temperature above 200 °C in O2-TPD for the manganese-based catalysts is associated with the evolution of oxygen from the lattice (surface or bulk).44 The lower temperature peak in the temperature range of 500–700 °C was attributed to the surface lattice oxygen and related to the surface oxygen vacancies, which is often correlated with a high oxidation ability.45,46 The higher temperature peak at temperatures above 700 °C could be assigned to bulk lattice oxygen, which was generally not correlated to oxidation ability and strongly bound to the lattice.46 The peak temperature in the temperature range of 500–700 °C for MnOx/TiO2(10–25) was 560 °C, which was lower than that of MnOx/TiO2(5–10) (630 °C), MnOx/TiO2(40) (621 °C) and MnOx/TiO2(60) (586 °C). Meanwhile, the order of the lower temperature peak amount was similar to H2-TPR.3.7 NH3-TPD
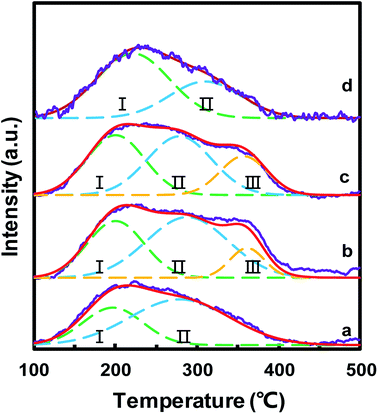
The surface acid sites of the catalysts played a significant role in the NH3-SCR reaction, which could adsorb and activate NH3. NH3-TPD was used to study the surface acidity of MnOx/TiO2(n), as depicted in Fig. 7. For all the MnOx/TiO2(n) catalysts, the NH3-TPD curves featured a broad peak between 100 and 400 °C. All these desorption peaks were divided into two or three peaks based on the Gaussian peak shape model. The desorption peaks were labeled as I, II and III, according to the peak temperature from low to high, which could be attributed to the NH3 desorbed from weak acid sites, medium acid sites and strong acid sites, respectively.17,47 The peak temperature and corresponding area in NH3-TPD were calculated and are listed in Table 2. The peak temperature of MnOx/TiO2 with TiO2 < 40 nm was ca. 200 °C, which is lower than that of MnOx/TiO2(60). More importantly, the order of the acid amount for the MnOx/TiO2(n) catalysts was as follows: MnOx/TiO2(10–25) > MnOx/TiO2(40) > MnOx/TiO2(60) > MnOx/TiO2(5–10), which is also in accordance with the catalytic activity of the counterpart catalysts, suggesting that the particle size of the support not only influences the oxidizing ability but also the acidic properties.| Catalyst | Temperature (°C) | Acid amount (μmol g−1) | |||||
|---|---|---|---|---|---|---|---|
| TI | TII | TIII | SI | SII | SIII | SI + SII + SIII | |
| Mn/TiO2(5–10) | 197 | 279 | — | 194 | 397 | — | 591 |
| Mn/TiO2(10–25) | 200 | 288 | 361 | 279 | 430 | 89 | 798 |
| Mn/TiO2(40) | 200 | 279 | 357 | 301 | 329 | 158 | 789 |
| Mn/TiO2(60) | 222 | 310 | — | 408 | 228 | — | 636 |
Compared with larger TiO2 support particle size, a smaller TiO2 particle size could provide a greater boundary area between active sites and supports, which is beneficial for the synergistic effect between acid sites and redox sites. As previously reported, low-temperature selective catalytic reduction mainly occurs via a Langmuir–Hinshelwood mechanism. The SCR activity was controlled not only by the activation of NO, O2 and NH3 reactant, but also by the synergistic effect between acid sites and redox sites.
3.8 XPS
In order to further acquire information regarding the oxidation state of manganese on the catalyst surface, XPS spectra of the MnOx/TiO2(n) catalysts were recorded. Fig. 8 shows the Mn 2p spectra of the MnOx/TiO2 catalysts with various TiO2 particle sizes. The Mn 2p spectra of MnOx/TiO2(n) catalysts were deconvoluted based on the Gaussian–Lorentzian (GL(30)) line shape after subtracting a Shirley baseline. All the Mn 2p1/2 and 2p3/2 peaks of each Mn species have the same half height peak width and the center of the Mn 2p1/2 and 2p3/2 peaks was 11.7 eV. Mn 2p spectra of the MnOx/TiO2(n) catalysts could be divided into two peaks with maxima at 644.1–645.3 eV and 641.9–642.5 eV, which can be assigned to Mn4+ and Mn3+, respectively.23,41,42,48,49 The quantitation results of the Mn4+/Mn molar ratio in XPS spectra are shown in Table 1. It can be seen that the Mn4+/Mn molar ratio of the MnOx/TiO2(10–25) catalyst was 0.48, which is higher than 0.35 for MnOx/TiO2(40), 0.34 for MnOx/TiO2(60) and 0.29 for MnOx/TiO2(5–10). Moreover, the order of the surface Mn4+/Mn molar ratio on the MnOx/TiO2(n) catalysts was as follows: MnOx/TiO2(10–25) > MnOx/TiO2(40) > MnOx/TiO2(60) > MnOx/TiO2(5–10), which agrees well with the SCR catalytic performance. These results demonstrate that the TiO2 particle size could influence the oxidation state of surface manganese oxides, leading to the variation in Mn4+ concentration, which could be ascribed to the interaction between manganese oxides and titanium.42,50 Thirupathi et al. also investigated the effect of the surface manganese species on the SCR performance and found that surface Mn4+ on the TiO2 support was directly associated with the SCR performance.42 All of these results revealed that initial TiO2 particle size can affect the oxidizing ability and oxygen mobility. The higher oxidizing ability could increase the NO2/NOx ratio in the actual reaction feed, which could increase the proportion of “fast SCR” reaction route, and thereby enhance the SCR activity.50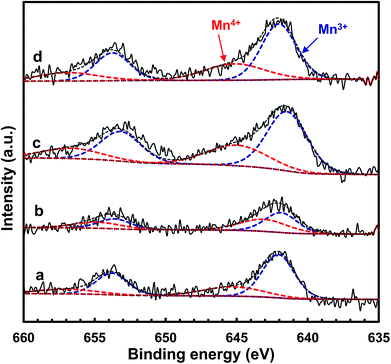 | ||
| Fig. 8 XPS spectra for Mn 2p of the MnOx/TiO2(n) catalysts: n = 5–10 (a), 10–25 (b), 40 (c) and 60 (d). | ||
3.9 In situ DRIFTS studies
3.10 Origin of SCR activity
Combining the results obtained in this study, we could conclude that the low-temperature SCR activity over MnOx/TiO2 occurred via a Langmuir–Hinshelwood mechanism.Therefore, the NH3-SCR reaction over MnOx/TiO2 can be described by the following pathways.
At low temperature, the reaction pathway occurred as a Langmuir–Hinshelwood mechanism.6
| O2 (g) + * → 2O* |
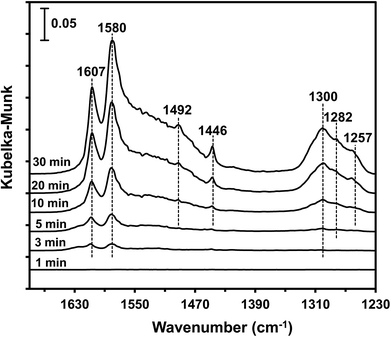
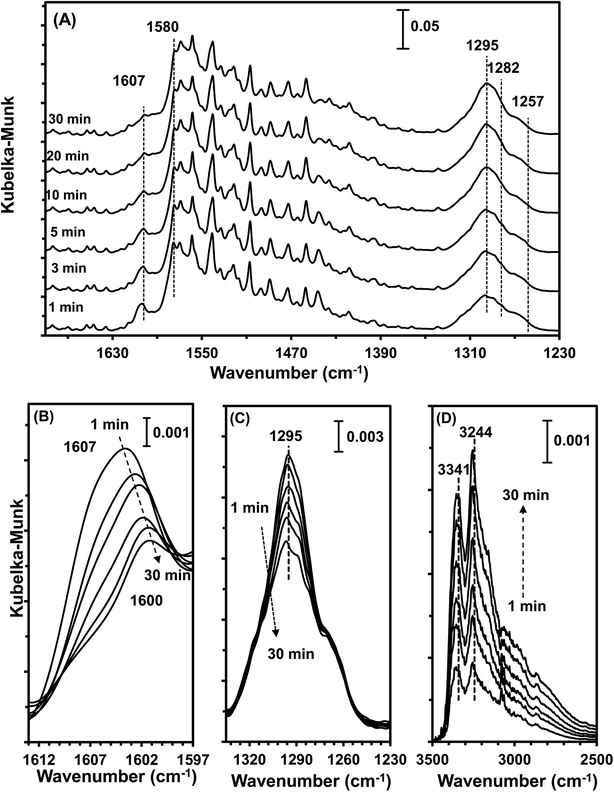
The type of adsorbed NOx species on manganese oxides has a prominent effect on the SCR activity. The order of SCR activity of various adsorbed nitrates was as follows: bridge nitrate > bidentate nitrate > monodentate nitrate. The bridge nitrate and bidentate nitrate were the main contributors to the SCR activity, while the monodentate nitrate showed no activity, which agreed with previous work.50 Moreover, among all the bridge nitrates on various manganese oxides, bridge nitrate on the high-valence manganese species (e.g. Mn4+) was the most active species in the low-temperature SCR reaction, which could been proved by the blue shift on the DRIFT spectra in a flow of NH3 after pretreatment with NO + O2. A higher Mn4+/Mn molar ratio could produce more bridge nitrate on Mn4+, thus increasing the SCR activity.
4 Conclusions
In this work, a series of MnOx/TiO2 catalysts with various initial TiO2 particle sizes was prepared via an impregnation method for the selective catalytic reduction of NO with NH3. The MnOx/TiO2(10–25) catalyst showed superior low-temperature SCR catalytic activity. The XRD results illustrated a high dispersion of manganese oxides on all the catalysts via interactions between manganese oxides and anatase TiO2. H2-TPR, O2-TPD, NH3-TPD and XPS results indicated that the acid amount and Mn4+/Mn molar ratio were dependent on the initial TiO2 support particle size. The order of surface acidity and Mn4+/Mn molar ratio was as follows: MnOx/TiO2(10–25) > MnOx/TiO2(40) > MnOx/TiO2(60) > MnOx/TiO2(5–10), which agreed well with the order of SCR activity on the corresponding catalysts. Furthermore, the in situ DRIFTS results showed that the low-temperature SCR reaction occurred via a Langmuir–Hinshelwood mechanism and the adsorbed NOx was the key factor in the low-temperature SCR activity. The order of adsorbed NOx species activity on manganese oxides was as follows: bridge nitrate > bidentate nitrate > monodentate nitrate. Moreover, the bridge nitrate on Mn4+ was the greatest contributor to the low-temperature SCR activity. The variation of the initial TiO2 support particle size influenced the surface Mn4+/Mn molar ratio of the MnOx/TiO2 catalysts, which would promote the reactivity of the bridge nitrate, therefore enhancing SCR performance.Conflicts of interest
There are no conflicts to declare.Acknowledgements
We acknowledge the financial support from the China Postdoctoral Science Foundation (2017M613143), the Natural Science Foundation of Shaanxi Province of China (2017JQ2016), and the National Natural Science Foundation of China (21802107).References
- X. Liu, Y. Zhang, W. Han, A. Tang, J. Shen, Z. Cui, P. Vitousek, J. W. Erisman, K. Goulding, P. Christie, A. Fangmeier and F. Zhang, Nature, 2013, 494, 459–462 CrossRef CAS PubMed.
- Y. Cheng, G. Zheng, C. Wei, Q. Mu, B. Zheng, Z. Wang, M. Gao, Q. Zhang, K. He, G. Carmichael, U. Poschl and H. Su, Sci. Adv., 2016, 2, e160153012 Search PubMed.
- S. Roy and A. Baiker, Chem. Rev., 2009, 109, 4054–4091 CrossRef CAS PubMed.
- Z. Hu, K. Q. Sun, W. Z. Li and B.-Q. Xu, Catal. Today, 2010, 158, 432–438 CrossRef CAS.
- Z. Hu, W.-Z. Li, K.-Q. Sun and B.-Q. Xu, Catal. Sci. Technol., 2013, 3, 2062–2071 RSC.
- C. Liu, J. Shi, C. Gao and C. Niu, Appl. Catal., A, 2016, 522, 54–69 CrossRef CAS.
- R. Zhang, N. Liu, Z. Lei and B. Chen, Chem. Rev., 2016, 116, 3658–3721 CrossRef CAS PubMed.
- J. Wang, H. Zhao, G. Haller and Y. Li, Appl. Catal., B, 2017, 202, 346–354 CrossRef CAS.
- W. Shan and H. Song, Catal. Sci. Technol., 2015, 5, 4280–4288 RSC.
- Z. Liu, J. Li and S. I. Woo, Energy Environ. Sci., 2012, 5, 8799–8814 RSC.
- F. Liu, W. Shan, D. Pan, T. Li and H. He, Chin. J. Catal., 2014, 35, 1438–1445 CrossRef CAS.
- A. M. Beale, F. Gao, I. Lezcano-Gonzalez, C. H. F. Peden and J. Szanyi, Chem. Soc. Rev., 2015, 44, 7371–7405 RSC.
- X. Hu, L. Huang, J. Zhang, H. Li, K. Zha, L. Shi and D. Zhang, J. Mater. Chem. A, 2018, 6, 2952–2963 RSC.
- K. Zha, L. Kang, C. Feng, L. Han, H. Li, T. Yan, P. Maitarad, L. Shi and D. Zhang, Environ. Sci.: Nano, 2018, 5, 1408–1419 RSC.
- K. Zha, S. Cai, H. Hu, H. Li, T. Yan, L. Shi and D. Zhang, J. Phys. Chem. C, 2017, 121, 25243–25254 CrossRef CAS.
- C. Li, X. Tang, H. Yi, L. Wang, X. Cui, C. Chu, J. Li, R. Zhang and Q. Yu, Appl. Surf. Sci., 2018, 428, 924–932 CrossRef CAS.
- Z. Fan, J. Shi, C. Gao, G. Gao, B. Wang and C. Niu, ACS Appl. Mater. Interfaces, 2017, 9, 16117–16127 CrossRef CAS PubMed.
- L. Yan, Y. Liu, K. Zha, H. Li, L. Shi and D. Zhang, ACS Appl. Mater. Interfaces, 2017, 9, 2581–2593 CrossRef CAS PubMed.
- P. G. Smirniotis, D. A. Pena and B. S. Uphade, Angew. Chem., Int. Ed., 2001, 40, 2479–2482 CrossRef CAS PubMed.
- P. G. Smirniotis, P. M. Sreekanth, D. A. Peña and R. G. Jenkins, Ind. Eng. Chem. Res., 2006, 45, 6436–6443 CrossRef CAS.
- Y. J. Kim, H. J. Kwon, I. Nam, J. W. Choung, J. K. Kil, H. Kim, M. Cha and G. K. Yeo, Catal. Today, 2010, 151, 244–250 CrossRef CAS.
- J. Li, J. Chen, R. Ke, C. Luo and J. Hao, Catal. Commun., 2007, 8, 1896–1900 CrossRef CAS.
- P. R. Ettireddy, N. Ettireddy, S. Mamedov, P. Boolchand and P. G. Smirniotis, Appl. Catal., B, 2007, 76, 123–134 CrossRef CAS.
- S. Yang, F. Qi, S. Xiong, H. Dang, Y. Liao, P. K. Wong and J. Li, Appl. Catal., B, 2016, 181, 570–580 CrossRef CAS.
- B. Xu, J. Wei, Y. Yu, J. Li and Q. Zhu, Top. Catal., 2003, 22, 77–85 CrossRef CAS.
- B. Xu, J. Wei, Y. Yu, Y. Li, J. Li and Q. Zhu, J. Phys. Chem. B, 2003, 107, 5203–5207 CrossRef CAS.
- Q. Zhang, Y. Li and B. Xu, Catal. Today, 2004, 98, 601–605 CrossRef CAS.
- M. M. Pakulska, C. M. Grgicak and J. B. Giorgi, Appl. Catal., A, 2007, 332, 124–129 CrossRef CAS.
- M. Murdoch, G. I. N. Waterhouse, M. A. Nadeem, J. B. Metson, M. A. Keane, R. F. Howe, J. Llorca and H. Idriss, Nat. Chem., 2011, 3, 489–492 CrossRef CAS PubMed.
- I. I. Soykal, H. Sohn and U. S. Ozkan, ACS Catal., 2012, 2, 2335–2348 CrossRef CAS.
- Z. Hu, S. Tan, R. Mi, X. Li, D. Li and B. Yang, Catal. Lett., 2018, 148, 1490–1498 CrossRef CAS.
- J. Li, H. Chang, L. Ma, J. Hao and R. T. Yang, Catal. Today, 2011, 175, 147–156 CrossRef CAS.
- M. Koebel, G. Madia and M. Elsener, Catal. Today, 2002, 73, 239–247 CrossRef CAS.
- M. Devadas, O. Krocher, M. Elsener, A. Wokaun, N. Soger, M. Pfeifer, Y. Demel and L. Mussmann, Appl. Catal., B, 2006, 67, 187–196 CrossRef CAS.
- E. F. Massoth, Adv. Catal., 1978, 2, 265–310 Search PubMed.
- G. C. Bond and S. F. Tahir, Appl. Catal., 1991, 71, 1–31 CrossRef CAS.
- J. M. Gallardo-Amores, T. Armaroli, G. Ramis, E. Finocchio and G. Busca, Appl. Catal., B, 1999, 22, 249–259 CrossRef CAS.
- E. Park, S. Chin, J. Jeong and J. Jurng, Microporous Mesoporous Mater., 2012, 163, 96–101 CrossRef CAS.
- R. Guo, Q. Wang, W. Pan, W. Zhen, Q. Chen, H. Ding, N. Yang and C. Lu, Appl. Surf. Sci., 2014, 317, 111–116 CrossRef CAS.
- S. S. R. Putluru, L. Schill, A. D. Jensen, B. Siret, F. Tabaries and R. Fehrmann, Appl. Catal., B, 2015, 165, 628–635 CrossRef CAS.
- W. Li, R. Guo, S. Wang, W. Pan, Q. Chen, M. Li, P. Sun and S. Liu, Fuel Process. Technol., 2016, 154, 235–242 CrossRef CAS.
- B. Thirupathi and P. G. Smirniotis, J. Catal., 2012, 288, 74–83 CrossRef CAS.
- S. M. Lee, K. H. Park, S. S. Kim, D. W. Kwon and S. C. Hong, J. Air Waste Manage. Assoc., 2012, 62, 1085–1092 CrossRef CAS.
- J. Luo, Q. Zhang, J. Garcia-Martinez and S. L. Suib, J. Am. Chem. Soc., 2008, 130, 3198–3207 CrossRef CAS PubMed.
- T. Seiyama, Catal. Rev., 1992, 34, 281–300 CrossRef CAS.
- M. Dhakad, S. S. Rayalu, R. Kumar, P. Doggali, S. Bakardjieva, J. Subrt, T. Mitsuhashi, H. Haneda and N. Labhsetwar, Catal. Lett., 2008, 121, 137–143 CrossRef CAS.
- S. Cimino, L. Lisi and M. Tortorelli, Chem. Eng. J., 2016, 283, 223–230 CrossRef CAS.
- Z. Wu, R. Jin, H. Wang and Y. Liu, Catal. Commun., 2009, 10, 935–939 CrossRef CAS.
- P. Sun, R. Guo, S. Liu, S. Wang, W. Pan and M. Li, Appl. Catal., A, 2017, 531, 129–138 CrossRef CAS.
- H. Hu, K. Zha, H. Li, L. Shi and D. Zhang, Appl. Surf. Sci., 2016, 387, 921–928 CrossRef CAS.
- B. Jiang, Z. Li and S. Lee, Chem. Eng. J., 2013, 225, 52–58 CrossRef CAS.
- S. Wang, R. Guo, W. Pan, Q. Chen, P. Sun, M. Li and S. Liu, Catal. Commun., 2017, 89, 143–147 CrossRef CAS.
- L. Ma, Y. Cheng, G. Cavataio, R. W. McCabe, L. Fu and J. Li, Appl. Catal., B, 2014, 156–157, 428–437 CrossRef CAS.
- Z. Wu, B. Jiang, Y. Liu, H. Wang and R. Jin, Environ. Sci. Technol., 2007, 41, 5812–5817 CrossRef CAS PubMed.
- L. Wei, S. Cui, H. Guo and L. Zhang, Comput. Mater. Sci., 2018, 144, 216–222 CrossRef CAS.
- M. Devadas, O. Kröcher, M. Elsener, A. Wokaun, G. Mitrikas, N. Söger, M. Pfeifer, Y. Demel and L. Mussmann, Catal. Today, 2007, 119, 137–144 CrossRef CAS.
- F. Liu and H. He, J. Phys. Chem. C, 2010, 114, 16929–16936 CrossRef CAS.
- L. Wei, S. Cui, H. Guo, X. Ma and L. Zhang, J. Mol. Catal. A: Chem., 2016, 421, 102–108 CrossRef CAS.
- E. Tronconi, I. Nova, C. Ciardelli, D. Chatterjee and M. Weibel, J. Catal., 2007, 245, 1–10 CrossRef CAS.
- H. Hu, S. Cai, H. Li, L. Huang, L. Shi and D. Zhang, ACS Catal., 2015, 5, 6069–6077 CrossRef CAS.
- H. I. Konstantin, Catal. Rev., 2000, 42, 71–144 CrossRef.
Footnote |
| † Electronic supplementary information (ESI) available. See DOI: 10.1039/c8ra10077b |
| This journal is © The Royal Society of Chemistry 2019 |


