 Open Access Article
Synthesis and characterization of MgAl-DBS LDH/PLA composite by sonication-assisted masterbatch (SAM) melt mixing method
Roger Quispe-Dominguez ,
Sajid Naseem
 *,
Andreas Leuteritz and
Ines Kuehnert
Leibniz-Institut für Polymerforschung Dresden e.V., Dresden, Germany. E-mail: naseem@ipfdd.de
First published on 2nd January 2019
Abstract
This research work is based on the comparison of the mixing phenomena of magnesium–aluminum (MgAl) layered double hydroxides (LDHs) intercalated by dodecylbenzene sulfonate (MgAl-DBS) in poly(lactic acid) (PLA). Two mixing techniques were used to compare the dispersion of LDHs in PLA such as sonication-assisted masterbatch (SAM) melt mixing and direct melting (DM) methods. MgAl LDHs synthesized by the urea hydrolysis method and intercalated with DBS anions using anion exchange reaction and were used in different ratios in PLA (1.25, 2.5, and 5 wt%). MgAl LDHs and their anion intercalation were studied by the X-ray diffraction analysis (XRD) method. Different properties of LDH/PLA composites were compared to analyze the effect of these mixing techniques. Dispersion and exfoliation of LDHs in PLA were investigated by X-ray diffraction analysis (XRD) and transmission electron microscopy (TEM). Influences on the rheological properties were evaluated by analyzing the complex viscosities (η*), storage modulus (G′) and loss modulus (G′′) by using a rheometer. The thermal properties, thermal stability and effect on crystallinity of composites made with the two mixing techniques were analyzed by thermogravimetric analysis (TGA) and differential scanning calorimetry (DSC) respectively. The mixing mechanism and amount of MgAl-DBS LDHs have a notable effect on the properties of PLA composites with sonication-assisted masterbatch melt mixing techniques giving better dispersion of LDHs in PLA composites as compared to direct melt mixing.
Introduction
PLA is a biopolymer available on the market in different grades that has a good strength and rigidity comparable with other conventional polymers. The addition of fillers in the PLA matrix has been investigated for several years and PLA allows obtaining composites with desirable properties for specific applications.1,2 Different fillers such as silica,3 carbon nanotubes,4 montmorillonite5 and layered double hydroxides (LDHs)6–8 have been used previously to prepare PLA composites. The addition of different LDHs in the PLA matrix has received attention in recent years because of their various properties such as optical, mechanical, thermal, flame retardant and barrier effects.9,10 PLA has widespread applications from biomedical applications to flame retardant properties but with these useful applications it has certain limitations of its high brittleness and low thermal stability which can be improved by using different fillers such as layered double hydroxides (LDHs).11,13 Layered double hydroxides (LDHs) are anionic clays with the formula of [M1−x2+Mx3+(OH)2]x+·[(An−)x/n·yH2O]x, where M2+, M3+ and An− are divalent metal cations, trivalent metal cations and interlayer anions respectively.14,15 Research on these materials has been enhanced from many years due to their range of applications and tunable properties. The major applications of LDHs include their use as antioxidants,16 stabilizers17 flame retardants for polymers,18 photo-catalytic materials,19 and as UV-Vis absorption materials.20 Options to intercalate different organic anions into the layers of LDHs also make them useful for multifunctional applications.21–24 There are lots of techniques available to synthesize LDHs, the most common being the co-precipitation, urea hydrolysis, ion exchange and hydrothermal synthesis.15,25 LDHs can be prepared with different metal combinations that can be tailored to the desired applications and can have different structural, chemical and photoelectric properties depending on the incorporated metals and preparation methods.26–28Dispersion of LDHs in polymers is a crucial factor on which the properties and performance of resulting polymer composite are depending a lot. In most of the cases of LDHs/polymer composites, LDHs is modified with organic anions to enhance the interaction between LDHs and polymer. The nature of polymers are hydrophobic while of LDHs are hydrophilic, different nature of both make them immiscible during composite preparation. Intercalation of LDHs with organic anions can enhance the miscibility of LDHs in polymers and resulting in enhancement of different properties of composites.29 In case of PLA composites, agglomeration of LDHs particles occurred due to inherent hydrophilic characteristic of LDHs and hydrophobic characteristics of PLA. This leads to the use of different mixing techniques and methods that can provide a good dispersion of LDHs in PLA matrix. There are different techniques available for processing of PLA.30 Among the commonly used techniques for preparing composites are direct melt mixing using micro extruder,7,11 solvent casting method, sonication mixing29,31,32 and in situ polymerization method.6,33
The issue of miscibility of LDHs and polymers has long been studied from different researchers. Melt mixing is one of the common techniques to synthesize the LDHs/polymer composites and drying of LDHs is necessary before melt mixing machine to avoid the aggregation of LDHs which causes the poor dispersion in polymers.34 Previously researchers tried different method or combination of methods to improve the miscibility of LDHs/PLA composites. Zhang et al. (2008) prepared and compared properties of ZnAl/ethylene-vinyl acetate copolymer (EVA) composite by solution mixing and melt mixing method. Better exfoliation and intercalated morphology is obtained in case of solvent intercalation method.35 Káfuňková et al. (2010) prepared porphyrin-LDHs/poly(butylene succinate) (PBS) and polyurethane (PU) by solvent mixing and melt mixing method.36 Matusinovic et al. (2012) prepared and compared CaAl-benzoate/polystyrene (PS) nanocomposites; they used in situ bulk polymerization and melt mixing method. Noticeable improvements were observed in case of in situ bulk polymerization method as compared to melt mixing method. The dispersion of CaAl-benzoate is more in situ bulk polymerization as compared to melt mixing method.37 Wang et al. (2012) used simple cost effective method to synthesize LDHs/polymer composites using solvent mixing method. They used unmodified MgAl LDHs in PP using xylene as solvent and well dispersed LDHs/PP composites were obtained.34 Wang et al. (2013) used aqueous miscible organic solvent treatment (AMOST) method to synthesize highly dispersed LDHs/PP composites. ZnAl-borate and MgAl-borate were used in PP up to 30 wt% loadings. ZnAl-borate showed better properties as compared to MgAl-borate in PP on same loading level. Poor dispersion and high aggregation of LDHs was observed in case of melt mixing technique.38 Yongqin Han et al. (2017) studied the flame retardancy of polystyrene nanocomposites with different LDHs (MgAl, CoAl, NiAl and ZnAl) prepared by melt mixing method.39 Jing Leng et al. (2017) studied the structure property relationship of MgAl/polylactide and NiAl/polylactide.11 Longchao Du et al. (2006) studied structural, thermal and mechanical properties of poly(propylene carbonate)/MgAl LDH nanocomposites prepared by solution intercalation method.40
Study of filler–filler, polymer–filler interaction is important to analyze the properties of polymer composites. Increase in filler–filler interaction as compared to polymer–filler interaction causes a lower dispersion of filler in composites resulting decrease in desired properties.11,41 Dispersion of LDHs is good in polymer using solution mixing method as compared melt mixing method. On the other hand the industrial value of melt mixing method makes it really useful on industrial scale composite preparation. Taking the benefits of both methods we used the combination of both to develop a new technique to improve in dispersion of LDHs in PLA. Major step in sonication assisted masterbatch (SAM) melt mixing method is to synthesize the masterbatch by sonication assistance using solvents for LDHs and PLA. Synthesized masterbatch then further used in PLA using a conventional melt mixing machine. In this research work different concentrations of organically modified MgAl-LDHs with DBS were used to prepare the LDHs/PLA composites. Dealing with different concentration and making more homogenously dispersed LDHs/PLA composites these two different mixing techniques were compared and analyzed by different characterization techniques.
Materials and methods
Materials
Poly(lactic acid) (PLA) (Ingeo biopolymer 3251D) were supplied by NatureWorks. Magnesium nitrate hexahydrate (Mg(NO3)2·6H2O) and aluminum nitrate nonahydrate (Al(NO3)3·9H2O) were purchased from ABCR Germany. Urea (CO(NH2)2), sodium dodecylbenzene sulfonate (SDBS) and nitric acid (65%) (HNO3) were purchased from Sigma-Aldrich. Methylene chloride (99.8%) obtained from ACROS Organics.Synthesis and organic modification of MgAl LDHs
The synthesis of LDHs were carried out using the urea hydrolysis method as mentioned by Costantino et al.42 The following molar ratios were used; [urea] = 1.750 moles per L; [Mg]/[Al] = 2![[thin space (1/6-em)]](https://www.rsc.org/images/entities/char_2009.gif) :
:![[thin space (1/6-em)]](https://www.rsc.org/images/entities/char_2009.gif) 1 and [urea]/([Mg] + [Al]) = 3.5, the reaction was carried out at a constant temperature of 100 °C for 72 hours with a continuous stirring. The modification of MgAl LDHs was carried out by simple one-pot anion exchange intercalation method.43 It consists mixing in flask 0.048 moles of MgAl-CO3 LDHs in 400 ml of deionized water at a temperature of 65 °C with a continuous stirring, simultaneously the solution of 3 ml of nitric acid in 15 ml of deionized water was added dropwise and this mixture was allowed to react for one hour. 15 g SDBS was dissolved separately in 200 ml of deionized water. After the addition of SDBS, it was allowed to react for another 3 hours; the heating was suppressed and left to stir for 12 hours. After the modification process the solution was filtered and then LDHs were washed with distilled water. The final product was dried in an oven at 80 °C for 24 hours.
1 and [urea]/([Mg] + [Al]) = 3.5, the reaction was carried out at a constant temperature of 100 °C for 72 hours with a continuous stirring. The modification of MgAl LDHs was carried out by simple one-pot anion exchange intercalation method.43 It consists mixing in flask 0.048 moles of MgAl-CO3 LDHs in 400 ml of deionized water at a temperature of 65 °C with a continuous stirring, simultaneously the solution of 3 ml of nitric acid in 15 ml of deionized water was added dropwise and this mixture was allowed to react for one hour. 15 g SDBS was dissolved separately in 200 ml of deionized water. After the addition of SDBS, it was allowed to react for another 3 hours; the heating was suppressed and left to stir for 12 hours. After the modification process the solution was filtered and then LDHs were washed with distilled water. The final product was dried in an oven at 80 °C for 24 hours.
Preparation of LDHs/PLA composites
Masterbatch was prepared by two different methods such as by sonication assisted masterbatch (SAM) melt mixing method and direct melt mixing method. The PLA/MgAl-DBS LDHs composites and their ratios are shown in Table 1 where PLASAM-1.25LDH means composites prepared by sonication assisted masterbatch (SAM) melt mixing method with PLA and 1.25 weight% MgAl-DBS LDHs. In Table 1 PLADM-1.25LDH means composites prepared by direct melt (DM) mixing method with PLA and 1.25 weight% MgAl-DBS LDHs. Firstly the masterbatch was prepared in both methods and then this masterbatch was diluted in PLA using the co-rotating twin screw micro compounder (Micro-compounder 15 cm3, DSM Xplore, Geleen, The Netherlands) at 170 °C with screw speed of 200 rpm for 10 min. In both methods of masterbatch preparation (DM and SAM), 50% of PLA and 50% of MgAl-DBS LDHs were used. The major different between both methods is masterbatch preparation. In sonication assisted masterbatch (SAM) melt mixing method, masterbatch was synthesized by sonication assistance using methylene chloride for LDHs and PLA. The solution kept at room temperature under magnetic stirring for 1 hour. Finally the solvent was evaporated at 80 °C for next 12 hours. Synthesized masterbatch then further used in PLA using a co-rotating twin screw micro compounder. In direct melt mixing (DM) masterbatch was prepared by direct mixing in the co-rotating twin screw micro compounder at 170 °C with screw speed of 200 rpm for 10 min. PLA and LDHs were dried before use in an oven at 80 °C for 12 hours in order to remove moisture and to avoid possible aggregation of LDHs.| Samples | Composition | LDHs (wt%) | 2θ (°) | d(003) (nm) | |
|---|---|---|---|---|---|
| — | PLA | 100%PLA | — | — | — |
| SAM melt mixing | PLASAM-1.25LDH | 95%PLA-5%MB | 1.25 | 2.75 | 3.21 |
| PLASAM-2.5LDH | 90%PLA-10%MB | 2.50 | 2.70 | 3.27 | |
| PLASAM-5.0LDH | 80%PLA-20%MB | 5.00 | 2.70 | 3.27 | |
| Direct melting (DM) | PLADM-1.25LDH | 95%PLA-5%MB | 1.25 | 2.90 | 3.05 |
| PLADM-2.5LDH | 90%PLA-10%MB | 2.50 | 2.90 | 3.05 | |
| PLADM-5.0LDH | 80%PLA-20%MB | 5.00 | 2.85 | 3.10 | |
Characterization
X-ray diffraction analysis was carried out in the range 2θ = 0–65°, every 0.02° by using the P4 X-ray diffractometer (BRUKER axs Karlsruhe) with Cu Kα radiation (λ = 0.154 nm) generated at 30 mA and 40 kV. The d-spacing were calculated by using Bragg's law. The dispersion and exfoliation of the LDHs in the PLA matrix were investigated by using transmission electron microscopy (TEM). Ultrafine sections were prepared from the samples under cryogenic conditions for TEM studies. An ultramicrotome with cryoprobe UC7/FC7 (Leica Microsystems, Wetzlar, Germany) was used for this purpose. TEM investigations were carried out in a Libra 200 (Carl Zeiss Microscopy GmbH, Oberkochen, Germany). Differential scanning calorimetry (DSC) analysis was done by using DSC Q2000 of TA-Instruments. Samples of 10 mg were subjected two heating cycles and all the sweeps were carried out at a speed of 10°C min−1 under nitrogen atmosphere. Glass transition temperature (Tg), cold crystallization temperature (Tcc), melting temperature (Tm), cold crystallization enthalpy (ΔHcc) and fusion enthalpy (ΔHm) were determined. The crystallinity (xc) and cold crystallization (xcc) of extruded samples were calculated by using equation as mentioned previously. Where ΔH0m is the enthalpy of fusion of a sample completely crystalline PLA obtained in the laboratory (ΔH0m = 93 J g−1), and CLDH is the concentration by weight of nanoparticles given in percentage.11,12 Thermogravimetric analysis (TGA) was performed with a heating rate of 10 °C min−1 using a TGA Q5000 from TA instruments in an inert nitrogen atmosphere in the temperature range of 25–700 °C. The rheological analysis was carried out using an ARES rheometer (Rheometrics Scientific, USA). With torque transducers in a measuring range from 0.02 to 2000 g cm and parallel plate geometry with a diameter of 25 mm and a thickness of 2 mm. The measurement was performed by frequency sweep test using 1% strain. The composites of PLA and MgAl-DBS LDHs were investigated under the condition of temperature 170 °C and a rotation frequency ranging from 0.03 to 100 rad s−1.Results and discussion
XRD analysis of LDHs
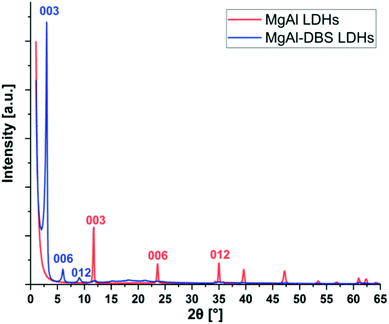
The X-ray diffraction patterns are shown in Fig. 1. Typical reflection peaks of LDHs are present and these correspond to MgAl LDHs and MgAl-DBS LDHs. The structure of LDHs are made by isomorphic substitution of cations Mg2+ by Al3+ as a result an excess of positive charge is generated in the inorganic sheets which is balanced by carbonate anions CO32− located in the interlayer spacing. These intermediate regions between the layers also contain water molecules bound to the inorganic layers by hydrogen bonds.44,45 The diffraction peaks (003), (006) and (009) can be easily recognized in MgAl LDHs and MgAl-DBS LDHs in Fig. 1. Well defined crystalline and well-ordered structure can be recognized from the graph. Based on the position of the strongest peaks corresponding to the crystallographic indices (003) the d-spacing calculated are 0.75 nm in case of MgAl LDHs and 2.95 nm for MgAl-DBS LDHs. The d-spacing for MgAl LDHs reported in the literature is almost similar to this value which ranges between 0.65 and 0.80 nm.46,47 The d-spacing of the modified sample is markedly greater than MgAl LDHs as can be seen in graph showing the successful intercalation of DBS in the MgAl LDHs.Morphological analysis
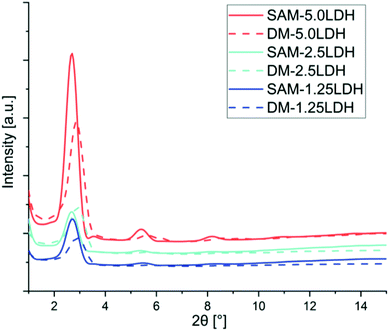
Morphological characterization of the LDHs/PLA composite is necessary to understand the general state of the dispersion of LDHs in PLA. On the other hand TEM images can provide useful information in a localized area on the morphology, structure and spatial distribution of dispersed phase of the composites. XRD and TEM techniques are considered complementary to each other for morphological characterization.48,49The solid lines shown in the diffractogram of Fig. 2 is representing the composites manufactured by SAM melt mixing method with different concentrations of LDHs and the dotted lines to those obtained by direct melting (DM). From these curves by applying Bragg's law, it is possible to determine the d-spacing shown in Table 1. Fig. 2 and Table 1 are showing that the diffraction peaks move to regions of smaller angle (2θ), indicating that through SAM melt mixing method is slightly improved intercalation and exfoliation of LDHs compared with those obtained by DM.
 | ||
| Fig. 2 X-ray diffraction of LDHs/PLA composites prepared by SAM and DM methods with different concentration of LDHs. | ||
PLADM-5.0LDH has d-spacing of 3.10 nm and the PLASAM-5.0LDH has a slightly larger d-spacing (3.27 nm). This is presumably due to the intercalation of some PLA chains within the LDHs though a high degree of exfoliation is difficult to obtain.50 Some PLA chains can enter into the galleries of LDHs and increasing the layers distances as can be seen in XRD graphs. Also from TEM images better dispersion and intercalation can be observed in case of SAM melt mixing method. A schematic diagram of exfoliation is also shown with TEM images. Fig. 3 shows the TEM images at 50 nm when making a comparison between the composites manufactured by SAM and DM. Better distribution, intercalation and exfoliation is observed when it is processed by SAM for all the LDHs concentrations evaluated in this investigation. The anionic modification of LDHs with DBS reduces the attractive forces between the adjacent sheets and allows reaching greater degrees of exfoliation when obtaining the composite.43 However, the TEM images shown in Fig. 3 and the schematic representation shown in Fig. 4, suggest that the morphology of composites is complex and difficult to get complete exfoliated system. These images show a coexistence of exfoliated, intercalated and tactoids structures. Several sheets are intercalated and exfoliated, but agglomerates of different dimensions are also still observed. Proposed schematic representation is shown how the SAM and DM techniques causing the mixing and which one is supporting the good dispersion of LDHs in PLA. SAM method providing a better mixing as compared to DM method as can be seen in TEM images. On the other hand as the amount of LDHs increased the possibility of agglomeration of LDHs are more which hinders the mixing and dispersion of LDHs in PLA.51
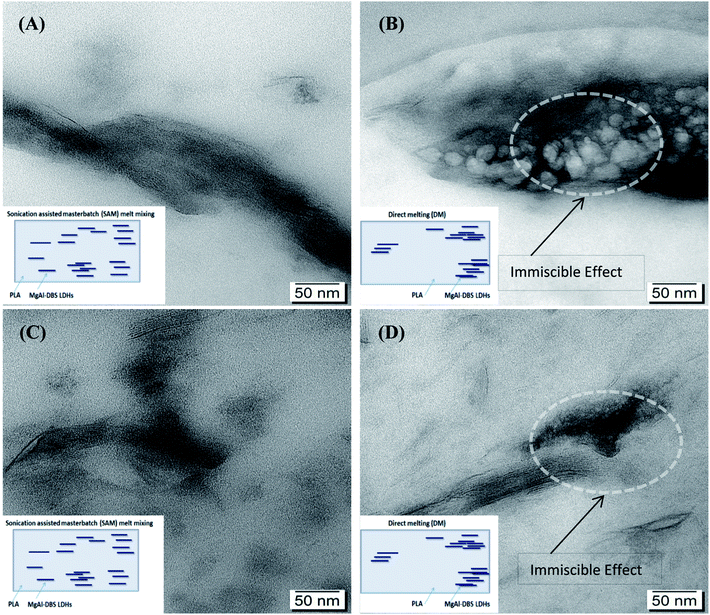 | ||
| Fig. 3 TEM images of composites: (A) PLASAM-1.25LDH, (B) PLADM-1.25LDH, (C) PLASAM-5.0LDH (D) PLADM-5.0LDH. | ||
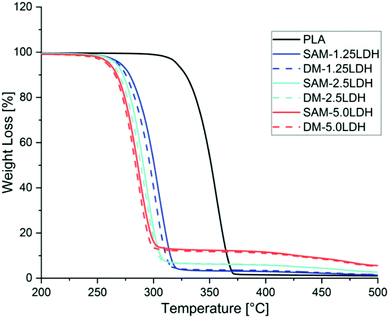 | ||
| Fig. 4 TGA of PLA and LDHs/PLA composites prepared with SAM and DM method for different concentrations of LDHs. | ||
Thermal characterization by TGA
Thermal stability of different LDHs/PLA composites was studied by TGA. In all the cases thermal stability reduced as the amount of LDHs increased in PLA as can be seen in Fig. 4. In all the cases it can be seen that there is similar trend of thermal stability curves. On the other hand it can be seen in Fig. 4 that LDHs/PLA composites made by SAM melt mixing method showing a better thermal stability as compared to composites prepared by direct melting (DM) method. MgAl-DBS LDHs showing catalyzing effect in PLA and causing degradation and reducing the thermal stability of PLA as can be seen in Fig. 4. As the amount of LDHs increasing the difference between SAM and DM technique is reducing as can be seen in Fig. 4, it is because the mixing of LDHs is reaching to maximum limit in PLA. In comparison with SAM and DM techniques the SAM is better in terms of thermal stability as with the addition of 1.25%, 2.5%, and 5% in PLA. The presence of metal ion such as Mg, Fe, Zn and Sn could lead to decrease in thermal stability of PLA. As the amount of Mg and Al ion increases the catalyzing effect increasing in PLA and causes the reduction in thermal stability. These reduction of thermal stability is also observed previously by Chiang et al. (2010).52 Chiang et al. (2010) studied how MgAl LDHs and MgAl-SDBS LDHs effecting the thermal properties of PLA.52 Mahboobeh Eili et al. (2012) also studied this behavior of decrease in thermal stability of PLA by stearate-Zn3Al LDH nano layers.53Weight loss is reduced as the amount of LDHs increased as can be seen in Fig. 5. The weight loss is less in case of SAM as the LDHs particles are not agglomerated as in case of DM. Also the thermal stability is better in case of SAM method as compared to DM method as can be seen in Fig. 5. The intercalation and dispersion is better in case of SAM and supporting the less decrease in thermal degradation. The PLA chains intercalated in the LDHs in case of SAM and providing better stability than less dispersed and agglomerated system.
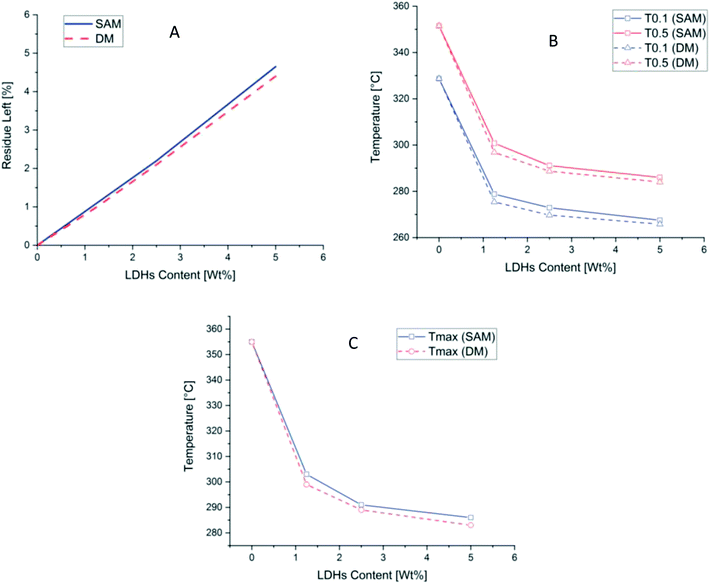 | ||
| Fig. 5 (A) Residue left after final temperature (B) T0.1 and T0.5 (C) Tmax at different concentration of PLA and LDH/PLA composites prepared with SAM and DM methods. | ||
Thermal stability can be studied by two temperatures, T0.5 at which 50% weight loss occurred and T0.1 at which 10% weight loss occurred.54 As can be seen in Fig. 5 and in Table 2 these two temperatures. Also the Tmax temperature at which maximum weight loss occurred is reduced as the amount of LDHs increased in both cases of DM and SAM. While in cases of SAM method the decrease in Tmax is better than in DM method. The residue left is more in all cases of SAM method which is showing a better thermal stability than DM method as can be seen in Table 2.
| Samples | T0.1 (°C) | T0.5 (°C) | Tmax (°C) | Mass residual at 800 °C (%) |
|---|---|---|---|---|
| a T0.1 = temperate at which 10% weight loss of sample occurred in TGA analysis. T0.5 = temperate at which 50% weight loss of sample occurred in TGA analysis. Tmax = temperate at which maximum weight loss of sample occurred in TGA analysis. | ||||
| PLA | 328.7 | 351.5 | 355 | 0 |
| PLASAM-1.25LDH | 278.8 | 300.8 | 303 | 1.10 |
| PLADM-1.25LDH | 275.4 | 296.8 | 299 | 1.00 |
| PLASAM-2.5LDH | 272.9 | 291.1 | 291 | 2.20 |
| PLADM-2.5LDH | 269.7 | 288.7 | 289 | 2.10 |
| PLASAM-5.0LDH | 267.5 | 286.0 | 286 | 4.65 |
| PLADM-5.0LDH | 265.8 | 284.0 | 283 | 4.40 |
Crystallization behaviour study by DSC
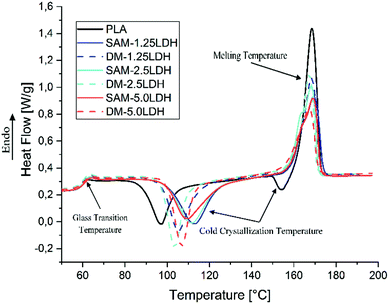
Fig. 6 shows the DSC thermograms corresponding to the second heating of extruded samples of pure PLA and the composites of LDHs/PLA obtained by SAM and DM methods. The thermal parameters obtained from the DSC analysis are summarized in Table 3. The Tg of samples are almost the same, varies between 58.8 °C and 60 °C, there is a slight increase due to the incorporation of LDHs in the PLA.55,56 During the second heating, the exothermic peaks attributed to the cold crystallization process indicate that the melt crystallization process during the previous cooling step was incomplete. In Fig. 6 it is observed that immediately after the characteristic endothermic peak corresponding to the Tg, the DSC trace shows several exothermic peaks corresponding to the Tcc. The Tcc of PLA showed an increase from 97.3 °C to 113.2 °C (in case of SAM) and 105.6 °C (in case of DM) for the PLA with 1.25% by weight of LDHs. The endothermic melting peaks did not show a noticeable difference between PLA and LDHs/PLA in terms of the maximum melting temperature peaks, which on average is 168 °C. However, it is observed that the intensity of the peaks decreases with the increase of the LDHs content.| Sample | Tg (°C) | Tcc (°C) | Tm (°C) | ΔHcc (J g−1) | ΔHm (J g−1) | xcc (%) | xc (%) |
|---|---|---|---|---|---|---|---|
| a Tg = glass transition temperature. Tcc = cold crystallization temperature. Tm = melting temperature. ΔHcc = enthalpy of cold crystallization. ΔHm = enthalpy of fusion. xcc = degree of cold crystallization. xc = degree of crystallization. | |||||||
| PLA | 58.8 | 97.3 | 168.6 | −27.8 | 44.8 | 29.89 | 48.17 |
| PLASAM-1.25LDH | 60.0 | 113.2 | 169.4 | −34.9 | 37.0 | 37.06 | 39.29 |
| PLADM-1.25LDH | 59.4 | 105.6 | 168.4 | −32.8 | 36.1 | 34.83 | 38.33 |
| PLASAM-2.5LDH | 58.8 | 111.6 | 168.2 | −34.8 | 37.1 | 36.48 | 38.90 |
| PLADM-2.5LDH | 59.1 | 103.6 | 167.4 | −32.3 | 34.3 | 33.86 | 35.96 |
| PLASAM-5.0LDH | 60.0 | 109.8 | 169.2 | −31.9 | 34.2 | 32.59 | 34.94 |
| PLADM-5.0LDH | 59.7 | 106.9 | 167.4 | −29.6 | 30.8 | 30.24 | 31.46 |
Fig. 6 shows the crystallinity as a function of the concentration of LDHs. In general it is observed that the degree of crystallinity decreases with the increase of LDHs content. Furthermore, as can be observed in Fig. 7, at low concentrations of LDHs, the composites obtained by SAM have a slightly higher degree of crystallinity than those obtained by DM. However, at higher concentrations this difference becomes even more prominent. Leng et al. (2015) also reported that the crystallinity of the PLA/MgAl-DBS LDHs composites decreases for concentrations greater than 1% by weight.11 Recent research suggests that the dispersion of nanoparticles, the inability of polymer chains to fully incorporate into the growing crystal lamella, influences the kinetics of crystallization of composites.13,57,58
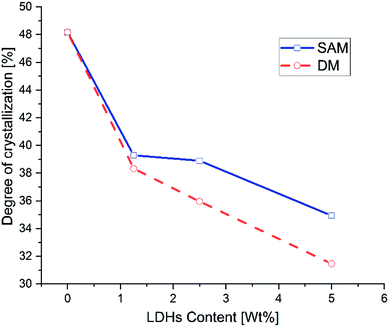 | ||
| Fig. 7 Degree of crystallization of LDHs/PLA composites prepared with SAM and DM methods at different concentrations of LDHs. | ||
Rheological characterization
The rheological behavior of polymeric composite is governed by its microstructure, which in turn is determined by the various interactions present within the system, such as the polymer–polymer, polymer–filler and filler–filler interactions.59 Fig. 8 shows the complex viscosities (η*) of pure PLA and the composites obtained by DM and SAM methods. The viscosities increase when LDHs content increases; however this increase in viscosity is more pronounced in the case of the composites prepared by DM than SAM, because in DM method LDHs dispersion is low as compared to SAM method. Also, it can be observed that the effect of LDHs is more pronounced at low frequencies and this effect decreases as the frequency increases due to the strong shear tinning effect. Similar results were reported by Zhang et al.60 and Costa et al.61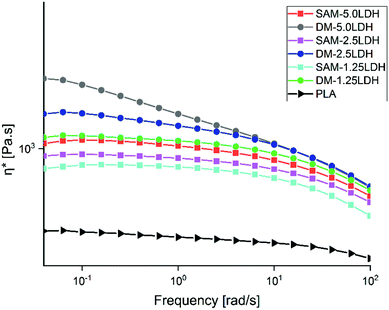 | ||
| Fig. 8 Complex viscosities (η*) of PLA and LDHs/PLA composites prepared with SAM and DM methods at different concentrations of LDHs. | ||
The polymers have viscoelastic characteristic. The storage modulus (G′) denotes the elasticity or stiffness, it has typical behavior of a solid material and is associated with the energy stored in the material. The loss modulus (G′′) denotes the viscosity, and it represents a liquid behavior similar to the polymer in liquid state and is related to the dissipation of energy.41 Fig. 9(A) and (B) show that the G′ and G′′ of PLA and the LDHs/PLA composites have a similar tendency. It is also observed that the values of G′ and G′′ are higher for LDHs/PLA composites than for pure PLA. Also, it is observed that the magnitudes of G′ and G′′ increase monotonically with the content of LDHs at low frequencies. Moreover, the modulus G′ and G′′ are larger for composites manufactured by DM than for those manufactured by SAM method because the increase in filler–filler interaction which also causes a lower dispersion. As the frequency increases the G′ and G′′ also increase and become less dependent on the frequency and content of LDHs.
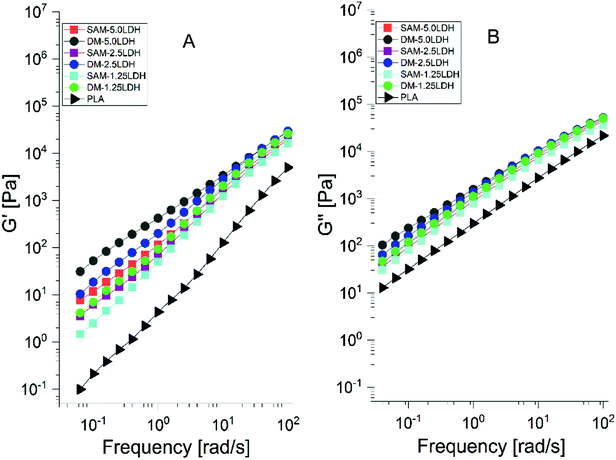 | ||
| Fig. 9 (A) Storage modulus (G′) and (B) loss modulus (G′′) of PLA and LDHs/PLA composites papered with SAM and DM method at different concentrations of LDHs. | ||
It can be said that the η*, G′ and G′′ are affected by the addition of LDHs, method of processing (SAM and DM) and the change in frequency. At lower value of LDHs content the viscosity changes due to the polymer-filler interaction. With the additional increase of LDHs, the viscosity increases which leads to the formation of polymer–nanofiller networks. Therefore the transition of the system is carried out from a behavior of a material of liquid to solid type, which results due to the polymer–filler and filler–filler interaction. The increase in the storage modulus is due to the intercalation of the LDHs. At a higher frequency, both moduli become less dependent on the filler.41,62
Conclusion
Sonication assisted masterbatch (SAM) melt mixing methods for the preparation of LDHs/PLA has sown the better dispersion and less agglomeration as compared to direct melt mixing (DM) method. Better PLA–LDHs interaction can be achieved through using SAM method as compared to DM method which is giving more filler–filler interaction. The viscosities increase when the LDHs content increases but increase in viscosity is more pronounced in the case of composites prepared by DM than SAM because of less disperse LDHs particles in PLA. The degree of crystallinity decreases with the increase of LDHs content as the filler–filler interaction starts increasing in all the cases of LDHs/PLA composites. SAM melt mixing method will provide an alternative for direct melt mixing method with better dispersion of LDHs in polymers. Advantages of solution mixing and melt mixing method are combined together and it gives relatively new approach to synthesize different polymer composites system. Higher ratios of LDHs in different polymer system can also be tried to have the better dispersion which cannot be achieved through conventional melt mixing methods.Conflicts of interest
There are no conflicts to declare.Acknowledgements
We acknowledge the Leibniz Institute of Polymer Research Dresden (IPF) Germany for providing the facilities to do this research.References
- D. Garlotta, J. Polym. Environ., 2001, 9, 63–84 CrossRef CAS.
- L. Yu, K. Dean and L. Li, Prog. Polym. Sci., 2006, 31, 576–602 CrossRef CAS.
- P. Klonos, Z. Terzopoulou, S. Koutsoumpis, S. Zidropoulos, S. Kripotou, G. Z. Papageorgiou, D. N. Bikiaris, A. Kyritsis and P. Pissis, Eur. Polym. J., 2016, 82, 16–34 CrossRef CAS.
- H.-S. Xu, X. J. Dai, P. R. Lamb and Z.-M. Li, J. Polym. Sci., Part B: Polym. Phys., 2009, 47, 2341–2352 CrossRef CAS.
- P. M. S. Souza, A. R. Morales, M. A. Marin-Morales and L. H. I. Mei, J. Polym. Environ., 2013, 21, 738–759 CrossRef.
- V. Katiyar, N. Gerds, C. B. Koch, J. Risbo, H. C. B. Hansen and D. Plackett, Polym. Degrad. Stab., 2010, 95, 2563–2573 CrossRef CAS.
- D. Y. Wang, A. Leuteritz, Y. Z. Wang, U. Wagenknecht and G. Heinrich, Polym. Degrad. Stab., 2010, 95, 2474–2480 CrossRef CAS.
- N. Zhao, S. Shi, G. Lu and M. Wei, J. Phys. Chem. Solids, 2008, 69, 1564–1568 CrossRef CAS.
- Z. D. Demirkaya, B. Sengul, M. S. Eroglu and N. Dilsiz, J. Polym. Res., 2015, 22(7), 1–13 CAS.
- P. Ding, B. Kang, J. Zhang, J. Yang, N. Song, S. Tang and L. Shi, J. Colloid Interface Sci., 2015, 440, 46–52 CrossRef CAS PubMed.
- J. Leng, N. Kang, D.-y. Wang, J. Falkenhagen, A. F. Thünemann and A. Schönhals, Macromol. Chem. Phys., 2017, 1700232, 1–12 Search PubMed.
- J. Leng, P. J. Purohit, N. Kang, D.-Y. Wang, J. Falkenhagen, F. Emmerling, A. F. Thünemann and A. Schönhals, Eur. Polym. J., 2015, 68, 338–354 CrossRef CAS.
- J. Leng, N. Kang, D. Y. Wang, A. Wurm, C. Schick and A. Schönhals, Polymer, 2017, 108, 257–264 CrossRef CAS.
- Y. Kuang, L. Zhao, S. Zhang, F. Zhang, M. Dong and S. Xu, Materials, 2010, 3, 5220–5235 CrossRef CAS PubMed.
- In Modern Inorganic Synthetic Chemistry, ed. R. Xu and Y. Xu, Elsevier, Amsterdam, 2nd edn, 2017, pp. 493–543, DOI:10.1016/B978-0-444-63591-4.00018-5.
- S. P. Lonkar, A. Leuteritz and G. Heinrich, RSC Adv., 2013, 3, 1495–1501 RSC.
- S. Naseem, S. P. Lonkar, A. Leuteritz and F. J. W. J. Labuschagné, RSC Adv., 2018, 8, 29789–29796 RSC.
- Y. Gao, J. Wu, Q. Wang, C. A. Wilkie and D. O'Hare, J. Mater. Chem. A, 2014, 2, 10996–11016 RSC.
- S.-J. Xia, F.-X. Liu, Z.-M. Ni, W. Shi, J.-L. Xue and P.-P. Qian, Appl. Catal., B, 2014, 144, 570–579 CrossRef CAS.
- J. Jiménez Reinosa, P. Leret, C. M. Álvarez-Docio, A. del Campo and J. F. Fernández, Bol. Soc. Esp. Ceram. Vidrio, 2016, 55, 55–62 CrossRef.
- F. L. Theiss, G. A. Ayoko and R. L. Frost, Appl. Surf. Sci., 2016, 383, 200–213 CrossRef CAS.
- S. B. Tyagi, A. Kharkwal, Nitu, M. Kharkwal and R. Sharma, Solid State Sci., 2017, 63, 93–102 CrossRef CAS.
- D. Basu, A. Das, D.-Y. Wang, J. J. George, K. W. Stockelhuber, R. Boldt, A. Leuteritz and G. Heinrich, RSC Adv., 2016, 6, 26425–26436 RSC.
- B. Nagendra, C. V. S. Rosely, A. Leuteritz, U. Reuter and E. B. Gowd, ACS Omega, 2017, 2, 20–31 CrossRef CAS.
- J. He, M. Wei, B. Li, Y. Kang, D. G. Evans and X. Duan, in Layered Double Hydroxides, ed. X. Duan and D. G. Evans, Springer Berlin Heidelberg, Berlin, Heidelberg, 2006, pp. 89–119, DOI:10.1007/430_006.
- D.-K. Cho, C.-W. Jeon and I.-K. Park, J. Alloys Compd., 2018, 737, 725–730 CrossRef CAS.
- J. J. Bravo-Suárez, E. A. Páez-Mozo and S. T. Oyama, Quim. Nova, 2004, 27, 601–614 Search PubMed.
- C. Forano, U. Costantino, V. Prévot and C. T. Gueho, in Developments in Clay Science, ed. F. Bergaya and G. Lagaly, Elsevier, 2013, vol. 5, pp. 745–782 Search PubMed.
- B. Nagendra, K. Mohan and E. Bhoje Gowd, ACS Appl. Mater. Interfaces, 2015, 7, 12399–12410 CrossRef CAS PubMed.
- I. Kuehnert, Y. Spörer, H. Brünig, N. H. A. Tran and N. Rudolph, Processing of Poly(lactic acid), 2017 Search PubMed.
- M.-F. Chiang and T.-M. Wu, Compos. Sci. Technol., 2010, 70, 110–115 CrossRef CAS.
- K. Das, D. Ray, I. Banerjee, N. R. Bandyopadhyay, S. Sengupta, A. K. Mohanty and M. Misra, J. Appl. Polym. Sci., 2010, 118, 143–151 CrossRef CAS.
- C. Taviot-Guého and F. Leroux, ed. X. Duan and D. G. Evans, In situ polymerization and intercalation of polymers in layered double hydroxides, Springer, 2005, vol. 119, pp. 121–159 Search PubMed.
- Q. Wang, X. Zhang, J. Zhu, Z. Guo and D. O'Hare, Chem. Commun., 2012, 48, 7450–7452 RSC.
- M. Zhang, P. Ding, L. Du and B. Qu, Mater. Chem. Phys., 2008, 109, 206–211 CrossRef CAS.
- E. Káfuňková, K. Lang, P. Kubát, M. Klementová, J. Mosinger, M. Šlouf, A.-L. Troutier-Thuilliez, F. Leroux, V. Verney and C. Taviot-Guého, J. Mater. Chem., 2010, 20, 9423–9432 RSC.
- Z. Matusinovic, H. Lu and C. A. Wilkie, Polym. Degrad. Stab., 2012, 97, 1563–1568 CrossRef CAS.
- Q. Wang, J. P. Undrell, Y. Gao, G. Cai, J.-C. Buffet, C. A. Wilkie and D. O'Hare, Macromolecules, 2013, 46, 6145–6150 CrossRef CAS.
- Y. Han, Y. Wu, M. Shen, T. Li, Y. Wang, Q. Zhang and Z. Wang, Polym. Compos., 2017, 38, 1680–1688 CrossRef CAS.
- L. Du, B. Qu, Y. Meng and Q. Zhu, Compos. Sci. Technol., 2006, 66, 913–918 CrossRef CAS.
- M. Kumar, V. Chaudhary, K. Suresh and G. Pugazhenthi, RSC Adv., 2015, 5, 39810–39820 RSC.
- U. Costantino, F. Marmottini, M. Nocchetti and R. Vivani, Eur. J. Inorg. Chem., 1998, 1998, 1439–1446 CrossRef.
- B. Kutlu, A. Leuteritz, R. Boldt, D. Jehnichen and G. Heinrich, Chem. Eng. J., 2014, 243, 394–404 CrossRef CAS.
- C. Coluccini, I. Sporer, A. Leuteritz, I. Kuehnert and D. Wang, Nanomater. Energy, 2014, 3, 177–191 CrossRef.
- N. Chubar, V. Gerda, O. Megantari, M. Mičušík, M. Omastova, K. Heister, P. Man and J. Fraissard, Chem. Eng. J., 2013, 234, 284–299 CrossRef CAS.
- F. R. Costa, A. Leuteritz, U. Wagenknecht, D. Jehnichen, L. Häußler and G. Heinrich, Appl. Clay Sci., 2008, 38, 153–164 CrossRef CAS.
- M. J. Dos Reis, F. Silvério, J. Tronto and J. B. Valim, J. Phys. Chem. Solids, 2004, 65, 487–492 CrossRef.
- S. C. Tjong, Mater. Sci. Eng., R, 2006, 53, 73–197 CrossRef.
- F. Costa, M. Saphiannikova, U. Wagenknecht and G. Heinrich, Layered Double Hydroxide Based Polymer Nanocomposites, Springer, 2007, vol. 210, pp. 101–168, DOI:10.1007/12_2007_123.
- D. R. Paul and L. M. Robeson, Polymer, 2008, 49, 3187–3204 CrossRef CAS.
- B. Alexandre, D. Langevin, P. Médéric, T. Aubry, H. Couderc, Q. T. Nguyen, A. Saiter and S. Marais, J. Membr. Sci., 2009, 328, 186–204 CrossRef CAS.
- M. F. Chiang, M. Z. Chu and T. M. Wu, Polym. Degrad. Stab., 2011, 96, 60–66 CrossRef CAS.
- M. Eili, K. Shameli, N. A. Ibrahim and W. M. Z. Wan Yunus, Int. J. Mol. Sci., 2012, 13, 7938–7951 CrossRef CAS PubMed.
- F. R. Costa, U. Wagenknecht and G. Heinrich, Polym. Degrad. Stab., 2007, 92, 1813–1823 CrossRef CAS.
- A. Abdulkhani, J. Hosseinzadeh, A. Ashori, S. Dadashi and Z. Takzare, Polym. Test., 2014, 35, 73–79 CrossRef CAS.
- I. Kelnar, J. Kratochvíl, I. Fortelný, L. Kaprálková, A. Zhigunov, M. Nevoralová, M. Kotrisová and V. Khunová, RSC Adv., 2016, 6, 30755–30762 RSC.
- T. Wu, Y. Tong, F. Qiu, D. Yuan, G. zhen Zhang and J. ping Qu, Polym. Adv. Technol., 2017, 1–11 Search PubMed.
- D. Wu, L. Wu, L. Wu, B. Xu, Y. Zhang and M. Zhang, J. Polym. Sci., Part B: Polym. Phys., 2007, 45, 1100–1113 CrossRef CAS.
- S. Kashi, R. K. Gupta, T. Baum, N. Kao and S. N. Bhattacharya, Composites, Part B, 2018, 135, 25–34 CrossRef CAS.
- Q. Zhang, S. Rastogi, D. Chen, D. Lippits and P. J. Lemstra, Carbon, 2006, 44, 778–785 CrossRef CAS.
- F. R. Costa, U. Wagenknecht, D. Jehnichen, M. A. Goad and G. Heinrich, Polymer, 2006, 47, 1649–1660 CrossRef CAS.
- P. Pötschke, T. D. Fornes and D. R. Paul, Polymer, 2002, 43, 3247–3255 CrossRef.
| This journal is © The Royal Society of Chemistry 2019 |

