 Open Access Article
Experiment and simulation on Zr2Fe bed for tritium capturing†
Song Jiangfeng ab,
Wang Jingchuan*b,
Jiang Feib,
Li Peilongb,
Zhu Zhenghea and
Meng Daqiaoab
aInstitute of Atomic and Molecular Physics, Sichuan University, Chengdu 610065, China
bInstitute of Materials, Chinese Academy of Engineering Physics, Jiangyou 621908, Mianyang, China. E-mail: iterchina@163.com
First published on 11th January 2019
Abstract
Zr based alloys are widely used in hydrogen storage and purification systems. For hydrogen isotope capturing and recycling, it is possible to design the tritium extraction system of the glove box taking into account the operating conditions and technical constraints. Zr2Fe alloy bed was adopted in the 2.5%H2/Ar capturing experiments as well as numerical simulation was also constructed. In this work, the breakthrough curve under conditions of 300 °C@200 sccm for the carrier gas penetration was obtained by establishing a single flowing bed. Then a new numerical model of the bed was established for simulating the penetration process, and a numerical solution to the mass conservation equation of carrier gas passing through the bed was obtained concerning the actual experimental parameters. Calculation results have shown the two-dimensional distribution of H2 concentration flowing through a one-dimensional reactor. It can be seen clearly that the H2 concentration distributed along the bed axial at different time. This distribution profiles can be used to globally illuminate the concentration variation of hydrogen in the reactor within the whole reaction time scale. Comparing the experimental result of 1.27 days in the breakthrough curve, the results of numerical simulation can predict the curve of about 1.5 days began to breakthrough, although there were certain deviation (∼18%). The results can provide a feasible numerical model support for optimizing the tritium capturing bed design.
1. Introduction
Zr based alloys are widely used in hydrogen storage and purification systems.1–5 A glove box with a tritium extraction system is an important safety containment system for tritium processing system in fusion reactor tritium factories. The flow bed filled with Zr2Fe alloy powders has a satisfying ability for hydrogen capture from an inert gas carrier situation, and its absorption efficiency is sufficiently high to fulfill the tritium recovery material requirements.6–8 According to different engineering requirements such as in the International Thermonuclear Experimental Reactor (ITER) and China Fusion Engineering Test Reactor (CFETR), it is necessary to design different parameters for the tritium capturing flow bed to meet certain operation and lifetime requirements. Generally, it is common practice to do a shrinkage ratio model test prior to the amplified reactor for meeting the actual technical requirements. Without numerous tests, this method cannot adapt to different working situations, complicated and changeable parameters, especially for the lifetime estimation of the engineered bed. Establishing a numerical model can speed up and optimize the reactor design.9 Therefore, this work utilized Zr2Fe flow bed to study the capture of hydrogen isotopes from inert gas carrier by both experiment and numerical simulation, in order to optimize the tritium capturing process at the given conditions.2. Experimental
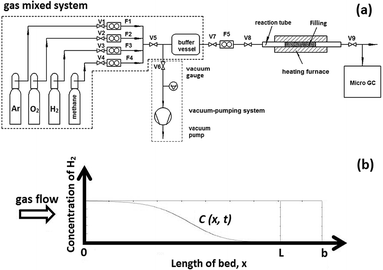
Zr2Fe alloy powders were purchased from GRINM Beijing. The particle size distribution is among from 100 to 200 mesh. Hydrogen breakthrough curves were measured in a setup (Fig. 1a) mainly consisting of a vacuum-pumping system, gas-mixing system, reactor with φ14 stainless steel tube in the furnace and micro chromatography with a 1 ppm resolution (Micro GC, Inficon 3000). Before measuring, all pipelines were purged by carrier gas and the reactor tube was preheated for removing contamination. The measurement processes can be described as: (i) Zr2Fe alloy powders and fillers were filled into the reactor tube; (ii) pumping down the whole system except gas-mixing system into a ∼5 Pa vacuum level; (iii) activating Zr2Fe powders at 500 °C for 2 hours in the vacuum state then cooling down to the setpoint temperature; (iv) shutting up the pump system, then filling the reactor with required mixing gas by the gas-mixing system and meanwhile using the Micro GC to analyze the H2 concentration in the exhaust gas. | ||
| Fig. 1 (a) Hydrogen penetration measurement setup of Zr2Fe reactor, (b) numerical simulation model for Zr2Fe bed. | ||
For the hydriding kinetic measurements were taken in a SETARAM PCT-Pro equipment. A sample of 1.5 g Zr2Fe powder used in the flow reactor was taken to measure the hydriding kinetics at the required temperature. Before measuring, an activation process was also employed, which was consistent with penetration reaction condition (Table 1).
| Symbol | Numerical value | Parameter |
|---|---|---|
| C | The concentration of hydrogen in carrier gas (mol m−3) | |
| ρ | 6900 | Packing density of Zr2Fe in the bed (kg m−3) |
| β | 2.5% | Hydrogen concentration in the carrier gas |
| x | The length of reaction bed (m) | |
| u | 0.02 | The areal velocity (m s−1) |
| Dax | 1.63 × 10⁻⁴ | The axial dispersion coefficient of constituent in carrier gas (m2 s−1) |
| ε | 0.5 | The porosity of fixed bed |
| ϕ | 0.014 | The diameter of the reaction bed cross section (m) |
![[small gamma, Greek, vector]](https://www.rsc.org/images/entities/i_char_e1c3.gif) |
The reaction kinetics at cross section unit facing the gas flow | |
| Dm | 2.23 × 10⁻⁴ | Molecular diffusion coefficient (m2 s−1@573 K) |
| dp | 1.5 × 10⁻⁴ | The average diameter of Zr2Fe particle (m) |
| ξ | The reacted fraction of hydriding in the hydrogen absorption kinetics fitting parameters of Zr2Fe9,13  |
3. Numerical simulations
According to the law of mass conservation and the hydrodynamics, the carrier gas penetration in a porous column can be represented by a plug flow model including axial dispersion as shown in Fig. 1b. A carrier gas with 2.5% H2 in Ar was flowed into the reactor tube, then the concentration distribution C(x,t) was calculated in the reactor. The mass balance equation in fluid phase for hydrogen concentration can be expressed as eqn (1).
 | (1) |
With boundary conditions: in the section of (0,b)
Initial condition:
| t = 0, C(x,0) = 0 |
Estimation of parameters
(i) Reaction rate ![[small gamma, Greek, vector]](https://www.rsc.org/images/entities/i_char_e1c3.gif)
Former kinetics reports9–13 have used the grain scale reaction kinetics to estimate the particle scale reaction kinetics. However, it seems too simplified for practical engineering applications due to the idealized assumptions. This work used practical measured kinetics of Zr2Fe powders to represent the reaction rate in the flow bed reactor. According to the plug flow model, the reaction rate of sectional area in the reactor can be expressed as eqn (2).
 | (2) |
(ii) Axial dispersion coefficient Dax
Considering the Zr2Fe particle size and flow speed of carrier gas, the axial dispersion coefficient can be represented eqn (3) as followed by Edwards et. al.13
 | (3) |
4. Results and discussion
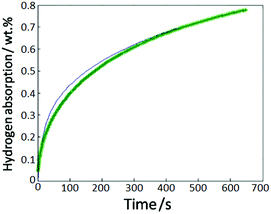
The hydriding kinetic measurements were taken for deriving the reaction rate![[small gamma, Greek, vector]](https://www.rsc.org/images/entities/i_char_e1c3.gif) used in the numerical simulation. The Zr2Fe powder of 1.5 g was used to measure the hydrogen absorption properties in SETARAM PCT-Pro setup under 300 °C and 1 bar conditions. A formula suitable for alloy powder ξH2 = 1 − (1 − 1/2√(t/t0.875))3 was used to fit our isothermal hydrogen absorption curve.9–12 The fitting result was generally acceptable with a deviation R2 = 0.989 as shown in Fig. 2. In addition, the reaction rate
used in the numerical simulation. The Zr2Fe powder of 1.5 g was used to measure the hydrogen absorption properties in SETARAM PCT-Pro setup under 300 °C and 1 bar conditions. A formula suitable for alloy powder ξH2 = 1 − (1 − 1/2√(t/t0.875))3 was used to fit our isothermal hydrogen absorption curve.9–12 The fitting result was generally acceptable with a deviation R2 = 0.989 as shown in Fig. 2. In addition, the reaction rate ![[small gamma, Greek, vector]](https://www.rsc.org/images/entities/i_char_e1c3.gif) can be derived from eqn (2).
can be derived from eqn (2).
 | ||
| Fig. 2 Hydrogen absorption properties of Zr2Fe particles, the blue line is measurement results and green star line is simulation results. | ||
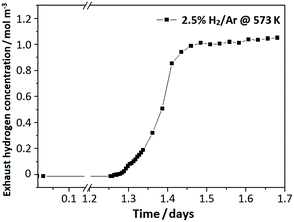
For the hydrogen breakthrough curve measurement, an 8 cm length bed was filled with Zr2Fe powder into the tube reactor. A 200 sccm mixture gas of 2.5% H2/Ar was supplied into the reactor controlled by an accurate gas-mixing system. The hydrogen breakthrough curve is shown in Fig. 3, which indicates that hydrogen began to penetrate the bed at 1.25 days and then its concentration rises rapidly to the feed mixture gas concentration of 1.12 mol m−3, meaning breakthrough completely.
A numerical model was built up to simulate the hydrogen penetration process in the flow bed reactor. A program was coded to solve the mass conservation equation in this flow bed model. All the parameters used in the simulation were adopted from the practical experimental process, as well as the boundary and initial conditions. The simulation results are demonstrated in the Fig. 4. A 2D concentration profile concerning the axial and time coordinates is shown in the Fig. 4a, which can generally illuminate the concentration variation of hydrogen in the reactor within the whole reaction time scale. Furthermore, the concentration profile along the reactor axial at different time could be easily derived from the model as seen in the Fig. 4b. By using this, it can be used to discover what happened to the concentration profile in the reactor when the hydrogen was about to penetrate, as well as in the post-penetration process. Fig. 4c is the simulation result for the hydrogen breakthrough curve in the practical experiment. It shows that the breakthrough point was about 1.5 days, which has a diversion of ∼18% compared with the measuring result of 1.27 days. This can be attributed to the simplified assumption for the powder size of 150 μm, but in fact, it has a broad distribution of 100–200 mesh.
5. Conclusions
Incorporating the numerical simulation with experimental methods on the hydrogen penetration behavior through the Zr2Fe flow bed, this work established a new model that can globally illuminated the concentration variation of hydrogen in the reactor within the whole reaction time scale. The results could be beneficial to improving the design of tritium capture bed as follows:(1) This model can predict an acceptable hydrogen breakthrough happening for the tritium capturing bed;
(2) The reaction rate ![[small gamma, Greek, vector]](https://www.rsc.org/images/entities/i_char_e1c3.gif) used in the numerical model is derived directly from hydriding kinetics experiment, rather than the calculation from grain scale kinetics. This methods including the powder size dispersion effect will be more suitable to the practical engineering.
used in the numerical model is derived directly from hydriding kinetics experiment, rather than the calculation from grain scale kinetics. This methods including the powder size dispersion effect will be more suitable to the practical engineering.
Conflicts of interest
There are no conflicts to declare.Acknowledgements
Project supported by National Magnetic Confinement Fusion Science Program (Grant No. 2017YFE0301502, 2013GB108002 and 2014GB112005).Notes and references
- Y. Yang, X. Song and C. Zhang, Int. J. Hydrogen Energy, 2016, 47, 22206–22213 CrossRef.
- Z. Cao, L. Ouyang and H. Wang, Int. J. Hydrogen Energy, 2016, 41, 11242–11253 CrossRef CAS.
- D. Conić, A. Gradišek and J. Radaković, et al., Int. J. Hydrogen Energy, 2015, 40, 5677–5682 CrossRef.
- A. Dagher, H. G. Salem and T. M. Moustafa, et al., Int. J. Hydrogen Energy, 2014, 39, 17740–17746 CrossRef CAS.
- L. Mihailov, T. Spassov and M. Bojinov, Int. J. Hydrogen Energy, 2012, 37, 10499–10506 CrossRef CAS.
- Z. Y. Huang, C. X. Liu and J. F. Song, et al., Chem. Eng. J., 2010, 38(10), 205 CAS.
- S. Fukada, Y. Toyoshima and M. Nishikawa, Fusion Eng. Des., 2000, 49, 805–809 CrossRef.
- S. Fukada, K. Tokunaga and M. Nishikawa, Fusion Eng. Des., 1997, 36(4), 471–478 CrossRef CAS.
- K. C. Chou, Q. Li, Q. Lin, L. J. Jiang and K. D. Xu, Int. J. Hydrogen Energy, 2005, 30, 301–309 CrossRef CAS.
- M. F. Edwards and J. F. Richardson, Chem. Eng. Sci., 1968, 23, 109–123 CrossRef CAS.
- J. M. P. Q. Delgado, Heat Mass Transfer, 2006, 42, 279–331 CrossRef CAS.
- K. Ligera, X. Lefebvrea, A. Ciampichettib, A. Aiello and I. Ricapito, Fusion Eng. Des., 2011, 86, 1859–1862 CrossRef.
- M. F. Edwards and J. F. Richardson, Chem. Eng. Sci., 1968, 23, 109–l23 CrossRef CAS.
Footnote |
| † Electronic supplementary information (ESI) available. See DOI: 10.1039/c8ra08784a |
| This journal is © The Royal Society of Chemistry 2019 |


