 Open Access Article
Bacteria-supported iron scraps for the removal of nitrate from low carbon-to-nitrogen ratio wastewater†
Xiawei Liuab,
Jian Xuab,
Jiaolong Huangab,
Manqi Huangab,
Tao Wangab,
Shaopan Baoa,
Wei Tanga and
Tao Fang *ab
*ab
aInstitute of Hydrobiology, Chinese Academy of Sciences, 7 Donghu South Road, Wuchang District, Wuhan 430072, China. E-mail: fangt@ihb.ac.cn
bUniversity of Chinese Academy of Sciences, Beijing 100049, China
First published on 25th January 2019
Abstract
A novel bacteria-supported iron scraps (BSIS) system was developed for nitrate removal from low carbon-to-nitrogen ratio (C/N) wastewater. The system consisted of low-cost iron scraps and the accumulated denitrifying-related bacteria enriched from an Fe-wastewater environment when the system was operating. After operating for 39 d, the nitrate removal rate of the system increased to 73.55% within 24 h. The extraction of bacteria from the system revealed that iron scraps and bacteria had a synergistic effect on nitrate removal and bacteria only took effect when cooperating with iron. Microbial analysis using high-throughput sequencing showed that Hydrogenophaga, which is closely related to hydrogenotrophic denitrification, became the dominant genus in the system. The system provides a promising approach to the treatment of nitrate in low C/N wastewater and it has the potential for large-scale application due to the low cost, simple operation and relatively high removal rate.
1. Introduction
Nitrogen-containing compounds, resulting from the extensive use of fertilizers, immoderate industrial manufacture and household activities, are the main causes of eutrophication and pose a threat to both human and aquatic organisms. Nitrate can cause methemoglobinemia (blue-baby syndrome)1,2 and increase the risk of non-hodgkin's lymphoma and gastric cancer;3 it may also cause abortion in pregnant women, fetal malformation, coronary artery disease, ovarian cancer, hyperthyroidism, etc.4 Nitrate is a common pollutant in low C/N sewage such as polluted surface water, groundwater, effluent from sewage treatment plant and high nitrogen industrial wastewater.Traditional nitrate removal methods include biological denitrification,5–7 ion exchange,8,9 osmosis,10,11 electrodialysis,12,13 etc. The chemical and physical methods of ion exchange, osmosis and electrodialysis have their drawbacks such as high cost and energy consumption, which limit the larger scale application.4 By contrast, biological denitrification is ideal for practical application due to the high efficiency and relatively low cost, thus becoming the most widely used technology in nitrate treatment. However, traditional biological process such as heterotrophic denitrification, using organics as the source of carbon and energy, has difficulties in disposing nitrate in low C/N water. It's reported that low C/N (COD/TN < 3) leads to incomplete denitrification and a minimum C/N ratio of 3.5–4.5 is needed for denitrification while 6–11 can get satisfying removal of nitrate.14–16 Adding extra organic matters such as ethanol, methanol, sucrose, acetate and formate1 to enhance heterotrophic denitrification may result in secondary pollution and waste of resources.
As a promising alternative of heterotrophic denitrification, autotrophic denitrification, using inorganic compounds including hydrogen gas, ferrous iron and reduced sulfur compounds as electron donor, is increasingly being studied in recent years.17–23 Autotrophic denitrification especially hydrogen-based one (hydrogenotrophic denitrification) is desirable because of its nontoxicity and low biomass.24 During the hydrogenotrophic denitrification process, hydrogen is used by hydrogenotrophic denitrifying bacteria as electron donor, and inorganic carbon, such as carbon dioxide and bicarbonate, is used as carbon source. No extra organics are needed for the removal of nitrate. In addition, hydrogenotrophic denitrifying bacteria grow slowly and produce less biomass. Thus, the problem of bacterial clogging can be avoided. Nevertheless, providing the indispensable hydrogen directly to the reaction system25,26 has the risk of explosion during the storage and transportation. Producing hydrogen in situ by electrolyzing water often needs additional power supplies, which increases the operational cost.
To solve these problems, many researchers have turned the spotlight on the in situ production of hydrogen by anaerobic corrosion of metallic iron.17,25,27–29 Among various forms of metallic iron, nanoscale iron has received much attention because nanoscale zero-valent iron has a fast removal efficiency due to its large specific surface area.30–32 However, the relatively expensive cost hinders the large-scale application. Moreover, powder-like iron nanoparticles tend to block the hole when applying to the reaction tank. By contrast, iron scraps are costless to acquire because iron scraps produced in the factory are often considered as useless materials and the large size of iron scraps reduces the problem of holes blocking. However, few studies have focused on the iron scraps, and the application potential of iron scraps with denitrifying bacteria was neglected before. In our study, we used iron scraps as hydrogen supplier instead of nanoscale iron. Iron particles have been widely used in permeable reactive barrier to remove contaminants from contaminated groundwater in the United States. Some of iron barriers have operated successfully for more than 10 years, which further suggests that iron can be used in practical engineering.33,34
To enhance the hydrogenotrophic denitrification and integrate the iron-bacteria system, inoculations of specific bacteria were needed in previous studies. Bacteria from sub-superficial soil,35 iron(III)-reducing Geobacter sulfurreducens strain,36 Shewanella oneidensis MR-1,37 Alcaligenes eutrophus30 and Paracoccus denitrificans17 have been reported before to combine with iron for the nitrate removal. The removal efficiency and practicability of these systems need to be improved. Therefore, in the present study, we used target wastewater (low C/N wastewater from sewage treatment plant) to enrich microbial consortium in the reaction system directly instead of adding specific bacteria in order to lower the operating cost.
The low cost by recycling waste iron scraps and high efficiency combining the physicochemical and biological effects increase the feasibility for further massive use. Thus, nitrate removal from low C/N wastewater can be achieved without external carbon sources and electric power. It has been suggested that the add of carbon materials may form the galvanic cell and speed up the nitrate removal,27 so we also attempt to use cokes and iron scraps together.
The objectives of this research were to (1) assess the removal performance of the system, (2) analyze the effects of iron scraps, cokes and bacteria on the removal of nitrate, (3) characterize the microbial community in the system.
2. Materials and methods
2.1. Experimental setup and operation
Four systems were designed to test the removal efficiency: (a) 750 g iron scraps (Fe system); (b) 750 g iron scraps and 250 g cokes (FeC system); (c) 250 g cokes (C system); (d) control group (involved no iron scraps or cokes). All groups were performed in the 5 L beakers and 3 L wastewater was added. All the beakers were covered with sealed bags to make anoxic conditions. The dissolved oxygen was kept from 0.16 mg L−1 to 2.27 mg L−1 during the whole operation. During the process, the temperature ranged from 9.6 °C to 16.3 °C. All the experiments were performed in triplicate to reduce experimental errors.
The experimental operation was divided into three periods. The liquid in the system was only replaced by new wastewater at the beginning of every period. The first period and third period were set to test the removal performance of the system and ended with the complete removal of nitrate from the wastewater added at the beginning of the period, while the in-between second period, lasting for 20 days, was set to enhance biomass accumulation on the surface of reaction substrates. At the end of three periods, the nitrate concentration of wastewater was set at 10 mg L−1 NO3−-N to further test the nitrate removal performance. The pollution factors of original wastewater added at the beginning of three periods are listed in Table 1 and 10 mg L−1 NO3−-N wastewater used after the end of three periods was prepared by adding KNO3 into the original wastewater.
| Operation time | NO3−-N | NO2−-N | NH4+-N | CODCr | Permanganate index | pH | |
|---|---|---|---|---|---|---|---|
| First period | 17 | 4.52 | 0.05 | 5.16 | 25.09 | 5.61 | 7.50 |
| Second period | 20 | 2.83 | 0.06 | 5.51 | 24.60 | 4.95 | 7.45 |
| Third period | 2 | 3.87 | 0.17 | 3.46 | 22.12 | 4.11 | 7.23 |
To identify the effects of iron scraps, cokes and extractive bacteria on the removal of nitrate, we designed seven groups as follows: (A) 50 g iron scraps + 5 mL blank sterile solution (Fe only); (B) 50 g iron scraps + 5 mL seed culture (Fe bacteria); (C) 50 g iron scraps and 25 g cokes + 5 mL blank sterile solution (FeC only); (D) 50 g iron scraps and 25 g cokes + 5 mL seed culture (FeC bacteria); (E) 25 g cokes + 5 mL blank sterile solution (C only); (F) 25 g cokes + 5 mL seed culture (C bacteria); (G) 5 mL seed culture (bacteria only) (To avoid the possible influences of the addition of 5 mL seed culture, those sterile groups (A, C, E) were added 5 mL blank sterile solution). All groups were performed in the 250 mL Erlenmeyer flasks and 200 mL fresh stock solution was added. All the flasks were replenished nitrogen gas for 5 min and sealed to keep anoxic conditions. All the experiments were performed in triplicate to reduce experimental errors.
2.2. Analytical methods
Water samples were acquired at selected time intervals and filtered through 0.45 μm membrane filters for analysis. The concentrations of NO3−-N, NO2−-N, NH4+-N, CODCr and permanganate index were determined according to the standard methods (State Environmental Protection Administration, China). Dissolved Oxygen was measured by Dissolved Oxygen Meter (DO200, YSI, USA) and pH was measured by pH Meter (FE20, METTLER TOLEDO, Switzerland). All the chemicals used were analytical reagents.2.3. Microbial analysis
After finishing the operation of the system, the substrates of the Fe system, FeC system and C system were respectively put into 50 mL centrifuge tubes and 40 mL phosphate buffered saline (PBS, Hyclone, USA) was added. Through vigorous shaking, bacteria attached to the surface of substrates were transferred to PBS. The liquid was then separated and centrifuged at 6000 rpm to collect the bacteria precipitates. These samples were analyzed by high-throughput sequencing. Microbial DNA was extracted from samples using the Fast DNA®SPIN Kit for Soil (MP, USA). Primers 338F (5′-ACTCCTACGGGAGGCAGCAG-3′) and 806R (5′-GGACTACHVGGGTWTCTAAT-3′) were used for amplification by thermocycler PCR system (GeneAmp 9700, ABI, USA). Purified amplicons were sequenced on an Illumina MiSeq platform (Illumina, San Diego, USA) according to the standard protocols by Majorbio Bio-Pharm Technology Co., Ltd (Shanghai, China). The raw reads are accessible at the NCBI Sequence Read Archive (SRA) database (Accession Number: SRP155990). Operational taxonomic units (OTUs) were clustered with 97% similarity cutoff by UPARSE (version 7.1 http://drive5.com/uparse/).3. Results and discussion
3.1. Nitrate removal performance of the system
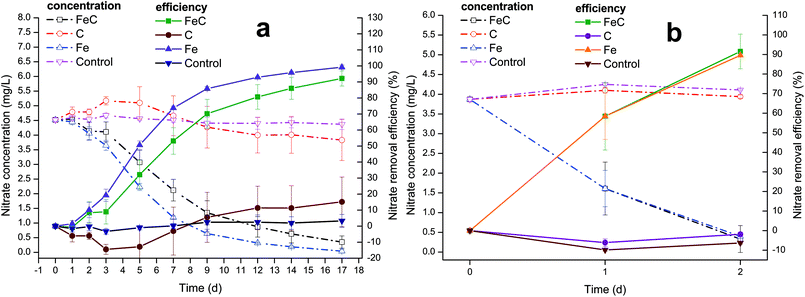
The characteristics of wastewater shown in Table 1 indicated that the C/N of wastewater was below 3 and thus it belonged to low C/N wastewater. The system continuously operated for about 39 days, with detailed operation time of three periods listed in Table 1 and nitrate removal performance shown in Fig. 1. Fig. 1(a) presents the variations of nitrate concentration and removal efficiency during the first period. In the first three days, nitrate removal rate was extremely low and showed no obvious trend of growth in FeC system. After that, the removal efficiency suddenly improved, increasing to 32.11% on Day 5, and the following 4 days had the similar growth trend with 53.18% on Day 7 and 70.18% on Day 9, which indicated that the relatively stable removal happened in FeC system. Then the increase of removal efficiency slowed down probably due to the low residual nitrate in the system. Besides, slower rate may result from the corrosion products of iron, which led to the reduction of reactive sites. The abiotic reaction rate has been reported to link with the reactive surface area of iron.38 The nitrate removal efficiency finally increased to approximately 80.65% on Day 12 and 92.19% on Day 17. Meanwhile, nitrate variation in Fe system had the similar trend as that in FeC system. In Initial three days, the nitrate removal rate gradually ascended at low speed. The rapid growth happened between Day 3 and Day 5 with 50.60% on Day 5. Then the growth of removal efficiency gradually became slow, arriving 85.81% removal efficiency on Day 9, 92.94% on Day 12 and 99.21% on Day 17. In the first period, it took almost 17 days to remove nitrate completely from wastewater in Fe system. The graph shows that the removal rate of Fe system was a little higher than that of FeC system during the first period, which meant coke may even impede the reaction in the first period probably because it could reduce the active sites by covering on the surface of iron. By contrast, C system and control group showed no distinct effects on the removal of nitrate. Nitrate may fluctuate a little during the operation, which led to the negative nitrate removal rate in C system during 0–5 d. The fluctuation probably resulted from the complicated components and microbial activities of wastewater. For instance, nitrogen-containing compounds including nitrate, ammonium and nitrite can convert to each other with specific microorganisms under certain conditions.23,51 However, no significant difference among nitrate concentrations in C system during 0–5 d was observed in our study (ANOVA: P > 0.05). Therefore, we suppose the fluctuation of nitrate was negligible.To enhance biomass accumulation on the surface of reaction substrates, the supernates of all the systems were replaced by new wastewater and 20 days standing was performed in the second period. Following the second period, great removal efficiency occurred in the third period. As shown in Fig. 1(b), both FeC system and Fe system witnessed large growth of rate. The average removal efficiency of nitrate in FeC system and Fe system on Day 1 was 58.45% and 58.42%, respectively. On Day 2, those achieved 91.55% and 89.56%, suggesting the successful establishment of the system. The careful comparison between the first period and third period revealed that the removal efficiency dramatically increased after the microbial enrichment in the second period. In the first period, Fe system and FeC system achieved about 80% removal efficiency taking 9 days and 12 days, respectively. However, both Fe system and FeC system took only 2 days to gain approximately 90% removal efficiency in the third period. In addition, the results led to the conclusion that iron scrap was the one that worked while coke didn't contribute to the removal of nitrate, which was consistent with the results in the first period.
The change of pH during the process was shown in Fig. S1.† In the first period, pH in all the systems ranged from 7.13 to 8.72 with slight increase, which was within the prescribed limit (6 to 9) of environmental quality standards of China for surface water. In the third period, pH increased from 7.23 to 8.83 in FeC system and to 8.54 in Fe system. It's evident that pH of Fe system and FeC system had more rapid growth than that of C system and control group because denitrification is a process in which the alkalinity is increasing as shown in eqn (3). Besides, iron corrosion also contributed to the increase of pH, which was also observed in previous study.17
At the end of operation, nitrate concentration was elevated to approximately 10 mg L−1 to examine the removal effects in higher nitrate concentration condition (Fig. 2). The results showed that nitrate removal efficiency increased to approximately 70% after 24 h (1 day) operation with 67.01% in FeC system and 73.55% in Fe system precisely.
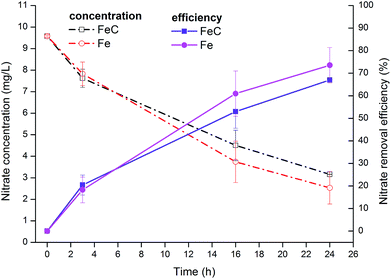 | ||
| Fig. 2 Variations of NO3−-N concentration and removal efficiency in FeC system and Fe system when initial NO3−-N concentration was set at 10 mg L−1. | ||
3.2. Influences of microorganisms
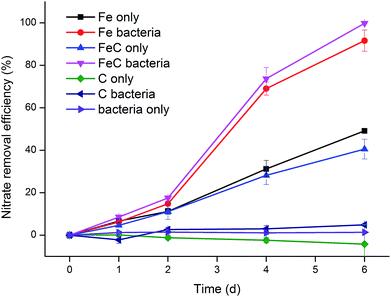
Seven groups were designed to investigate the effects of iron scraps, cokes and extractive bacteria on nitrate removal. Fe bacteria (or FeC bacteria) group included the physicochemical and biological effects while Fe only (or FeC only) group excluded the influences of microorganisms. Fig. 3 shows that Fe bacteria (or FeC bacteria) group had higher reaction rate than Fe only (or FeC only) group while C only, C bacteria and bacteria only groups didn't have removal ability. In initial two days, Fe bacteria (or FeC bacteria) and Fe only (or FeC only) shared the similar efficiency. However, efficiency greatly increased in Fe bacteria (or FeC bacteria) group between Day 2 and Day 4 from 14.83% to 69.04% and from 17.56% to 73.73%, respectively. Then on the following Day 6 the efficiency achieved 91.65% and 99.82%, indicating the completion of removal. Meanwhile, efficiency of Fe only (or FeC only) group revealed relatively slow and stable increase. After 6 days operation, the removal efficiency of these two groups only climbed to 49.13% and 40.54%, respectively. In this experiment, we further confirmed that coke didn't have the distinct capacity to degrade nitrate both alone and with iron scraps or bacteria. In particular, as shown in Fig. 3, the results indicated that bacteria only promoted removal when reacting with iron scraps. Furthermore, it turned out that the BSIS system could apply to the organic-free circumstance as no organics were added in this experiment. In conclusion, iron scraps and bacteria extracted from previous system had synergistic effect: removal rate of bacteria-supported iron scraps was greater than that of iron scraps and bacteria apart.3.3. Microbial community analysis
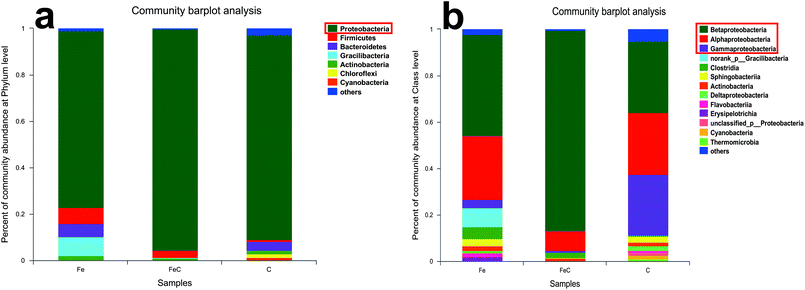
Samples of FeC system, Fe system and C system were collected at the end of the operation process and analyzed by high-throughput sequencing for further determination of the microbial community. Rarefaction curves were shown in Fig. S2.† As shown in Fig. 4(a), phylum Proteobacteria had the highest relative abundance in all the samples at phylum level with 75.97% in Fe system, 95.55% in FeC system and 88.23% in C system. It's reported that most of denitrifying bacteria belong to classes of α-proteobacteria, β-proteobacteria, and γ-proteobacteria.27 As shown in Fig. 4(b), β-proteobacteria was the dominant class in three samples. The relative abundance of β-proteobacteria in Fe system (43.58%) and in FeC system (86.38%) was higher than that in C system (30.67%). By contrast, relative abundance of γ-proteobacteria in C system (26.35%) was higher than that in Fe system (3.51%) and FeC system (0.73%).The community barplot analysis at genus level (Fig. 5(a)) shows that, Hydrogenophaga, which was dominant genus both in Fe system (26.87%) and FeC system (84.34%), had little percentage in C system with only 1.48%. In the heat map shown in Fig. 5(b), Fe system and FeC system were clustered together, which meant that the microbial communities of these two systems were similar and C system was different from two other systems. The sharp distinction of abundance of Hydrogenophaga between high-efficiency systems (Fe system and FeC system) and inefficient system (C system), and leading position of Hydrogenophaga in high-efficiency systems suggested that Hydrogenophaga closely linked with the nitrate removal. In addition, the abundance of Gemmobacter and Rhodobacter was also relatively high in Fe system and FeC system compared with C system. Meanwhile, the abundance of Pseudomonas, Thiobacillus, Nitrosomonas, Caulobacter and Bradyrhizobium in Fe system and FeC system was significantly less than that in C system.
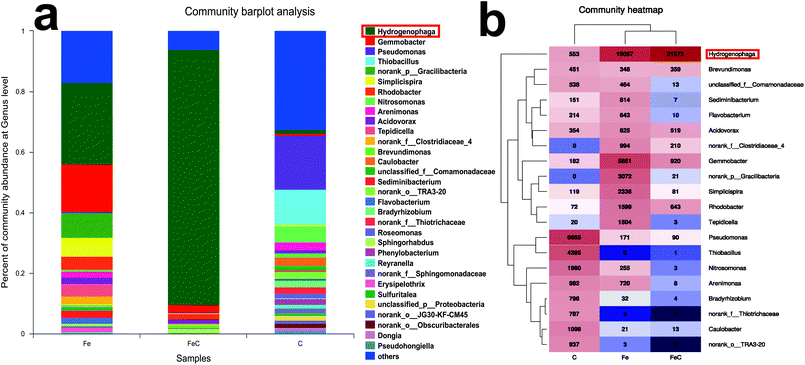 | ||
| Fig. 5 Microbial analysis at genus level in different systems (FeC, Fe and C). (a) Community abundance; (b) heat map of the community abundance (the most dominant 20 genera). | ||
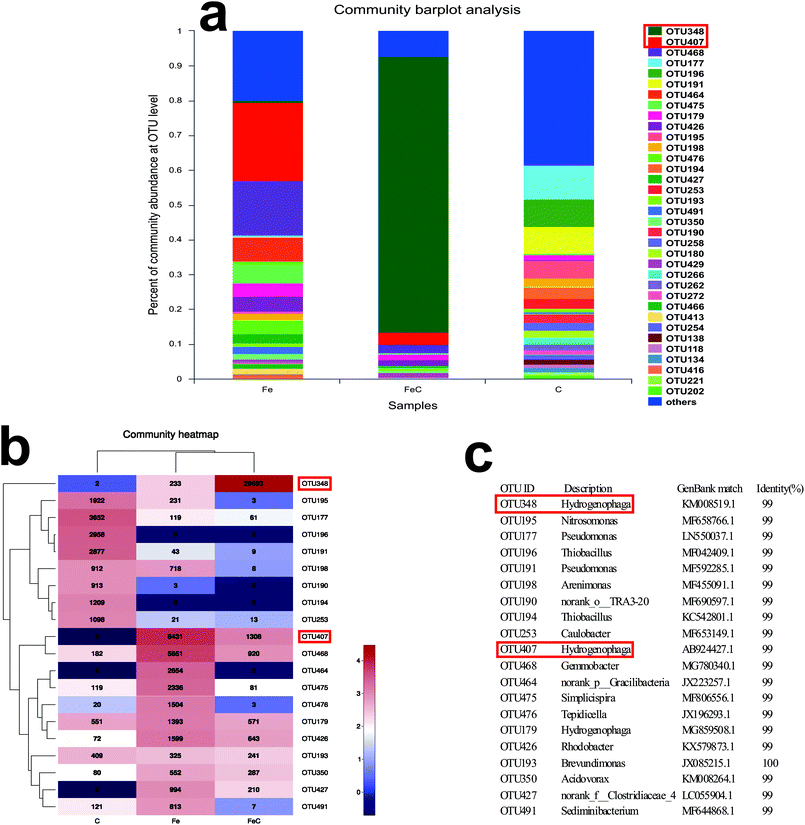
The abundance at OUT level, heat map and representative OUT (matched with the data in GenBank of National Center for Biotechnology Information) were shown in Fig. 6. OTU407 took the lead in Fe system (22.52%) while OTU348 established dominance in FeC system (79.32%). By contrast, the leading OTU348 in FeC system only had 0.62% share in Fe system. Similarly, OTU407 which was dominant in Fe system only had 3.49% distribution in FeC system. Although OTU407 and OTU348 both belong to the genus Hydrogenophaga, combined with results at genus level, the difference showed that the add of cokes into the iron scraps system may change the dominant species and increase the amount of genus Hydrogenophaga by acting as biofilm carriers though the effects on removal efficiency was tiny in our jar experiment. Heat map at OTU level also shows that OTU468 and OTU426 had high abundance in FeC system and Fe system compared with C system, while the amount of OTU195, OTU177, OTU196, OTU191, OTU190, OTU194 and OTU253 was opposite.
It's reported that genus Hydrogenophaga is closely related to the nitrate removal in previous studies. Hydrogenophaga are slightly curved rods and can be chemoorganotrophic or chemolithoautotrophic. When lacking of organics, Hydrogenophaga can gain energy from the oxidation of hydrogen.39 Previous study revealed that Hydrogenophaga can conduct heterotrophic denitrification using nitrate as terminal electron acceptor for the substitute for oxygen, and nitrate removal can only be achieved by heterotrophic denitrification.39 However, in other studies, there are different answers to the removal mechanism of Hydrogenophaga, which claimed that, in addition to the heterotrophic denitrification, Hydrogenophaga can also contribute to the hydrogenotrophic denitrification.40,41 Iron scraps and an activated carbon-based micro-electrolysis carrier were developed to remove nitrate in low C/N water in previous study.41 After 77 days operation, it turned out that Hydrogenophaga greatly increased and became dominant genus in the system. Zhang et al. employed a hollow fiber membrane biofilm reactor to promote nitrate removal and suggested that Hydrogenophaga probably plays an important role in hydrogenotrophic denitrification.42 Xing et al. verified that the removal of nitrate with Hydrogenophaga went well with or without organics and Hydrogenophaga plays an important role in hydrogenotrophic denitrification process in tertiary wastewater treatment.24 A glass bead biofilm reactor and H2 were employed to remove nitrate and the investigation of the system showed that an unculturable Hydrogenophaga sp. was dominant in reactor.26 These experiment showed the capacity of Hydrogenophaga to remove nitrate without organics, indicating that Hydrogenophaga can carry out both heterotrophic denitrification and hydrogenotrophic denitrification.
3.4. Reaction process elucidation
In the first period, the slow removal speed suggested that iron abiotic reaction played a major role in nitrate degradation and denitrifying bacteria was still in the adaptive phase. However, after 20 days microbial enrichment in the second period, the removal performance greatly improved in the third period, which indicated that both abiotic reaction of iron and biological denitrification contributed to the nitrate removal in this period.Zero-valent iron alone has been used to remove nitrate in previous studies. The abiotic reaction is illustrated in eqn (1).25,30,38,43 As shown in the equation, the main product is NH4+-N, which is also an undesirable pollutant in water treatment. Meanwhile, it's reported that iron corrodes in anaerobic conditions according to eqn (2).17,25,27,30,44–47 During the corrosion of iron in anaerobic environment, hydrogen is produced. Till et al. verified that pure culture of Paracoccus denitrificans can use the hydrogen produced as electron donor to remove nitrate through autotrophic denitrification and the product was innocuous gaseous nitrogen,17 which suggested that iron and microorganisms can perfectly cooperate with each other. The hydrogen produced by iron corrosion may also act as the energy source for Hydrogenophaga, accounting for the large amount of Hydrogenophaga in the system. In conclusion, hydrogen plays a key role in hydrogenotrophic denitrification as electron donor and nitrate is used as terminal electron acceptor by Hydrogenophaga as described in eqn (3).25,46,48
| NO3− + 4Fe0 + 10H+ → NH4+ + 4Fe2+ + 3H2O | (1) |
| Fe0 + 2H2O → H2 + Fe2+ + 2OH− | (2) |
| 5H2 + 2NO3− → N2 + 4H2O + 2OH− | (3) |
To acquire more harmless products, proper improvements need to be made to reduce the production of NH4+-N by adjusting reaction parameters such as hydraulic retention time, pH, iron concentration, microorganisms concentration, etc. It's reported that extending the reaction time can reduce the production of ammonia;49,50 the increase of pH in the system caused by the iron corrosion and denitrification can be detrimental to the growth of useful microorganisms and thus boost the chemical reaction rather than autotrophic denitrification, resulting in more ammonium yield;46 the iron and microorganisms are two key factors in the system and their concentrations can directly determine the proportion of biological denitrification and chemical reaction. The statistically significant association was found between nitrogen species of by-product and iron concentration38 and it turned out that initial biomass also influences the final products.30
Besides, the mechanism has not been completely verified. The role of Hydrogenophaga and the respective proportion of abiotic reaction and hydrogenotrophic denitrification in BSIS system should be further identified by isolation and purification of bacteria.
4. Conclusions
The BSIS system was developed for the removal of nitrate from low C/N wastewater. At the end of operation, the nitrate removal efficiency achieved 73.55% within 24 hours and genus Hydrogenophaga was dominant in the system. Iron scraps and extractive bacteria had synergistic effect on the removal of nitrate. Iron scraps, as one of the waste materials in the factories, are cost-effective to nitrate remediation for low C/N wastewater. Overall, BSIS system is suitable for large-scale application, and can be used in groundwater remediation and advanced treatment of effluent from sewage treatment plant to solve the nitrate pollution in low C/N wastewater.Conflicts of interest
There are no conflicts to declare.Acknowledgements
This work was supported by Major Science and Technology Program for Water Pollution Control and Treatment (2017ZX07603-003).References
- B. P. Chaplin, M. R. Schnobrich, M. A. Widdowson, M. J. Semmens and P. J. Novak, J. Environ. Eng., 2009, 135, 666–676 CrossRef CAS.
- M. J. Pennino, J. E. Compton and S. G. Leibowitz, Environ. Sci. Technol., 2017, 51, 13450–13460 CrossRef CAS PubMed.
- M. F. Dahab, Y. W. Lee and I. Bogardi, Water Sci. Technol., 1994, 30, 45–52 CrossRef CAS.
- K. A. Karanasios, I. A. Vasiliadou, S. Pavlou and D. V. Vayenas, J. Hazard. Mater., 2010, 180, 20–37 CrossRef CAS PubMed.
- H. Y. Cheng, X. D. Tian, C. H. Li, S. S. Wang, S. G. Su, H. C. Wang, B. Zhang, H. M. A. Sharif and A. J. Wang, Environ. Sci. Technol., 2017, 51, 12948–12955 CrossRef CAS PubMed.
- L. J. Waller, G. K. Evanylo, L. A. H. Krometis, M. S. Strickland, T. Wynn-Thompson and B. D. Badgley, Environ. Sci. Technol., 2018, 52, 5358–5366 CrossRef CAS PubMed.
- P. Li, Y. J. Wang, J. E. Zuo, R. Wang, J. Zhao and Y. J. Du, Environ. Sci. Technol., 2017, 51, 870–879 CrossRef CAS PubMed.
- X. Y. Meng, D. A. Vaccari, J. F. Zhang, A. Fiume and X. G. Meng, Environ. Sci. Technol., 2014, 48, 1541–1548 CrossRef CAS PubMed.
- O. Kavvada, W. A. Tarpeh, A. Horvath and K. L. Nelson, Environ. Sci. Technol., 2017, 51, 12061–12071 CrossRef CAS PubMed.
- F. X. Kong, L. Q. Dong, T. Zhang, J. F. Chen and C. M. Guo, Desalination, 2018, 437, 144–153 CrossRef CAS.
- F. Volpin, L. Chekli, S. Phuntsho, J. Cho, N. Ghaffour, J. S. Vrouwenvelder and H. K. Shon, Chemosphere, 2018, 203, 482–489 CrossRef CAS PubMed.
- F. D. Belkada, O. Kitous, N. Drouiche, S. Aoudj, O. Bouchelaghem, N. Abdi, H. Grib and N. Mameri, Sep. Purif. Technol., 2018, 204, 108–115 CrossRef.
- J. M. Baker and T. J. Griffis, J. Environ. Qual., 2017, 46, 1528–1534 CrossRef CAS PubMed.
- S. P. Sun, C. P. I. Nacher, B. Merkey, Q. Zhou, S. Q. Xia, D. H. Yang, J. H. Sun and B. F. Smets, Environ. Eng. Sci., 2010, 27, 111–126 CrossRef.
- M. Henze and G. H. Kristensen, Water Sci. Technol., 1994, 29, 101–107 CrossRef CAS.
- S. H. Deng, D. S. Li, X. Yang, S. B. Zhu and J. L. Li, Environ. Sci. Pollut. Res., 2016, 23, 6621–6630 CrossRef CAS PubMed.
- B. A. Till, L. J. Weathers and P. J. J. Alvarez, Environ. Sci. Technol., 1998, 32, 634–639 CrossRef CAS.
- J. F. Su, X. X. Luo, T. L. Huang, F. Ma, S. C. Zheng and S. C. Shao, Ind. Eng. Chem. Res., 2017, 56, 1723–1730 CrossRef CAS.
- Y. W. Liu, L. Peng, H. H. Ngo, W. S. Guo, D. B. Wang, Y. T. Pan, J. Sun and B. J. Ni, Environ. Sci. Technol., 2016, 50, 9407–9415 CrossRef CAS PubMed.
- S. Puig, M. Coma, J. Desloover, N. Boon, J. Colprim and M. D. Balaguer, Environ. Sci. Technol., 2012, 46, 2309–2315 CrossRef CAS PubMed.
- W. Xing, J. L. Li, D. S. Li, J. C. Hu, S. H. Deng, Y. W. Cui and H. Yao, Environ. Sci. Technol., 2018, 52, 7867–7875 CrossRef CAS PubMed.
- R. C. Zhang, X. J. Xu, C. Chen, D. F. Xing, B. Shao, W. Z. Liu, A. J. Wang, D. J. Lee and N. Q. Ren, Water Res., 2018, 143, 355–366 CrossRef CAS PubMed.
- F. M. Chen, X. Li, C. W. Gu, Y. Huang and Y. Yuan, Bioresour. Technol., 2018, 266, 211–219 CrossRef CAS PubMed.
- W. Xing, J. L. Li, P. Li, C. Wang, Y. A. Cao, D. S. Li, Y. F. Yang, J. Z. Zhou and J. N. Zuo, J. Environ. Sci., 2018, 65, 262–270 CrossRef PubMed.
- S. Biswas and P. Bose, J. Environ. Eng., 2005, 131, 1212–1220 CrossRef CAS.
- H. I. Park, Y. J. Choi and D. Pak, Biotechnol. Lett., 2005, 27, 949–953 CrossRef CAS PubMed.
- W. Xing, D. S. Li, J. L. Li, Q. Y. Hu and S. H. Deng, Bioresour. Technol., 2016, 211, 240–247 CrossRef CAS PubMed.
- G. X. Huang, Y. Y. Huang, H. Y. Hu, F. Liu, Y. Zhang and R. W. Deng, Chemosphere, 2015, 130, 8–16 CrossRef CAS PubMed.
- N. Sunger and P. Bose, Bioresour. Technol., 2009, 100, 4077–4082 CrossRef CAS PubMed.
- Y. An, T. L. Li, M. Y. Dong, Q. Q. Li, S. M. Wang and Z. Jin, Sci. Total Environ., 2009, 407, 5465–5470 CrossRef CAS PubMed.
- Y. An, T. L. Li, Z. H. Jin, M. Y. Dong and Q. Q. Li, Desalination, 2010, 252, 71–74 CrossRef CAS.
- L. Peng, Y. W. Liu, S. H. Gao, X. M. Chen, P. Xin, X. H. Dai and B. J. Ni, Sci. Rep., 2015, 5, 12331 CrossRef PubMed.
- S. W. Jeen, R. W. Gillham and A. Przepiora, J. Contam. Hydrol., 2011, 123, 50–64 CrossRef CAS PubMed.
- Q. H. Wu, C. M. Zheng, J. F. Zhang and F. W. Zhang, J. Earth Sci., 2017, 28, 447–456 CrossRef CAS.
- C. D. Rocca, V. Belgiorno and S. Meriç, Process Biochem., 2006, 41, 1022–1028 CrossRef.
- T. V. Nooten, D. Springael and L. Bastiaens, Environ. Sci. Technol., 2008, 42, 1680–1686 CrossRef PubMed.
- W. W. De, N. Boon, S. D. Siciliano and W. Verstraete, Environ. Microbiol., 2010, 5, 1192–1202 Search PubMed.
- S. Comba, M. Martin, D. Marchisio, R. Sethi and E. Barberis, Water, Air, Soil Pollut., 2012, 223, 1079–1089 CrossRef CAS.
- A. Willems, J. Busse, M. Goor, B. Pot, E. Falsen, E. Jantzen, B. Hoste, M. Gillis, K. Kersters, G. Auling and J. Deley, Int. J. Syst. Bacteriol., 1989, 39, 319–333 CrossRef CAS.
- W. Khanitchaidecha and F. Kazama, Water Sci. Technol.: Water Supply, 2012, 12, 72–81 CAS.
- S. H. Deng, D. S. Li, X. Yang, W. Xing, J. L. Li and Q. Zhang, Bioresour. Technol., 2016, 219, 677–686 CrossRef CAS PubMed.
- Y. H. Zhang, F. H. Zhong, S. Q. Xia, X. J. Wang and J. X. Li, J. Hazard. Mater., 2009, 170, 203–209 CrossRef CAS PubMed.
- M. J. Alowitz and M. M. Scherer, Environ. Sci. Technol., 2002, 36, 299–306 CrossRef CAS PubMed.
- B. T. Oh, C. L. Just and P. J. J. Alvarez, Environ. Sci. Technol., 2001, 35, 4341–4346 CrossRef CAS PubMed.
- L. J. Weathers, G. F. Parkin and P. J. Alvarez, Environ. Sci. Technol., 1997, 31, 880–885 CrossRef CAS.
- J. Kielemoes, P. De Boever and W. Verstraete, Environ. Sci. Technol., 2000, 34, 663–671 CrossRef CAS.
- X. Y. Yu, C. Amrhein, M. A. Deshusses and M. R. Matsumoto, Environ. Sci. Technol., 2006, 40, 1328–1334 CrossRef CAS PubMed.
- C. Della Rocca, V. Belgiorno and S. Meric, Process Biochem., 2006, 41, 1022–1028 CrossRef CAS.
- P. Westerhoff and J. James, Water Res., 2003, 37, 1818–1830 CrossRef CAS PubMed.
- J. L. Ginner, P. J. J. Alvarez, S. L. Smith and M. M. Scherer, Environ. Eng. Sci., 2004, 21, 219–229 CrossRef CAS.
- X. N. Tong, X. Z. Wang, X. J. He, K. Q. Xu and F. J. Mao, Sci. Total Environ., 2019, 656, 503–511 CrossRef CAS PubMed.
Footnote |
| † Electronic supplementary information (ESI) available. See DOI: 10.1039/c8ra09091b |
| This journal is © The Royal Society of Chemistry 2019 |

