 Open Access Article
Interesting phase behaviors and ion-conducting properties of dicationic N-alkylimidazolium tetrafluoroborate salts†
Hyunho Chaea,
Yong-Hoon Leea,
Minyong Yangb,
Won-Jin Yoonc,
Dong Ki Yoon bd,
Kwang-Un Jeong
 c,
Yeon Hwa Songe,
U Hyek Choi
 e and
Minjae Lee
 *a
*a
aDepartment of Chemistry, Kunsan National University, 558 Daehak-ro, Gunsan, South Korea. E-mail: minjae@kunsan.ac.kr
bGraduate School of Nanoscience and Technology, Korean Advanced Institute of Science and Technology, 291 Daehak-ro, Yuseong-gu, Daejeon, South Korea
cDepartment of Polymer-Nano Science and Technology, Chonbuk National University, 567 Baekje-daero, Deokjin-gu, Jeonju, South Korea
dDepartment of Chemistry and KINC, Korean Advanced Institute of Science and Technology, 291 Daehak-ro, Yuseong-gu, Daejeon, South Korea
eDepartment of Polymer Engineering, Pukyong National University, 45 Yongso-ro, Nam-Gu, Busan, South Korea
First published on 29th January 2019
Abstract
A series of dicationic imidazolium bis(tetrafluoroborate) salts were newly synthesized, and their phase transition behaviors were correlated with thermal, scattering, optical and conductivity results. The bis-imidazolium salts having side-chain lengths of C6–C10 showed plastic crystal mesophases, while a liquid crystal mesophase was formed in the bis-imidazolium salts with long side-chains (C11 and C12). Soft plastic and liquid crystalline phases were also confirmed by wide-angle X-ray diffraction. For the bis-imidazolium salts exhibiting a plastic crystal mesophase, the ionic conductivity suddenly increased at the melting temperature. However, the bis-imidazolium salts with long side-chains showed a slope increase during the liquid crystal-liquid crystal transition.
Introduction
Imidazolium salts have received significant interest because of their wide range of applications as ionic liquids (ILs),1 organic ionic plastic crystals (OIPCs),2 and ionic liquid crystals (ILCs).3 A number of imidazolium salts are commercially available either as room temperature ionic liquids (RTILs) or as ionic salts having higher melting points. The physical and electrical properties of the imidazolium salts have been reported by many scientist groups due to their wide range of applications. Even though numerous imidazolium salts have been synthesized, new imidazolium-based compounds are still being developed, and this kind of study is still worthy to expand the warehouse of ionic materials.Imidazolium OIPC materials are relatively rare compared to OIPCs of ammonium-based or phosphonium-based ones: a terbium diketonate salt of N-(n-butyl)-N′-methylimidazolium4 and 1,2-bis[N-(N′-alkylimidazolium)]ethane salts.5–8 Some bis-imidazolium salts (Br− or PF6−) showed multiple solid–solid phase transitions and small ΔSf values (≤12 J K−1 mol−1), which corresponded to the classical definition of OIPCs.9 From solid-state NMR studies, we inferred that the imidazolium rings flip within 30–60 degrees in the soft crystalline phase.6 Also, a careful observation of ions in the amorphous/crystalline fractions in the solid state by NMR showed that a bis-imidazolium PF6− salt with n-hexyl side-chains may align in an external magnetic field.7
During the last few decades, it has been shown that liquid crystallinity can successfully enhance the ionic conductivity of ionic organic materials.3,10–13 Due to the nature of long-range ordering in a liquid crystal (LC), a certain bridge, providing high ionic conductivity, is made via self-assembly of the molecules. Furthermore, the ionic liquid crystal material is also said to be significantly versatile by means of its self-healing and flexibility. As a result, ionic liquid crystal materials are thought to be future candidates for electrolytes in batteries, solar cells, and fuel cells.14,15
Herein, we found that tetrafluoroborate (BF4−) salts of dicationic bis-imidazolium compounds also show either OIPC or LC properties. By changing the alkyl side-chain length on the imidazolium moiety, some compounds exhibited plastic crystal phases but others showed liquid crystalline phases. Most of this series of bis-imidazolium salts showed multiple solid–solid phase transitions and small heat absorptions at their melting temperatures. A detailed structure–property relationship of these new imidazolium salts was also discussed.
Results and discussion
The synthetic scheme of the dicationic imidazolium BF4− salts is shown in Fig. 1. The bromide salt of 1,2-bis(N-alkyl-imidazolium)ethane was prepared first according to a previously reported method.5,6 Ion exchange reactions were carried out in deionized water or organic solvents, such as acetone or acetonitrile (MeCN). Deionized water was effective in these ion exchange reactions when the BF4− salts were insoluble in water; however, organic solvents were used for the water-soluble tetrafluoroborate salts. All the obtained bis-imidazolium BF4− salts were negative on the copper-flame test, which showed no remaining bromide anions after anion exchange.The structures of the synthesized imidazolium BF4− salts were confirmed by NMR spectroscopy. In the 1H NMR spectrum (Fig. 2), the imidazolium protons of C8 are shown at δ 7.77, 7.81 and 9.1; the bridge ethylene protons are present at δ 5.0 (singlet), and the N–CH2 protons can be found at δ 4.3 (triplet), which correspond to previously reported results.5 The other alkyl protons of the alkyl side-chains are shown at a higher field. The 1H NMR spectra of the other compounds were almost the same except for the integration numbers of the alkyl side-chain peaks.
The thermal stability of the bis-imidazolium BF4− salts was confirmed by TGA experiments under an N2 atmosphere. As shown in Table 1, all the BF4− salts were thermally stable up to 310 °C. The thermal decomposition mechanism was mostly 1-step from the 1st derivative line of the TGA thermograms (ESI, Fig. S9†).
| Entry | DSC | Melting point (°C) | TGA 5% weight loss (°C) | ||
|---|---|---|---|---|---|
| Tss (°C) [∑ΔSssa (J K−1 mol−1)] | Tm (°C) | ΔSfb (J K−1 mol−1) | |||
| a ∑ΔSss is calculated from the summation of ΔSss values at all Tss transitions.16b ΔSf = ΔHf (J mol−1)/T (K).17c C4 showed Tg at −31 °C on the second heating scan.d Two heat absorption peaks only on the first heating scan but no heat absorption peak on the second heating scan. | |||||
| C4 | −31c | 81, 246d | — | 79.4–84.0 | 353 |
| C6 | 72 [9] | 129 | 38 | 116.3–119.6 | 350 |
| C7 | 28, 75 [103] | 158 | 39 | 157.1–159.0 | 356 |
| C8 | 37, 55 [13] | 174 | 32 | 173.1–175.3 | 331 |
| C10 | 34, 56, 85 [149] | 191 | 33 | 186.2–191.0 | 354 |
| C11 | 66, 75, 82 [133] | 180 (LC–LC) | 18 | 178.6–182.2 | 317 |
| 205 (LC–I) | 3.8 | ||||
| C12 | 42, 76, 90 [119] | 187 (LC–LC) | 17 | 185.5–190.7 | 321 |
| 254 (LC–I) | 3.3 | ||||
The thermal phase behaviors of the synthesized bis-imidazolium BF4− salts are summarized in Table 1. Also, the dependence of melting temperature and solid–solid phase transition temperature on the side-chain length of the imidazolium salts is shown in Fig. 3. Phase changes including glass transition temperature (Tg), solid–solid phase transition temperature (Tss) and melting temperature (Tm) of the imidazolium salts were analyzed by differential scanning calorimetry (DSC) and mostly on a second heating scan. Melting temperatures were also visually confirmed by a melting point apparatus. Tm of the dicationic imidazolium BF4− salts increased with the increase in the length of the alkyl side-chains from C6 to C10; however, the Tm values of C11 and C12 were lower than Tm of C10. The melting peaks of C11 and C12 were quite small due to the small heat absorptions during melting.
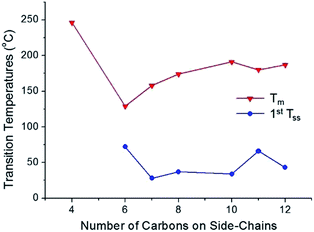 | ||
| Fig. 3 Relationship between the side-chain length and melting temperature/first solid–solid phase transition temperature for the synthesized dicationic imidazolium BF4− salts. | ||
From C6 to C12, every bis-imidazolium salt showed one or multiple solid–solid phase transitions during the second heating scan in the DSC analysis. The first solid–solid transition temperature (Tss) of C7 was the lowest, and among C6, C7 and C8, the heat absorption peak at Tss of C7 was the most distinct; the molar entropy during the solid–solid transition (ΔSss) at 28 °C was quite large: 103 J K−1 mol−1. Despite the large heat absorption at 28 °C (Tss), C7 still exhibited a large melting peak in the DSC thermogram (Fig. 4).
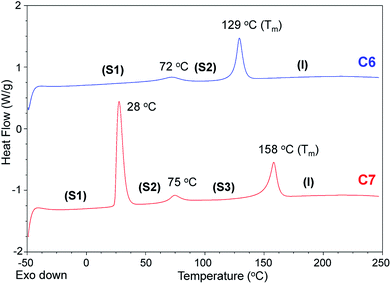 | ||
| Fig. 4 DSC thermograms of C6 (blue) and C7 (red) (2nd heating scans, heating rate = 10 K min−1, N2). | ||
The entropies of fusion (ΔSf) of the bis-imidazolium tetrafluoroborate salts could be calculated from the heat absorptions (J g−1) of the melting peaks and sample weights, as shown in Table 1. The ΔSf values of C6–C10 were in the range from 32 to 39 J K−1 mol−1.
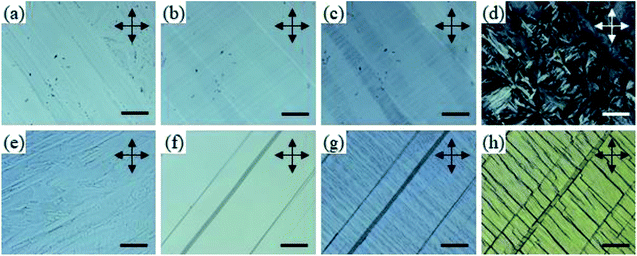
Using a polarized optical microscope (POM), phase sequences of C6 and C7 were investigated through the decreasing temperature from their melting phase. Fig. 6a shows the POM image at 100 °C after the first crystallization occurs; here, uniformly aligned crystalline domains as large as a few millimeters are observed with strong birefringence. This highly ordered texture was preserved after cooling to room temperature (Fig. 6b) with a cooling rate of 1 °C min−1 as the phase transition at 72 °C was suppressed. The only notable change was the elongation of dark domains, possibly made of macro-separated tetrafluoroborates, which were not ordered after the first crystallization. We suggested that the separated anions were elongated through the cationic channel, which was parallel to the direction of the crystal growth.
After the sample was kept at room temperature overnight, suppressed phase transition finally occurred, due to which disordered crystal texture was generated (Fig. 6d). In the case of C7, similar to that observed for C6, uniformly aligned crystalline texture with disordered dark domains was observed immediately after first crystallization (Fig. 6e). After cooling to 100 °C, again, similar to the observation for C6, the dark domains were aligned through the crystalline domain (Fig. 6f). However, the elongated dark domains were significantly thicker than those of C6. When further cooled to 50 °C, undulation perpendicular to the crystal growth direction was generated. Furthermore, when the sample was cooled to room temperature, a domain crack induced by shrinking was generated (Fig. 6g). In this phase, in contrast to the observation for C6, the molecular orientation was almost conserved after the last solid–solid phase transition (Fig. 6h). In the case of both C6 and C7, according to the existence of birefringence, it could be noted that the molecules were aligned parallel to the substrate. This alignment could possibly result in an ion-conductive bridge made of the aligned imidazolium moieties.
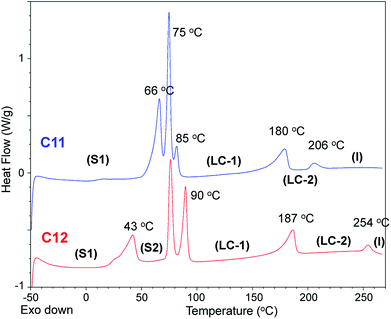
Bis-imidazolium tetrafluoroborate salts with long alkyl chains, C11 and C12, showed unique phase behaviors compared to other compounds. The ΔS values of C11 and C12 were quite small: 18 and 17 J K−1 mol−1 for LC–LC phase transitions and 3.8 and 3.3 J K−1 mol−1 for LC–isotropic transitions, respectively; the total entropy changes at their solid–solid phase transitions were large: 133 and 117 J K−1 mol−1, respectively. For C11 and C12, a liquid crystalline phase sequence was observed during both the heating and cooling processes. In particular, within C11 and C12, smectic-like liquid crystalline texture was observed in the POM experiments. During the cooling process, a batonnet-like structure was generated at the melting temperature, which was transformed to a typical smectic fan-shaped structure on further cooling (Fig. 7). The blue and yellow optical domains in the right side of Fig. 7a signify the parallelly and perpendicularly aligned molecular directors with the optic axis (λ) of the full wave plate, respectively.18,19 From the liquid crystalline texture, similar to the observations for C6 and C7, it was suggested that the C12 molecules in each layer were aligned parallel to the substrate surface, which resulted in the ion-conductive bridge between the two substrates made by the imidazolium moieties of C12.
 | ||
| Fig. 7 POM images of C12 during cooling from its isotropic phase: (a) at 200 °C, (b) at 150 °C, (c) at room temperature. All scale bars correspond to 200 μm. | ||
Also, after the phase transition to the smectic X phase and crystal phase, it can be supposed that this conductive bridge is conserved as the molecular orientation is still parallel to the substrate surface in these phases. As revealed in POM images, the direction of liquid crystalline domains cannot be controlled by a conventional rubbing method similar to the observations for other smectic phases with a direct phase transition from the isotropic phase to the smectic phase.
As shown in Fig. 8, 1D wide-angle X-ray scattering (1D WAXD) patterns are obtained during heating at the rate of 10 °C min−1, corresponding to the POM images of C7 and C12 in Fig. 6 and 7. When the temperature was 20 °C, diffraction patterns were detected at 2θ = 4.8° (d-spacing = 1.84 nm) in the low-angle region, 14.3° (d-spacing = 0.62 nm), 18.9–23° from alkyl chain crystal peaks and 25.65° (d-spacing = 0.35 nm) from π–π interaction peaks in the wide-angle region. The diffraction peak at 2θ = 4.8° originated from the layer packing of C7 molecules. The disappearance of the peak at 2θ = 25.65° over 30 °C showed the loss of the intermolecular π–π interactions between imidazolium rings, which directly corresponded to the plastic crystalline phase (Fig. 6g, 50 °C) and the cracked crystalline phase (Fig. 6(h), 25 °C). Over 150 °C, the diffraction patterns of the wide-angle region changed to a broad amorphous halo with maximum intensity at 2θ = 19.9°, while the single diffraction peak in the low-angle region (2θ = 4.4°) remained.
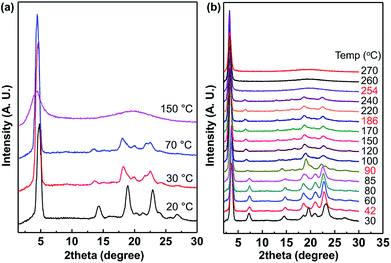 | ||
| Fig. 8 1D wide-angle X-ray scattering spectra of (a) the plastic crystal C7 and (b) the liquid crystal C12 at different temperatures. | ||
As shown in Fig. 8b, the peak patterns between 2θ = 18 and 25° at 30 °C are different from those in the range of 42–85 °C and this corresponds to Tss at 43 °C in the DSC thermogram (Fig. 5). In the spectra from 100 °C to 240 °C, the peak positions are almost the same even though the peak intensities are slightly weakened at higher temperatures. The phase transition at 187 °C of the corresponding DSC curve is not observed in the XRD spectra. Therefore, the LC phase was formed from the crystalline phase after the large heat absorptions, and the LC phase was maintained up to 240 °C. The isotropic phase was also confirmed by XRD above 254 °C, where no significant peak was observed at a value larger than 2θ = 5°.
Ionic conductivity as a function of temperature while cooling was measured for the bis-imidazolium BF4− salts using dielectric relaxation spectroscopy. These salts generally reveal conductivities in the range from 10−14 to 10−3 S cm−1 with discontinuities and changes in slopes at either the solid–solid or melting phase transitions. The results for C6 and C11 are exemplarily shown in Fig. 9. For C6, the slope changes occurred at around 60 °C, which was slightly below the solid–solid transition temperature (72 °C) detected by DSC; this may be attributed to a slight thermal lag of the cooling chamber of dielectric relaxation spectroscopy (Fig. 9a). Significantly enhanced conductivity over 10−3 S cm−1 was observed at 130 °C due to the melting transition, i.e., the formation of its isotropic phase, where C6 becomes a molten salt (similar to an ionic liquid). C7 showed similar behaviors (ESI, Fig. S15†). At Tss = 28 °C, the conductivity slope change occurred, and a sharp increase was observed during its melting at 158 °C similar to the results for C6. As shown in Fig. 9b, C11 exhibits change in the conductivity slope at 50–80 °C, where both the solid–solid and solid–LC transitions occur (Fig. 5). Above 100 °C, the phase transition from the solid to softer LC phase led to a lower slope in conductivity, presumably indicating decrease in the activation energy of ion conduction. Also, some of the dots of the conductivity plot at 50–80 °C are away from the two trend lines because multiple phase transitions occur in that temperature range (red circle in Fig. 9b). Furthermore, another conductivity slope change is shown near 170 °C, where the LC1–LC2 phase transition is detected by DSC, POM, and 1D XRD.
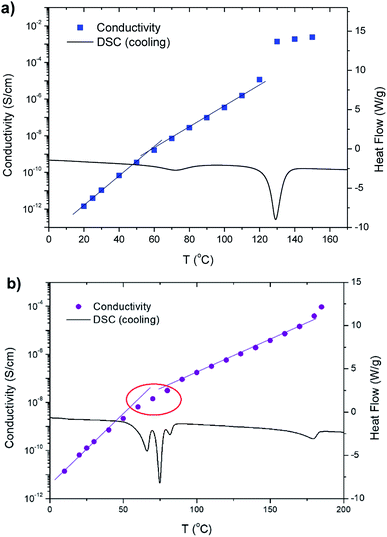 | ||
| Fig. 9 Ionic conductivity (left axis) as a function of temperature while cooling combined with DSC cooling traces (right axis) for (a) C6 and (b) C11. | ||
Conclusions
New dicationic imidazolium bis(tetrafluoroborate) salts were synthesized and their thermal phase behaviors were studied. The bis-imidazolium BF4− salts were stable up to 315 °C, as confirmed by TGA, and their thermal degradations involved a one-step pathway. DSC indicated that C6 exhibited a single solid–solid phase transition, but C7–C12 showed multiple heat absorption peaks below their melting temperatures. C4 showed two melting peaks for the first heating scan but no transition (amorphous) during the second scan. From the POM investigations through decreasing temperature from the isotropic phase, we found that C6 and C7 have plastic crystalline phases; uniformly aligned crystalline textures with disordered dark domains were observed and they were maintained until the lowest solid–solid phase transition temperature. For C11 and C12 with longer side-chains, POM images showed smectic A fan-shaped liquid crystalline textures. The smectic phase was retained to the lowest phase transition temperature and it turned to a stable crystalline phase. Thus, we found that different lengths of the alkyl side-chains can change the ordering behaviors from plastic crystalline phases with shorter C6 or C7 side-chains to liquid crystalline phases with longer C11 and C12 ones even though all the salts have an identical bis-imidazolium unit. The smaller molar ΔS values of C11 and C12 for LC–LC (18 and 17 J K−1 mol−1) and LC–isotropic phase transitions (3.8 and 3.3 J K−1 mol−1) compared to the larger ΔSf values of C6 and C7 (38 and 38 J K−1 mol−1) may be explained by the existence of relatively less ordered liquid crystalline phases of C11 and C12. The wide-angle X-ray scattering results with decreasing temperatures also supported these unique phase behaviors with different chemical structures. The ionic conductivity changes of C6 showed a large increase at the melting temperature, which can be explained by the transition of long-ordered plastic crystalline to isotropic phase. For C11, the less-ordered liquid crystalline smectic A phase showed higher ionic conductivity and the LC–LC phase transition just showed a slope change in the conductivity.Experimental
Materials
N-Alkylimidazoles were prepared following previously reported procedures.5,6 Acetone as a reaction solvent was dried over anhydrous CaSO4 and then distilled. Acetonitrile (MeCN) as a reaction solvent was dried over anhydrous K2CO3 and then distilled. Tetrahydrofuran (THF) was distilled with some benzoquinone and sodium. Deuterated NMR solvents were bought from Cambridge Isotope Laboratories and used as received. All other chemicals and solvents were used as received.Instruments
1H and 13C NMR spectra were obtained on a Varian VNMRS 500 MHz spectrometer. The molecular mass values of the compounds were analyzed by a Synapt G2 HDMS quadrupole time-of-flight (TOF) mass spectrometer equipped with an electrospray ion source (Waters, Milford, MA, USA) in positive ion mode. DSC results were obtained on a TA Instrument Q200 differential scanning calorimeter with a scan rate of 10 K min−1 under N2. TGA results were obtained on a TA Instrument SDT Q600 Simultaneous TGA/DSC with a heating rate of 10 K min−1 under N2. Melting points were observed on an Electrothermal 9300 melting point apparatus with a 1 K min−1 heating rate. Ionic conductivity was measured on a Novocontrol GmbH Concept 40 broad band dielectric spectrometer. Samples for dielectric relaxation spectroscopic measurements were placed on a 30 mm-diameter polished brass electrode and dried in vacuo at 100 °C for 24 h, after which a second polished brass electrode with 15 mm diameter was placed on top of the sample. Also, 50 μm silica-rod spacers were used to control the sample thickness. Data were collected in isothermal frequency sweeps every 5 K from 220 to 0 °C under a dry N2 flow. Frequency sweeps were performed isothermally from 10 MHz to 0.01 Hz for every measurement.Polarized optical microscope
Direct visualization of optical textures was carried out by POM (LV100POL, Nikon) equipped with a charge-coupled device (CCD) camera (DS-Ri1, Nikon). The temperature was controlled with the heating stage (Linkam LTS420) and a temperature controller (Linkam TMS94).Wide-angle X-ray diffraction
The 1D WAXD patterns were obtained by using D8 Discover 3 kW, Bruker AXS. The diffraction peak positions and widths were calibrated with silver behenate in the low-angle region and a silicon crystal standard in the wide-angle region. To monitor the phase transition with temperature changes, a hot stage was calibrated to be ±1 °C error. Samples were scanned across a 2θ-angle range from 2° to 30°.Synthetic procedures for bis-imidazolium BF4− salts
Conflicts of interest
There are no conflicts to declare.Acknowledgements
All authors thank to Korean Institute of Materials Science (KIMS) for ionic conductivity measurements. We also acknowledge to Kunsan National University Center for Research Facilities for the giving a chance to use of NMR and thermal analysis equipments. This research is financially supported by Basic Science Research Program (2016R1D1A3B03932891, 2016R1D1A1B03932055), and Creative Materials Discovery Program (2018M3D1A1058624) through the National Research Foundation of Korea (NRF) funded by Ministry of Science and ICT.Notes and references
- Recent review papers: (a) S. Wang and X. Wang, Angew. Chem., Int. Ed., 2016, 55, 2308–2320 CrossRef CAS PubMed; (b) B. Wang, Q. Li, T. Mu, Z. Xue and G. Gao, Chem. Rev., 2017, 117, 7113–7131 CrossRef CAS PubMed; (c) K. Dong, S. Zhang and J. Wang, Chem. Commun., 2016, 52, 6744–6764 RSC.
- Recent review papers: (a) M. Forsyth, F. Chen, L. A. O'Dell and K. Romanenko, Solid State Ionics, 2016, 288, 160–166 CrossRef CAS; (b) J. M. Pringle, J. Adebahr, D. R. MacFarlane and M. Forsyth, Phys. Chem. Chem. Phys., 2010, 12, 7234 RSC.
- Recent review papers: (a) A. A. Fernandez and P. H. J. Kouwer, Int. J. Mol. Sci., 2016, 17, 731 CrossRef PubMed; (b) K. Goossens, K. Lava, C. W. Bielawski and K. Binnemans, Chem. Rev., 2016, 116, 4643–4807 CrossRef CAS PubMed.
- S.-F. Tang and A.-V. Mudring, Eur. J. Inorg. Chem., 2009, 19, 2769 CrossRef.
- M. Lee, Z. Niu, C. Slebodnick and H. W. Gibson, J. Phys. Chem. B, 2010, 114, 7312–7319 CrossRef CAS PubMed.
- M. Lee, U. H. Choi, S. Wi, C. Slebodnick, R. H. Colby and H. W. Gibson, J. Mater. Chem., 2011, 21, 12280–12287 RSC.
- B. E. Kidd, M. D. Lingwood, M. Lee, H. W. Gibson and L. A. Madsen, J. Phys. Chem. B, 2014, 118, 2176–2185 CrossRef CAS PubMed.
- M. Lee, Y.-H. Lee, J. H. Park and U. H. Choi, Org. Electron., 2017, 48, 241–247 CrossRef CAS.
- J. Timmermans, Phys. Chem. Solids, 1961, 18, 1 CrossRef CAS.
- J. Sakuda, M. Yoshio, T. Ichikawa, H. Ohno and T. Kato, New J. Chem., 2015, 39, 4471–4477 RSC.
- T. Kato, Angew. Chem., Int. Ed., 2010, 49, 7847–7848 CrossRef CAS PubMed.
- Y. Iinuma, K. Kishimoto, Y. Sagara, M. Yoshio, T. Mukai, I. Kobayashi, H. Ohno and T. Kato, Macromolecules, 2007, 40, 4874–4878 CrossRef CAS.
- M. Yoshio, T. Mukai, K. Kanie, M. Yoshizawa, H. Ohno and T. Kato, Adv. Mater., 2002, 14, 351–354 CrossRef CAS.
- J. Sakuda, E. Hosono, M. Yoshio, T. Ichikawa, T. Matsumoto, H. Ohno, H. Zhou and T. Kato, Adv. Funct. Mater., 2015, 25, 1206–1212 CrossRef CAS.
- D. Högberg, B. Soberats, R. Yatagai, S. Uchida, M. Yoshio, L. Kloo, H. Segawa and T. Kato, Chem. Mater., 2016, 28, 6493–6500 CrossRef.
- The entropy change at solid–solid phase transitions are calculated by the summation of the molar entropies of all heat absorption peaks at Tss. For example, total ΔSss of C12 was calculated by the summation of each ΔSss value from the heat absorptions at 43, 76 and 90 °C..
- ΔSf and ΔSss can be calculated from ΔH (J mol−1)/T (K). Each ΔH (J mol−1) can be calculated from the heat absorption values (J g−1) from the linear integration of the each Tm (or Tss) peak on DSC and molecular weight of the salts.
- M.-J. Gim, D. A. Beller and D. K. Yoon, Nat. Commun., 2017, 8, 15453 CrossRef CAS PubMed.
- M.-J. Gim and D. K. Yoon, ACS Appl. Mater. Interfaces, 2016, 8, 27942–27948 CrossRef CAS PubMed.
Footnote |
| † Electronic supplementary information (ESI) available. See DOI: 10.1039/c8ra09208g |
| This journal is © The Royal Society of Chemistry 2019 |


