 Open Access Article
Catalytic decomposition of N2O over Cu–Al–Ox mixed metal oxides
Magdalena Jabłońska *ab,
Miren Agote Aránc,
Andrew M. Beale
 cd,
Kinga Góra-Marek
 e,
Gérard Delahayf,
Carolina Petittof,
Kateřina Pacultovág and
Regina Palkovits
 *ab
*ab
aChair of Heterogeneous Catalysis and Chemical Technology, RWTH Aachen University, Worringerweg 2, 52074 Aachen, Germany. E-mail: Palkovits@itmc.rwth-aachen.de; Jablonska@itmc.rwth-aachen.de; Fax: +49 241 80 22177; Tel: +49 241 80 26497
bCenter for Automotive Catalytic Systems Aachen – ACA, RWTH Aachen University, Schinkelstr. 8, 52062 Aachen, Germany
cDepartment of Chemistry, University College London, 20 Gordon Street, London, WC1H 0AJ, UK
dUK Catalysis Hub, Research Complex at Harwell, Rutherford Appleton Laboratories, Didcot, Oxon OX11 0FA, UK
eFaculty of Chemistry, Jagiellonian University in Kraków, Gronostajowa 2, 30-387 Kraków, Poland
fInstitut Charles Gerhardt de Montpellier, 240 Avenue du Professeur Emile Jeanbrau, 34296 Montpellier Cedex 5, France
gVŠB-Technical University of Ostrava, 17. listopadu 15, 708 33 Ostrava, Czech Republic
First published on 29th January 2019
Abstract
Cu–Al–Ox mixed metal oxides with intended molar ratios of Cu/Al = 85/15, 78/22, 75/25, 60/30, were prepared by thermal decomposition of precursors at 600 °C and tested for the decomposition of nitrous oxide (deN2O). Techniques such as XRD, ICP-MS, N2 physisorption, O2-TPD, H2-TPR, in situ FT-IR and XAFS were used to characterize the obtained materials. Physico-chemical characterization revealed the formation of mixed metal oxides characterized by different specific surface area and thus, different surface oxygen default sites. The O2-TPD results gained for Cu–Al–Ox mixed metal oxides conform closely to the catalytic reaction data. In situ FT-IR studies allowed detecting the form of Cu+⋯N2 complexes due to the adsorption of nitrogen, i.e. the product in the reaction between N2O and copper lattice oxygen. On the other hand, mostly nitrate species and NO were detected but those species were attributed to the residue from catalyst synthesis.
1. Introduction
Nitrous oxide (N2O) significantly contributes to the greenhouse effect and ozone destruction in the stratosphere. The main anthropogenic source of N2O is nitric acid production (about 1% of all greenhouse gas emission).1 The catalytic decomposition of N2O up to 450–500 °C provides an attractive solution for reducing N2O emissions in tail gas from the point of both application and operation costs, respectively.2 To control the emission of N2O, many catalysts have been reported for the catalytic decomposition of N2O, including supported metals, pure and mixed oxides, and zeolites, etc.1 Among them, mixed oxides containing cobalt spinels revealed excellent activity in deN2O, however, cobalt toxicity represents another serious issue. On the other side, copper-based materials represent one of the classes of catalysts dedicated to N2O decomposition with their low cost and high catalytic activity. E.g. commercial and mesoporous CuO,3 CuO supported on different carriers, such as Al2O3, ZnAl2O4, ZrO2 [e.g. ref. 4 and 5], Cu-containing zeolites [e.g. ref. 6], CuO–CeO2 [e.g. ref. 7] were investigated for N2O decomposition. Several works aimed to study N2O decomposition over hydrotalcite derived mixed metal oxides. In particular, Chmielarz et al.8 reported significantly higher activity of Cu–Mg–Al–Ox hydrotalcite derived mixed metal oxides than analogues Co–Mg–Al–Ox. Cu–Mg–Al–Ox with molar ratios of Cu/Mg/Al = 10/61/29 and calcined at 600 °C, reached full N2O conversion at 600 °C in the presence of O2 (0.1 g catalyst, 0.5 vol% N2O/He, 4.5 vol% O2/He, 50 cm3 min−1). Kannan9 found 48% N2O conversion at 450 °C over Cu–Al–Ox (Cu/Al = 3/1, mol. ratio, 0.1 g catalyst, 0.0985 vol% N2O/He, 100 cm3 min−1). Co-containing catalysts were more active than corresponding Cu-systems (84 versus 48% at 450 °C). The best results were obtained for the Co–Al–Ox catalyst with a Co/Al molar ratio of 3/1 among ratios of 3–1/1. Pan10 tested samples with different Cu/Al molar ratios (2–4/1) in the presence of O2 (1.0 g catalyst, 2.0 vol% N2O/Ar, 4.0 vol% O2/Ar, 140 cm3 min−1) and also found out that Cu/Al = 3.1/1, mol. ratio, was the most active. However, no simple correlation between activity and Cu/Al ratio was obtained and deeper insight into the effect of material composition would be desirable. Thus, the above studies motivated us to prepare Cu–Al–Ox mixed metal oxides and explore the effects of different molar ratios of used metals (Cu/Al = 85/15, 78/22, 75/25, 60/30). We investigated the relationship between the physicochemical properties and the catalytic activity in deN2O over Cu–Al–Ox mixed metal oxides using XRD, ICP-MS, N2 physisorption, O2-TPD, H2-TPR, in situ FT-IR and EXAFS combined with microreactor catalytic tests. The in situ FT-IR experiments allowed monitoring the surface nitrogen groups, while application of in situ EXAFS revealed the oxidation/coordination state of copper oxides species of Cu–Al–Ox mixed metal oxides during deN2O.2. Experimental
2.1. Catalyst preparation
A series of Cu–Al precursors with intended molar ratios of Cu/Al = 85/15, 78/22, 75/25, 60/30 were prepared by coprecipitation. An aqueous solution containing appropriate amounts of Cu(NO3)2·3H2O (Sigma), Al(NO3)3·9H2O and 1 M NaOH (Chemsolute) was dropped simultaneously to a vigorously stirred aqueous solution containing a slight over-stoichiometric excess of Na2CO3 (Sigma) at 60 °C. The pH of the reaction mixture was maintained constant at 10.0 ± 0.2 throughout the whole synthesis by NaOH addition. The obtained suspension was aged at 60 °C for another 0.5 h after complete coprecipitation. The solid was filtered, washed carefully with distilled water and dried at room temperature. Finally, the prepared precursors were crushed and calcined at 600 °C for 6 h with a heating ramp of 10 °C min−1 and in static air. For catalytic experiments, a fraction of particle size in the range of 0.250–0.500 mm was used.2.2. Catalyst characterization
The X-ray diffraction (XRD) analysis of the mixed metal oxides was performed applying a Siemens D5000 XRD diffractometer using Cu-Kα radiation (λ = 1.54056 Å, 45 kV, 40 mA).The chemical composition of mixed metal oxides was determined by ICP-MS using an Agilent Technologies 8800 Triple Quad spectrometer. Prior to the measurement, the sample (50 mg) was dissolved in 6 cm3 mixture of concentrated acids (HCl![[thin space (1/6-em)]](https://www.rsc.org/images/entities/char_2009.gif) :
:![[thin space (1/6-em)]](https://www.rsc.org/images/entities/char_2009.gif) HNO3, 1
HNO3, 1![[thin space (1/6-em)]](https://www.rsc.org/images/entities/char_2009.gif) :
:![[thin space (1/6-em)]](https://www.rsc.org/images/entities/char_2009.gif) 1), and afterwards, the resulting mixture was diluted with 64 cm3 deionized water before warming up to 40 °C for 24 h.
1), and afterwards, the resulting mixture was diluted with 64 cm3 deionized water before warming up to 40 °C for 24 h.
The specific surface area (SBET) of the mixed metal oxides was determined by low-temperature (−196 °C) N2 sorption using a Quantachrome Quadrasorb SI. Prior to nitrogen adsorption, the samples were outgassed at 250 °C for 12 h using a Quantachrome Flovac degasser. The specific surface area (SBET) was calculated using the Brunauer–Emmett–Teller (BET) multiple point method in the p/p0 range from 0.05 to 0.3.
The temperature-programmed desorption of O2 (O2-TPD) was performed to investigate oxygen desorption behaviour using a Micromeritics AUTOCHEM 2910. 49–58 mg of sample was loaded into a quartz tube and pretreated in reconstituted air (20.0 vol% O2/80.0 vol% N2) at 600 °C (30 cm3 min−1). After cooling down to 80 °C, the pretreated sample was heated up to 600 °C with a linear heating rate of 10 °C min−1 in a carrier gas of He (15 cm3 min−1) and kept for 10 min at 600 °C and cooled down up to 80 °C in the same flow (He). Then this material was heated, under a flow of 1.0 vol% N2O/He (30 cm3 min−1), at 600 °C (plateau 10 min) and cooled to 80 °C. Afterward the second run of O2-TPD was performed under He flow (15 cm3 min−1). O2-TPD was also carried out (15 cm3 min−1 of He, 10 K min−1, 80–600 °C, 10 min at 600 °C) over 52–56 mg of sample after heating (up to 600 °C, plateau 10 min) and cooling down (80 °C) in the presence of 1.0 vol% N2O/He (30 cm3 min−1).
The redox properties of the mixed metal oxides were studied by the temperature-programmed reduction (H2-TPR) using Quantachrome ChemBET Pulsar TPR/TPD. H2-TPR runs for the samples (50 mg) were carried out starting from room temperature to 1000 °C, with a linear heating rate of 10 °C min−1 and in a flow of 5.0 vol% H2/Ar (25 cm3 min−1). Water vapour was removed from the effluent gas by the means of a cold trap placed in an ice-water bath. The H2 consumption was detected and recorded by a TCD detector.
2.3. Catalytic tests
Steady-state catalytic measurements of N2O decomposition were performed in an integral fixed bed stainless steel reactor of 5 mm internal diameter in the temperature range of 300–450 °C under atmospheric pressure. The space velocity (SV) of 30 or 60 l g−1 h−1 (20 °C, 101325 Pa) was applied. The inlet gas contained 0.1 vol% of N2O in N2 as balance. O2 (5.0 vol%) and H2O (2.5 vol%) were added to feed in order to simulate real waste gas from nitric acid plants. Before the first catalytic run, the catalyst was pre-treated in N2 flow at 450 °C for 1 h. Then the catalyst was cooled to the reaction temperature, the steady-state of N2O concentration level was measured and used for calculation of N2O conversion. An infrared analyser N2O (GMS 810 Series Sick) was used to analyse N2O. The conversion of N2O (X(N2O)) was determined according to X(N2O) = ([c(N2O)in − c(N2O)out]/c(N2O)in) × 100%, where: c(N2O)in and c(N2O)out – concentration of N2O in the inlet gas, and concentration of N2O in the outlet gas.2.4. In situ experiments
The X-ray absorption spectra (XAS) of selected mixed metal oxides were performed in situ using the quartz capillary flow reactor cells, and gas delivery systems available on the beamline, on station B18 at the Diamond Light Source synchrotron facility. The measurements were carried out using a Si (111) monochromator at the Cu K-edge, Cu foil (10 μm) was used as an energy calibrant. The catalyst diluted with SiO2 (1![[thin space (1/6-em)]](https://www.rsc.org/images/entities/char_2009.gif) :
:![[thin space (1/6-em)]](https://www.rsc.org/images/entities/char_2009.gif) 5) was sieved into 0.200–0.250 mm and placed into the capillary reactor (with an internal diameter of 3 mm). Prior to the reaction, the catalyst was outgassed at 600 °C for 1 h in a flow of pure He (10 cm3 min−1), and subsequently cooled down to 100 °C. The reactant concentrations at the reactor inlet were composed of [N2O] = 0.1 vol% and [He] = 99.9 vol% (10 cm3 min−1). The temperature was raised in steps of 50–100 °C up to 450 °C and each temperature was held for 30 min. X-ray absorption spectra at Cu K-edge for all the samples were collected in transmission with the exception of the catalyst with Cu/Al = 60/30, mol. ratio, which was collected in fluorescence mode. At least 3 spectra for each sample were taken at room temperature, appropriate temperatures and after reaction at room temperature. CuO reference was measured at room temperature in pellet form. (The data were analysed using the Demeter software package11,12).
5) was sieved into 0.200–0.250 mm and placed into the capillary reactor (with an internal diameter of 3 mm). Prior to the reaction, the catalyst was outgassed at 600 °C for 1 h in a flow of pure He (10 cm3 min−1), and subsequently cooled down to 100 °C. The reactant concentrations at the reactor inlet were composed of [N2O] = 0.1 vol% and [He] = 99.9 vol% (10 cm3 min−1). The temperature was raised in steps of 50–100 °C up to 450 °C and each temperature was held for 30 min. X-ray absorption spectra at Cu K-edge for all the samples were collected in transmission with the exception of the catalyst with Cu/Al = 60/30, mol. ratio, which was collected in fluorescence mode. At least 3 spectra for each sample were taken at room temperature, appropriate temperatures and after reaction at room temperature. CuO reference was measured at room temperature in pellet form. (The data were analysed using the Demeter software package11,12).
IR spectra were recorded with a Tensor 27 Bruker spectrometer equipped with an MCT detector. Prior to FTIR studies selected mixed metal oxides were pressed into the form of self-supporting wafers (ca. 5–10 mg cm−2) and pretreated in situ in a homemade quartz IR cell at 400 °C under vacuum conditions for 1 h. The spectral resolution was 2 cm−1. Sorption of N2O was performed at room temperature. Next, the N2O contacted sample was heated to 330, 390, and 450 °C, kept at this temperature for 2 min and cooled down to room temperature, while collecting the spectrum.
3. Results and discussion
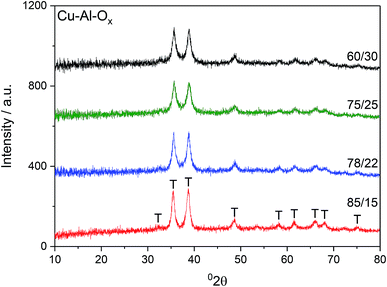
Fig. 1 shows X-ray diffractograms of the Cu–Al–Ox mixed metal oxides. The reflections at 2θ of about 36 and 39° revealed the formation of CuO.13 Besides the diffraction peaks ascribed to CuO, the XRD peak attributable to CuAl2O4 at 37° 2θ may not be excluded.14 The comparison of the intensities of XRD reflections showed that the crystallinity of the materials did not vary significantly. The average CuO crystal sizes calculated using Scherrer's equation for (111) reflection were in the range of 14–21 nm, as listed in Table 1. Cu/Al molar ratios for mixed metal oxides were confirmed by elemental analysis and varied to some extent with respect to the desired ratios (Table 1). In particular, Cu/Al molar ratios were significantly lower than expected from synthesis for materials with Cu/Al > 3.0, mol. ratio. The chemical analysis identified by ICP-MS evidenced sodium residual from the preparation procedure up to 1.1 wt% for Cu/Al = 78/22, mol. ratio.| Cu–Al–Ox | CuO particle sizea/nm | Cu/Al molar ratio | Cu/wt% | Na content/wt% | SBET/m2 g−1 | H2 uptakec/mmol g−1 | O2(des)d/μmol g−1 (e/f/g) | |
|---|---|---|---|---|---|---|---|---|
| Theoretical | Determinedb | Determinedb | ||||||
| a Estimated by the Scherrer's formula for (111) reflection.b Determined with ICP-MS analysis.c Calculated by the equation: Y = 9 × 10⁻⁹X + 2 × 10⁻⁷, R2 = 0.9996, and X, Y referred to the area of each reduction peak and the H2 consumption, respectively.d Estimated from direct O2-TPD of known amount of as-stored Ag2O (Stream Chemicals). O2 desorbed during O2-TPD for pretreated materials under reconstituted air (20.0 vol% O2/80.0 vol% N2), (e), and subsequently reoxidised by 1.0 vol% N2O/He (f), or for pretreated materials under 1.0 vol% N2O/He (g). | ||||||||
| 60/30 | 15 | 2.00 | 2.29 | 48.4 | 0.6 | 84 | 7.8 | 46.9/27.3/36.3 |
| 75/25 | 14 | 3.00 | 3.06 | 55.0 | 1.0 | 68 | 8.4 | 32.1/24.9/25.1 |
| 78/22 | 17 | 3.55 | 3.11 | 41.8 | 1.1 | 70 | 9.4 | 30.1/17.5/17.5 |
| 85/15 | 21 | 5.67 | 4.65 | 51.3 | 0.5 | 34 | 9.4 | 26.2/17.5/14.3 |
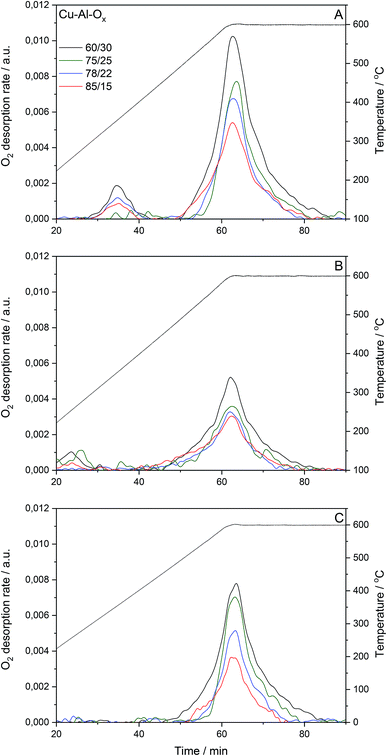
Cu–Al–Ox mixed metal oxides show specific surface area (SBET) in the range of 34–84 m2 g−1. SBET varied between materials with different molar ratios. While no correlation existed between copper content (wt%) and specific surface area, the specific surface area increased with decreasing Cu/Al molar ratio. Fig. 2 presents O2 desorption rates evaluated for the pretreated materials under reconstituted air and subsequently reoxidized by 1.0 vol% N2O/He, or for pretreated materials under 1.0 vol% N2O/He. The O2-TPD profiles of Cu–Al–Ox mixed metal oxides showed peaks related to the desorption of surface oxygen species around 150–400 °C, whilst the peak above 400 °C is attributed to the desorption of lattice oxygen.15 The O2-TPD profiles are dominated by high-temperature peaks (Table 1), indicating that the increasing Cu/Al molar ratios decreased the molar amount of desorbed lattice oxygen. Also, the presence of copper in CuxCo3−xO4 led to a lower amount of desorbed O2 compared to Co3O4.16 Nevertheless, the quantity of oxygen desorbed seems to increase with the specific surface area. It should be emphasized that the amount of oxygen desorbed per gram of catalyst is negligible compared to the amount of oxygen consumed by hydrogen during the TPR (see below H2-TPR results). This point seems to indicate that the desorbed oxygen comes rather from the surface of the material.
The H2-TPR profiles of Cu–Al–Ox mixed metal oxides revealed one main broad peak between 200 and 400 °C corresponding to the reduction of bulk copper oxide species to metallic copper, as shown in Fig. 3. The shape of peak maxima and H2 uptake (Table 1) obtained for mixed metal oxides matched to that of pure CuO (maximum at about 350 °C, H2 uptake of 10.7 mmol g−1). According to the XRD analysis, the peaks associated with the CuO were the main peaks observed in the mixed metal oxides. Otherwise, for Cu75Al25Ox and Cu60Al30Ox the reduction of copper in CuAl2O4 cannot be excluded. A quantitative analysis of H2 consumption based on integrating the H2-TPR curves confirmed that H2 uptake did not change significantly over mixed metal oxides (7.8–9.4 mmol g−1).
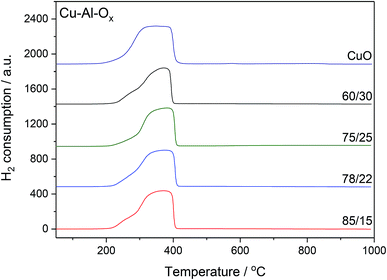 | ||
| Fig. 3 H2-TPR profiles of Cu–Al–Ox mixed metal oxides; experimental conditions: mass of the catalysts = 30 mg; [H2] = 5.0 vol%, Ar balance, flow rate = 25 cm3 min−1, linear heating of 10 °C min−1. | ||
Fig. 4 shows the results of N2O decomposition over Cu–Al–Ox mixed metal oxides with varying Cu/Al molar ratios. The effect of sample composition on the activity was studied to find the optimum materials for maximum conversion. The highest activity among the tested catalysts reached material with a molar ratio Cu/Al = 60/30 (conversion of 25% at 450 °C). The other catalysts reached significantly lower activities (below 20% at 450 °C). Comparable results were obtained by Kannan,9 who found a conversion of 48% at 450 °C over Cu–Al–Ox (Cu/Al = 3/1 mol. ratio, 0.1 g catalyst, 0.0985 vol% N2O/He, 100 cm3 min−1). The most active material was also tested in simulated waste gas conditions – in the presence of 5.0 vol% O2 and 2.0 vol% H2O. O2 present in the feed caused a steep drop in conversion; what is important, the inhibiting effect was fully reversible. The stepwise addition of H2O (results not shown) had a detrimental effect on N2O conversion probably due to the strong adsorption of the water molecule on the surface, since the initial activity in inert gas was not fully recovered after removal of O2 and H2O. Table 2 lists examples of Cu-containing catalyst tested for N2O decomposition. It can be found that either (supported) copper oxide or hydrotalcite derived mixed metal oxides are inherently not active in deN2O. Further modification of Cu-containing material with noble/rare earth metals can significantly improve their catalytic activity [e.g. ref. 1 and 9].
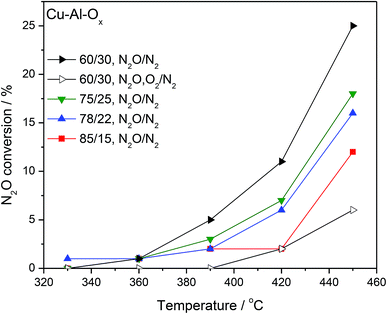 | ||
| Fig. 4 Results of catalytic tests performed for Cu–Al–Ox mixed metal oxides; experimental conditions: [N2O] = 0.1 vol%, ([O2] = 5.0 vol%), N2 balance, SV = 60 l g−1 h−1. | ||
| Catalyst code/Composition | Reaction conditions | Temp. for N2O conversion | Ref. |
|---|---|---|---|
| Copper oxide, supported copper oxide | |||
| CuO commercial | 0.5 vol% N2O/He, SV = 6 l g−1 h−1 | 400 °C/<5% | 3 |
| CuO mesoporous | 400 °C/30% | ||
| Cu–Zn/Al2O3, 35 wt% of Cu–Zn | 0.7 vol% N2O/2 vol% O2/N2, GHSV = 7200 h−1 | 480 °C/50% | 4 |
![[thin space (1/6-em)]](https://www.rsc.org/images/entities/char_2009.gif) |
|||
| Hydrotalcite derived mixed metal oxides | |||
| Cu–Al–Ox, Cu/Al = 60/30, mol. ratio | 0.1 vol% N2O/N2, SV = 60 l g−1 h−1 | 450 °C/25% | This study |
| Cu–Al–Ox, Cu/Al = 3/1, mol. ratio | 0.0985 vol% N2O/He, SV = 60 l g−1 h−1 | 450 °C/48% | 9 |
| Cu–Mg–Al–Ox, Cu/Mg/Al = 10/61/29, mol. ratio | 0.5 vol% N2O/4.5![[thin space (1/6-em)]](https://www.rsc.org/images/entities/char_2009.gif) vol% O2/He, SV = 30 l g−1 h−1 vol% O2/He, SV = 30 l g−1 h−1 |
600 °C/100% | 8 |
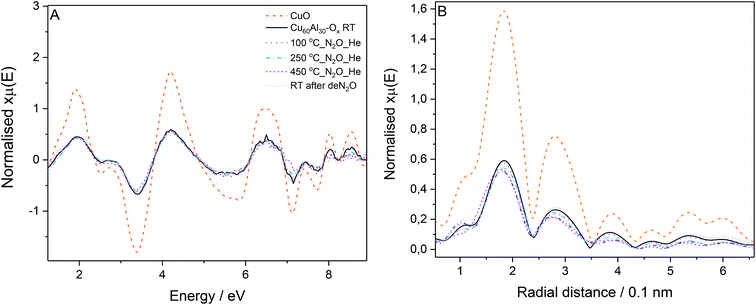
The most active catalyst (Cu/Al = 60/30, mol. ratio) was studied by in situ EXAFS during N2O decomposition. The Cu K-edge absorption spectra were collected: at room temperature, during the temperature ramp (100 to 450 °C) under N2O/He feed, and finally at room temperature after deN2O. The Cu K-edge EXAFS spectra for the catalyst collected at different stages of the experiment (Fig. 5A) presents similar phases as the CuO reference; in line with the XRD results, suggesting CuO as the main species discernible in the samples. The reduced EXAFS oscillation amplitudes in Cu60Al30Ox can be attributed to differences in sample measuring conditions: CuO was measured in pellet form while the catalyst was measured as granulated powder in a microreactor, inhomogeneities and pin-hole effects in the latter case resulted in EXAFS amplitude reduction. No significant changes in the Cu60Al30Ox spectra were observed during activation or N2O exposure indicating the CuO local structure remains constant.
The Fourier transform of the X-ray absorption fine structure (FT-EXAFS) spectra of the catalyst in Fig. 5B gives insight into the distance of neighboring atoms around the absorber atom. The peaks with maxima around 0.19 and 0.29 nm correspond to neighbor O and Cu atoms, respectively. A decrease in peak intensity was observed for the data collected at increasing temperatures. This decrease is attributed to the increasing atom vibration due to thermal effects which smear out the EXAFS oscillations affecting the signal intensity in the Fourier transform. The position of the peaks did not vary significantly throughout the experiment up to 250 °C evidencing no changes in bond distance or local Cu geometry in the sample measured at 450 °C. When the catalyst is active, there seems to be a slight shift to shorter Cu–O distance which could suggest the formation of Cu+. Nonetheless, a definite conclusion cannot be drawn here as no changes were discernible in the position of the rising absorption edge in the XANES to account for Cu2+ reduction to Cu+.
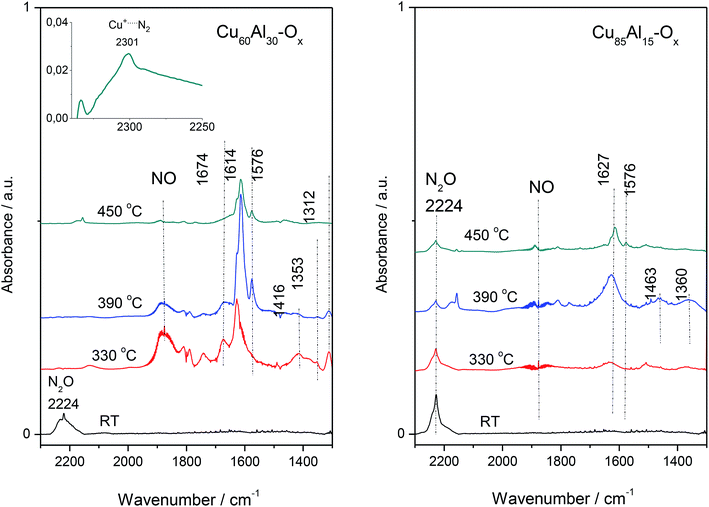
For FT-IR, the selected materials – Cu60Al30Ox and Cu85Al15Ox (the most active and less active sample in deN2O, respectively) studies were contacted with the N2O dose (60 Tr of N2O per 10 mg of the sample) at room temperature, then the IR spectrum was collected (Fig. 6). Next, the catalysts were heated to 330 °C, kept for 10 min and then cooled down to RT to collect IR spectrum of all the reaction products. The procedure was repeated for 390 and 450 °C. An intense absorption band around 2220–2230 cm−1 recorded at room temperature appeared due to adsorbed N2O. In the spectra recorded at higher temperatures, bands appeared below 1700 cm−1 due to the appearance of nitrites, nitrates and nitro compounds. Also, the gaseous NO can be easily identified in the IR spectra due to the vibration-rotation bands at 1950–1850 cm−1. Nitric oxide was found to play a crucial role in the kinetic oscillations caused by a complex interaction of different reactions. Both NO and molecular oxygen can be formed by the decomposition of the residual nitrate species from the catalyst synthesis.17 It is generally accepted that nitrate species on Cu-ZSM-5 and other zeolite catalysts modified with copper are stable even at high temperatures. Furthermore, nitrate moieties have been proposed to be important intermediates in the decomposition of NO,18 the selective catalytic reduction of NO by hydrocarbons,19 and the SCR of NO by ammonia.20 The spectra of Cu–Al–Ox mixed metal oxides were consistent with the formation of bridged nitrates at 1674 cm−1, surface nitrates at 1614 and 1576 cm−1, monodentate nitrates at 1416 cm−1, nitro groups at 1353 cm−1, as well as bidentate nitrates at 1312 cm−1.21,22
For the most active Cu60Al30Ox, the existence of N-species implied a reaction between N2O and copper lattice oxygen. What is more, the formation of end-product of the reaction, i.e. N2 molecule is strongly supported by the presence of 2301 cm−1 band attributed to Cu+⋯N2 complexes. N2 molecule interacting with Cu+ ions inside zeolites leads to a ν(N![[triple bond, length as m-dash]](https://www.rsc.org/images/entities/char_e002.gif) N) band in the 2300–2290 cm−1 region, which is significantly downshifted with respect to gas-phase value of 2321 cm−1. This bathochromic shift could be explained in terms of chemical interactions involving molecular orbitals of the probe molecule and a suitable d-orbital of the metal cation.23 Basing on the wavenumber and half-bandwidth of 2301 cm−1 band identical to the band of Cu+⋯N2 adducts in Cu-zeolites we advocated on the formation of this adducts also in Cu–Al–Ox mixed metal oxides. The presence of stable Cu+⋯N2 complexes indicated the co-presence of both Cu+ and Cu2+ cations on the catalyst surface, as expected for a redox mechanism requiring a balance between these two sites. It is also in line with the CO sorption results on spent material Cu60Al30Ox (spectra not shown) which indicated that the surface Cu is poorer in the Cu2+ cationic species. Such observation allows for concluding on the efficient catalyst which should be characterized by the high redox ability to reduce Cu2+/Cu+ redox pair. Furthermore, in this particular case, Cu+ cations are not able to efficiently transform back to a Cu2+ state. The poorest activity of Cu85Al15Ox was evidenced as no completed decomposition of N2O (the 2224 cm−1 band) could be achieved even at a temperature as high as 450 °C (Fig. 6).
N) band in the 2300–2290 cm−1 region, which is significantly downshifted with respect to gas-phase value of 2321 cm−1. This bathochromic shift could be explained in terms of chemical interactions involving molecular orbitals of the probe molecule and a suitable d-orbital of the metal cation.23 Basing on the wavenumber and half-bandwidth of 2301 cm−1 band identical to the band of Cu+⋯N2 adducts in Cu-zeolites we advocated on the formation of this adducts also in Cu–Al–Ox mixed metal oxides. The presence of stable Cu+⋯N2 complexes indicated the co-presence of both Cu+ and Cu2+ cations on the catalyst surface, as expected for a redox mechanism requiring a balance between these two sites. It is also in line with the CO sorption results on spent material Cu60Al30Ox (spectra not shown) which indicated that the surface Cu is poorer in the Cu2+ cationic species. Such observation allows for concluding on the efficient catalyst which should be characterized by the high redox ability to reduce Cu2+/Cu+ redox pair. Furthermore, in this particular case, Cu+ cations are not able to efficiently transform back to a Cu2+ state. The poorest activity of Cu85Al15Ox was evidenced as no completed decomposition of N2O (the 2224 cm−1 band) could be achieved even at a temperature as high as 450 °C (Fig. 6).
The activity varied among the tested materials, however, no clear trend related either to the Cu or Na content became evident. While alkali metals can act as basic centres and significantly influence catalytic activity.24 For example, Obalová et al.25 pointed out that 1.15 wt% of Na introduced by impregnation already slightly enhanced activity of Co4MnAlOx. In our case, Na residual remained after preparation procedure, and actually with lower values than 1.15 wt% (Table 1). At this stage, it is not possible to precisely justify the influence of residual Na on materials catalytic activity in deN2O.
N2O decomposition on Cu–Al–Ox yielded N2 and O2, and the reoxidation of copper side took place with gas phase N2O (eqn (1)):
| Cu* + N2O → Cu*O + N2. | (1) |
| 2Cu*O → 2Cu* + O2. | (2) |
4. Conclusions
In this study, a series of Cu–Al–Ox mixed metal oxides with different molar ratios (Cu/Al = 85/15, 78/22, 75/25, 60/30, mol. ratio) was successfully obtained by coprecipitation, followed by their thermal decomposition. The catalysts were investigated in N2O decomposition confirming that the activity is strongly dependent on the Cu/Al molar ratio. Decreasing the amount of Cu/Al molar ratio in Cu–Al–Ox leads to the most active catalysts in an order as follows (Cu/Al, mol. ratio): 60/30 > 75/25 > 78/22 > 85/15. The highest activity of Cu/Al = 60/30, mol. ratio, systems appeared possibly due to its high oxygen mobility combined with its specific surface. Further research is carried out in order to clarify the promotion effects of alkali and rare earth metals on Cu–Al–Ox mixed metal oxides for N2O decomposition.Conflicts of interest
There is no conflicts to declare.Acknowledgements
The authors acknowledge the Federal Ministry of Education and Research (BMBF) for funding in the frame “Material Innovations” within the research project “Efficient DeNOx-strategies for lean-operated combustion engines“ (BMBF-PTJ FKz 13XP5042A). This work was partially funded by the Excellence Initiative of the German Federal and State Governments in the frame of the Center for Automotive Catalytic Systems Aachen (ACA) at RWTH Aachen University by the Grant No. 2015/18/E/ST4/00191 from the National Science Centre, Poland and by EU structural funding in Operational Programme Research, Development and Education, project No. CZ.02.1.01/0.0/0.0/16_019/0000853 “IET-ER”. The authors acknowledge the Diamond Light Source (project SP14834) for the provision of beamtime on the beamlines B18, and Diego Gianolio for assistance in performing the XAFS measurements.References
- M. Konsolakis, Recent advances on nitrous oxide (N2O) decomposition over non-noble-metal oxide catalysts: catalytic performance, mechanistic considerations, and surface chemistry aspects, ACS Catal., 2015, 5, 6397–6421 CrossRef CAS.
- J. Pérez-Ramírez, Prospects of N2O emission regulations in the European fertilizer industry, Appl. Catal., B, 2007, 70, 31–35 CrossRef.
- Z. Ma, Y. Ren, Y. Lu and P. G. Bruce, Catalytic decomposition of N2O on ordered crystalline metal oxides, J. Nanosci. Nanotechnol., 2013, 13, 5093–5103 CrossRef CAS PubMed.
- R. Zhang, C. Hua, B. Wang and Y. Jiang, N2O decomposition over Cu-Zn/γ-Al2O3 catalysts, Catalysts, 2016, 6, 200 CrossRef.
- K.-W. Yao, S. Jaenicke, J.-Y. Lin and K. L. Tan, Catalytic decomposition of nitrous oxide on grafted CuO/γ-Al2O3 catalysts, Appl. Catal., B, 1998, 16, 291–301 CrossRef CAS.
- Y. Li and J. N. Armor, Catalytic decomposition of nitrous oxide on metal exchanged zeolites, Appl. Catal., B, 1992, 1, L21–L29 CrossRef CAS.
- H. Zhou, Z. Huang, C. Sun, F. Qin, D. Xiong, W. Shen and H. Xu, Catalytic decomposition of N2O over CuxCe1−xOy mixed oxides, Appl. Catal., B, 2012, 125, 492–498 CrossRef CAS.
- L. Chmielarz, M. Rutkowska, P. Kuśtrowski, M. Drozdek, Z. Piwowarska, B. Dudek, R. Dziembaj and M. Michalik, An influence of thermal treatment conditions of hydrotalcite-like materials on their catalytic activity in the process of N2O decomposition, J. Therm. Anal. Calorim., 2011, 105, 161–170 CrossRef CAS.
- S. Kannan, Decomposition of nitrous oxide over the catalysts derived from hydrotalcite-like compounds, Appl. Clay Sci., 1998, 13, 347–362 CrossRef CAS.
- Y. Pan, M. Feng, X. Cui and X. Xu, Catalytic activity of alkali metal doped Cu-Al mixed oxides for N2O decomposition in the presence of oxygen, J. Fuel Chem. Technol., 2012, 40, 601–607 CrossRef CAS.
- M. Newville, IFEFFIT: interactive XAFS analysis and FEFF fitting, J. Synchrotron Radiat., 2001, 8, 322–324 CrossRef CAS PubMed.
- B. Ravel and M. Newville, ATHENA, ARTEMIS, HEPHAESTUS: data analysis for X-ray absorption spectroscopy using IFEFFIT, J. Synchrotron Radiat., 2005, 12, 537–541 CrossRef CAS PubMed.
- J. Zhang, S. Wu, Y. Liu and B. Li, Hydrogenation of glucose over reduced Ni/Cu/Al hydrotalcite precursors, Catal. Commun., 2013, 35, 23–26 CrossRef CAS.
- C. Liang, X. Li, Z. Qu, M. Tade and S. Liu, The role of copper species on Cu/γ-Al2O3 catalysts for NH3-SCO reaction, Appl. Surf. Sci., 2012, 258, 3738–3743 CrossRef CAS.
- A. Klyushina, K. Pacultová, K. Karásková, K. Jirátová, M. Ritz, D. Fridrichová, A. Volodarskaja and L. Obalová, Effect of preparation method on catalytic properties of Co-Mn-Al mixed oxides for N2O decomposition, J. Mol. Catal. A: Chem., 2016, 425, 237–247 CrossRef CAS.
- T. Franken and R. Palkovits, Investigation of potassium doped mixed spinels CuxCo3−xO4 as catalysts for an efficient N2O decomposition in real reaction conditions, Appl. Catal., B, 2015, 176–177, 298–305 CrossRef CAS.
- T. Turek, A transient kinetic study of the oscillating N2O decomposition over Cu-ZSM-5, J. Catal., 1998, 174, 98–108 CrossRef CAS.
- J. Valyon and W. K. Hall, Studies of the surface species formed from nitric oxide on copper zeolites, J. Phys. Chem., 1993, 97, 1204–1212 CrossRef CAS.
- K. Hadjiivanov, D. Klissurski, G. Ramis and G. Busca, Fourier transform IR study of NOx adsorption on a CuZSM-5 DeNOx catalyst, Appl. Catal., B, 1996, 7, 251–267 CrossRef CAS.
- T. Komatsu, T. Ogawa and T. Yashima, Nitrate species on Cu-ZSM-5 catalyst as an intermediate for the reduction of nitric oxide with ammonia, J. Phys. Chem., 1995, 99, 13053–13055 CrossRef CAS.
- T. Weingand, S. Kuba, K. Hadjiivanov and H. Knözinger, Nature and reactivity of the surface species formed after NO adsorption and NO + O2 coadsorption on a WO3-ZrO2 catalyst, J. Catal., 2002, 209, 539–546 CrossRef CAS.
- S. Parres-Esclapez, I. Such-Basañez, M. J. Illán-Gómez, C. S.-M. de Lecea and A. Bueno-López, Study by isotopic gases and in situ spectroscopies (DRIFTS, XPS and Raman) of the N2O decomposition mechanism on Rh/CeO2 and Rh/γ-Al2O3 catalysts, J. Catal., 2010, 276, 390–401 CrossRef CAS.
- S. Bordiga, C. Lamberti, F. Bonino, A. Travert and F. Thibault-Starzyk, Probing zeolites by vibrational spectroscopies, Chem. Soc. Rev., 2015, 44, 7262–7341 RSC.
- M. Jabłońska and R. Palkovits, Nitrogen oxide removal over hydrotalcite-derived mixed metal oxides, Catal. Sci. Technol., 2016, 6, 49–72 RSC.
- L. Obalová, K. Karásková, A. Wach, P. Kustrowski, K. Mamulová-Kutláková, S. Michalik and K. Jirátová, Alkali metals as promoters in Co-Mn-Al mixed oxide for N2O decomposition, Appl. Catal., A, 2013, 462–463, 227–235 CrossRef.
- M.-J. Kim, S.-J. Lee, I.-S. Ryu, M.-W. Jeon, S.-H. Moon, H.-S. Roh and S. G. Jeon, Catalytic decomposition of N2O over cobalt based spinel oxides: The role of additives, Mol. Catal., 2017, 442, 202–207 CrossRef CAS.
| This journal is © The Royal Society of Chemistry 2019 |

