 Open Access Article
Imidazolyl activated carbon refluxed with ethanediamine as reusable heterogeneous catalysts for Michael addition
Wenzhu Liu a,
Jiafu Xiao
 a,
Qiong Xu*a,
Xianxiang Liu
 a,
Sheng Zhongb,
Hua Huangb,
Min Zhengc,
Steven Robert Kirk
 a and
Dulin Yin*a
aNational and Local Joint Engineering Laboratory for New Petro-Chemical Materials and Fine Utilization of Resources, College of Chemistry and Chemical Engineering, Hunan Normal University, 410081, Changsha, China. E-mail: xuqiong@hunnu.edu.cn; dulinyin@126.com; Tel: +86 18942513809 Tel: +86 13808496387
bHunan Changling Petrochemical S & T Developing Co. Ltd, 414012, Yueyang, China
cHunan First Normal University, 410205, Changsha, China
First published on 21st December 2018
Abstract
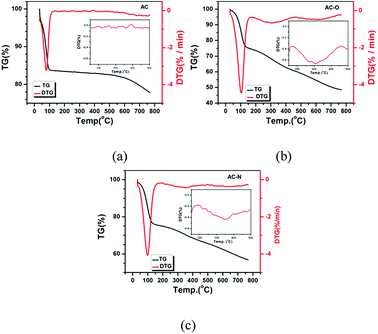
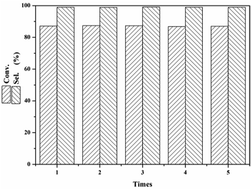
Imidazolyl activated carbon, denoted as AC-N, was prepared via oxidation of AC with HNO3 (AC-O) and then refluxed with ethanediamine under mild conditions. The results showed that the N content of AC-N was 10.3%, and the surface alkali group density of AC-N was 0.96 mmol g−1 from 0.78 mmol g−1 carboxy group of AC-O by Boehm titration. It was revealed that the basic functional groups on the AC-N surface included imidazole and amine groups, from XPS and FT-IR. Evaluated with Michael addition of furfural, the catalytic performance of AC-N showed higher conversion and selectivity than that of commonly used base catalyst such as 2-methylimidazole and KOH. Very remarkably, AC-N showed extraordinary recyclability, in that there was no decline of conversion and selectivity after being recycled 5 times.
1. Introduction
Activated carbon (AC) materials are known to have a highly developed pore structure, large specific surface area, changeable surface chemical characteristics and high surface activity,1,2 and have been widely used in adsorption,3–7 catalysis8,9, electrode materials10, and decoloration,11 etc. It's been believed that the most attractive property of activated carbon materials is their controllable surface properties, with controlled amounts of aromatic rings and oxygen-containing functional groups. Acidic surface sites on AC have usually been generated by treatments in liquid media with oxidative agents such as HNO3,12–14 H2SO4,15 (NH4)2S2O8![[thin space (1/6-em)]](https://www.rsc.org/images/entities/char_2009.gif) 16 and KMnO4.17 An alkali surface of activated carbon is enormously in demand in extensive specific areas and has attracted many researchers' interest. There were a number of studies related to the preparation of activated carbons by steeping or reaction with KOH and NaOH.18–20 Park21 prepared basic activated carbons with coconut shell AC in NaOH solution, and the surface pH was 10.2. Cazetta22 prepared alkaline surface activated carbon by mixing coconut shell char with NaOH and the basic density was 0.73–0.75 mmol g−1.
16 and KMnO4.17 An alkali surface of activated carbon is enormously in demand in extensive specific areas and has attracted many researchers' interest. There were a number of studies related to the preparation of activated carbons by steeping or reaction with KOH and NaOH.18–20 Park21 prepared basic activated carbons with coconut shell AC in NaOH solution, and the surface pH was 10.2. Cazetta22 prepared alkaline surface activated carbon by mixing coconut shell char with NaOH and the basic density was 0.73–0.75 mmol g−1.
In recent years, some meaningful explorations found that an alkaline surface could be constructed by treating activated carbons with ammonia or amines, while the procedures known to make active carbon surfaces basic usually involved treatment under high temperatures. Barbosa23 prepared carbon dots from cow manure and functionalized them with ethylenediamine, affording amide bonds that resulted in bright green fluorescence, which improved cellular selectivity for nucleoli staining. Gao24 prepared a series of mesoporous, N-containing carbon materials directly from pure chitin by means of carbonization at 400–1000 °C enriched with amine, amide, and pyrrolic functionalities. Li25 prepared nitrogen-doped activated carbons utilizing agricultural waste (corncob) as precursor under N2 flow with NH3 as a nitrogen source under 400–600 °C, the N content was 2.97 wt% to 3.98 wt%. Wang26 prepared N-doped hierarchical porous carbon with urea at 180 °C in an autoclave and then immersed in potassium hydroxide solution: in this case, the N content was around 2.5%. Lahaye27 provided activated carbon fibers with a basic surface by treatment with ammonia at 500–800 °C and the N content of the products was 0.94–4.06%. Stöhr28 proposed that amination of activated carbons lead to the formation of NH2 or NH functional groups attached to the carbon rings at 600–900 °C. Park29 prepared mesoporous nitrogen-doped activated carbon with (1-methyl-1H-pyrrole-2-yl)methanol and KOH at 100–850 °C, where the majority of the N was assigned to pyridinic and graphitic nitrogen. Seredych30 explanted amine functional groups on wood-origin activated carbon with oxidation by 50% HNO3 and then treated with melamine and urea followed by carbonization at 950 °C in an inert atmosphere, and the density of basic surface groups was 0.688 mmol g−1. Kan-Nari31 doped nitrogen to activated carbon by treating in a stream of mixture of ammonia and air at temperatures of 400–800 °C and used it as alkaline catalyst in a Knoevenagel condensation and transesterification. Watanabe11 and Fujita32 prepared nitrogen-doped activated carbon via treatments of activated carbon with H2O2 and then ammonia at temperatures of 600–800 °C and the N were pyridine-, pyrrole-, and graphite-type nitrogen species.
Michael reaction with nitroalkanes is one of the most important reactions for formation of a carbon–carbon bond, involving the nucleophilic addition of a carbanion to α,β-unsaturated carbonyl compounds, and is base-catalysed.33 In recent years, a variety of solid base catalysts has been reported, including potassium carbonate,34 amines anchored at surfaces,35 organic resins,36 KF supported on α-Al2O3,37 and KF supported on hydrotalcite.38 A major drawback of some catalysts is that their use resulted in the increased formation of secondary products in the reactions. Reusable of the catalyst has seldom been demonstrated, which represents a severe limitation to its practical use.
In this work, we reported a convenient route (without high temperature and pressure) to construct an alkaline surface from the acidic activated carbon, with large amounts of nitrogen-containing groups, under the refluxed conditions with ethylenediamine at 117 °C, and the catalytic performance and reusable ability of AC-N on Michael additions was studied.
2. Experimental
2.1 Surface modification of activated carbon
In general, 10 g activated carbon was added to 150 mL 12 mol L−1 HNO3 in a three-necked flask connected with a condenser and thermometer, and stirred at 80 °C for 8 hours. After completion of the reaction, the reaction mixture was filtered, washed with water and ethanol, and then dried. The oxidized activated carbon was denoted as AC-O. The AC-O was added into 150 mL ethylenediamine and refluxed at 117 °C for 8 hours. The mixture was filtered, washed with water and alcohol, and then AC-N was prepared after drying.2.2 Sample characterization
2.3 Catalytic performance test
The catalytic performance of AC-N in catalyzing the Michael addition reaction was tested. In general, a certain amount of substrates was added into a three-necked flask equipped with a thermometer and condenser. The effects of different temperature, time, and the catalyst amount on furfural conversion rate and 3-(nitromethyl)-2,3-dihydrofuran-2-carbaldehyde selectivity were investigated. Different catalysts were used for comparation with AC-N in furfural Michael addition, and various substrates were used for testing the applicability of AC-N.3. Results and discussion
3.1 Structure and texture for AC-N
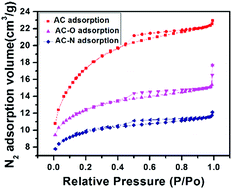
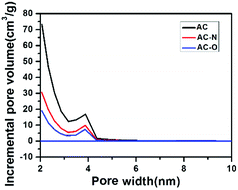
| Samples | cH+ (mmol g−1) | acNA (mmol g−1) | bN content (%) | cN content (%) | BET surface area (m2 g−1) | Pore volume (cm3 g−1) | Pore size (nm) |
|---|---|---|---|---|---|---|---|
| a cNA represents for concentration of alkali site caused with N.b N represents for N content analyzed with XPS.c N represents for N content analyzed with elemental analyzer. | |||||||
| AC | 0.03 | 0.00 | 0.26 | 0.56 | 1286 | 0.77 | 2.4 |
| AC-O | 0.78 | 0.00 | 0.23 | 0.35 | 614 | 0.38 | 2.5 |
| AC-N | 0.00 | 0.96 | 9.38 | 10.3 | 418 | 0.26 | 2.5 |
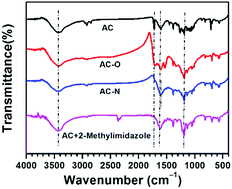
![[double bond, length as m-dash]](https://www.rsc.org/images/entities/char_e001.gif) C stretching that can be attributed to the presence of aromatic rings in AC. After oxidation, the weak peaks around 1260 to 1060 cm−1 disappeared, which indicated that oxidization process destroyed the C
C stretching that can be attributed to the presence of aromatic rings in AC. After oxidation, the weak peaks around 1260 to 1060 cm−1 disappeared, which indicated that oxidization process destroyed the C![[double bond, length as m-dash]](https://www.rsc.org/images/entities/char_e001.gif) C on the AC surface. In all the samples except AC, the broad peak around 1200 cm−1 may be attributed to different functional groups containing single-bonded oxygen atoms such as phenols, ethers, and lactones,6 or single-bonded nitrogen atoms such as C–N, –NH and –NH2.2,7,10 For the sample AC-N, there were no absorption peaks at 1720 and 1600 cm−1, while a new absorption peak appeared at 1604 cm−1, which was attributed to C–N stretching vibration.10 The absorption of the N–H stretching vibration also appeared at around 3400 cm−1, which nearly overlapped with that of O–H stretching. The FT-IR spectra of AC mixed with 2-methylimidazole was indistinguishable from that of AC-N, which indicated that N-containing groups on the surface of AC-N were similar to the structure of 2-methylimidazole.
C on the AC surface. In all the samples except AC, the broad peak around 1200 cm−1 may be attributed to different functional groups containing single-bonded oxygen atoms such as phenols, ethers, and lactones,6 or single-bonded nitrogen atoms such as C–N, –NH and –NH2.2,7,10 For the sample AC-N, there were no absorption peaks at 1720 and 1600 cm−1, while a new absorption peak appeared at 1604 cm−1, which was attributed to C–N stretching vibration.10 The absorption of the N–H stretching vibration also appeared at around 3400 cm−1, which nearly overlapped with that of O–H stretching. The FT-IR spectra of AC mixed with 2-methylimidazole was indistinguishable from that of AC-N, which indicated that N-containing groups on the surface of AC-N were similar to the structure of 2-methylimidazole.
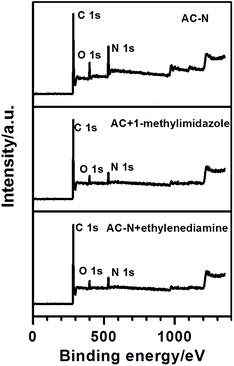
![[double bond, length as m-dash]](https://www.rsc.org/images/entities/char_e001.gif) O (C
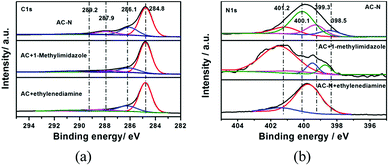
O (C![[double bond, length as m-dash]](https://www.rsc.org/images/entities/char_e001.gif) N) groups,6,29 respectively. For AC-N, the peaks at 286.1 and 287.9 eV were enhanced after the oxidation and amination of AC, which indicated that the surface functional groups changed a little during the treatment of AC. The N1s peaks of AC-doped methyl imidazole mainly consist of three peaks, which were located at 398.7, 399.5 and 401.4 eV, respectively, corresponding to pyridine-type (C–N
N) groups,6,29 respectively. For AC-N, the peaks at 286.1 and 287.9 eV were enhanced after the oxidation and amination of AC, which indicated that the surface functional groups changed a little during the treatment of AC. The N1s peaks of AC-doped methyl imidazole mainly consist of three peaks, which were located at 398.7, 399.5 and 401.4 eV, respectively, corresponding to pyridine-type (C–N![[double bond, length as m-dash]](https://www.rsc.org/images/entities/char_e001.gif) C), pyrrole-type (C–NH–C) and graphite-type nitrogen.9,11,30,31,35 As expected, after modification of AC to AC-N, the corresponding N1s peaks in methylimidazole were shifted 0.2 eV towards the low energy region, which indicated that a certain amount of imidazole structure existed in AC-N. A strong peak appeared at 400.1 eV in AC-N, corresponding to the nitrogen in C–NH2,31 indicating that some of the amino groups in AC-N did not dehydrate to form a ring.
C), pyrrole-type (C–NH–C) and graphite-type nitrogen.9,11,30,31,35 As expected, after modification of AC to AC-N, the corresponding N1s peaks in methylimidazole were shifted 0.2 eV towards the low energy region, which indicated that a certain amount of imidazole structure existed in AC-N. A strong peak appeared at 400.1 eV in AC-N, corresponding to the nitrogen in C–NH2,31 indicating that some of the amino groups in AC-N did not dehydrate to form a ring.
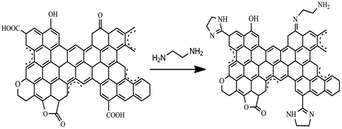
According to the texture and spectrum analysis of AC, AC-O and AC-N, the surface groups of the material were shown as Fig. 7. After oxidation, the content of oxygen-containing functional groups on the AC-O surface was increased, including carboxyl groups, hydroxyl groups, carbonyl groups, lactone groups and so on. After amination treatment, the carboxyl group on AC-O surface reacted with ethylenediamine to form an amide structure, and further dehydration into the ring occurred to form a similar imidazole structure. Part of carbonyl group reacted with ethylenediamine to form an amino group in the surface of AC-N.
3.2 Catalyst performances
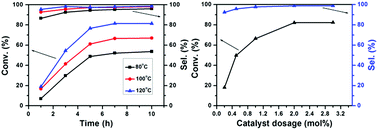
The effects of temperature, time, and catalyst dosage on the conversion of furfural and the selectivity of 3-(nitromethyl)-2,3-dihydrofuran-2-carbaldehyde were investigated. From the results in Fig. 9, it can be seen that the conversion of furfural and the selectivity of 3-(nitromethyl)-2,3-dihydrofuran-2-carbaldehyde were not changed at different temperatures when the reaction time was 7 h. Neither of the conversion and the selectivity changed when the temperature was above 120 °C. Therefore, the reaction conditions were chosen as 120 °C with a reaction time of 7 h. When the amount of catalyst was less than 2.0 mol%, the conversion of furfural and the selectivity of 3-(nitromethyl)-2,3-dihydrofuran-2-carbaldehyde increased with the amount of catalyst. When the amount of the catalyst was more than 2.0 mol%, neither of these was changed.
| Catalysts | Substrates | Time (h) | Conv. (%) | Sel. (%) |
|---|---|---|---|---|
| a Reaction conditions: mol (nitromethane/aldehyde) = 3, catalyst 2 mol%, 120 °C. | ||||
| None | Furfural | 10 | 1 | 70 |
| 2-Methylimidazole | Furfural | 10 | 23 | 77 |
| KOH | Furfural | 10 | 54 | 60 |
| Cs2CO3 | Furfural | 10 | 46 | 62 |
| CaO | Furfural | 10 | 35 | 58 |
| AC-N | Furfural | 7 | 87 | 99 |
| AC-N | Citral | 7 | 93 | 93 |
| AC-N | Crotonaldehyde | 7 | 96 | 99 |
| AC-N | trans-2-Pentenal | 7 | 96 | 99 |
| AC-N | 3-Methyl-2-butenal | 7 | 95 | 97 |
4. Conclusions
A new activated carbon material containing a certain amount of imidazole groups and amine groups on surface was prepared via oxidation using HNO3 and then amination using ethanediamine under atmospheric pressure with activated carbon as a raw material. Compared with the related previously-published research reports, the route reported in this research avoided treatment at high temperature and high pressure. The structure analysis showed that AC-N contained a certain amount of imidazole structure and the results showed that the N content of AC-N was 10.3%. The surface alkali density of the material was 0.96 mmol g−1 and the specific surface area was 418 m3 g−1.As a solid base catalyst, AC-N showed an excellent catalytic performance on the Michael addition reaction of furfural, which was better than that of 2-methylimidazole, a homogeneous alkaline catalyst, and also better than that of inorganic strong base KOH under the same conditions. After 5 cycles, the conversion of furfural remained at around 87% and the selectivity was 99% of 3-(nitromethyl)-2,3-dihydrofuran-2-carbaldehyde, which means excellent stability of the catalyst on furfural for the Michael addition reaction.
Conflicts of interest
There are no conflicts to declare.Acknowledgements
This work was supported by the National Natural Science Foundation of China (No. 21776068 and 21606082), the Scientific Research Fund of Hunan Provincial Education Department (17C0951 and 15B050), Hunan Provincial Innovation Foundation For Postgraduate (No. CX2016B166) and Collaborative Innovation Center of New Chemical Technologies for Environmental Benignity and Efficient Resource Utilization.References
- T. M. Alslaibi, I. Abustan, M. A. Ahmad and A. A. Foul, J. Chem. Technol. Biotechnol., 2013, 88, 1183–1190 CrossRef CAS.
- P. Chingombe, B. Saha and R. J. Wakeman, Carbon, 2005, 43, 3132–3143 CrossRef CAS.
- S. W. Nam, D. J. Choi, S. K. Kim, N. Her and K. D. Zoh, J. Hazard. Mater., 2014, 270, 144–152 CrossRef CAS PubMed.
- S. Haydar, M. A. Ferro-GarcíA, J. Rivera-Utrilla and J. P. Joly, Carbon, 2003, 41, 387–395 CrossRef CAS.
- Y. F. Jia, A. B. Xiao and K. M. Thomas, Langmuir, 2002, 18, 470–478 CrossRef CAS.
- J. P. Chen and S. Wu, Langmuir, 2004, 20, 2233–2242 CrossRef CAS.
- J. W. Shim, S. J. Park and S. K. Ryu, Carbon, 2001, 39, 1635–1642 CrossRef CAS.
- W. Qi and D. Su, ACS Catal., 2014, 4, 415–429 Search PubMed.
- M. Kubota, A. Hata and H. Matsuda, Carbon, 2009, 47, 2805–2811 CrossRef CAS.
- Y. Liu, Z. Hu, K. Xu, X. Zheng and Q. Gao, Acta Phys.-Chim. Sin., 2008, 24, 1143–1148 CrossRef CAS.
- H. Watanabe, S. Asano, S. Fujita, H. Yoshida and M. Arai, ACS Catal., 2015, 5, 2886–2894 CrossRef CAS.
- J. J. Ternero-Hidalgo, J. M. Rosas, J. Palomo, M. J. Valero-Romero, J. Rodríguez-Mirasol and T. Cordero, Carbon, 2016, 101, 409–419 CrossRef CAS.
- N. Wibowo, L. Setyadhi, D. Wibowo, J. Setiawan and S. Ismadji, J. Hazard. Mater., 2007, 146, 237–243 CrossRef CAS.
- R. R. V. A. Rios, D. E. Alves, I. Dalmázio, S. F. V. Bento, C. L. Donnici and R. M. Lago, Mater. Res., 2003, 6, 129–135 CrossRef CAS.
- M. A. Álvarez-Merino, V. López-Ramón and C. Moreno-Castilla, J. Colloid Interface Sci., 2005, 288, 335–341 CrossRef PubMed.
- G. Yadavalli, H. Lei, Y. Wei, L. Zhu, X. Zhang, Y. Liu and D. Yan, Biomass Bioenergy, 2017, 98, 53–60 CrossRef CAS.
- A. A. Daifullah, S. M. Yakout and S. A. Elreefy, J. Hazard. Mater., 2007, 147, 633–643 CrossRef CAS.
- D. Lozano-Castelló, M. A. Lillo-Ródenas, D. Cazorla-Amorós and A. Linares-Solano, Carbon, 2001, 39, 741–749 CrossRef.
- H. Teng and L. Y. Hsu, Ind. Eng. Chem. Res., 1999, 38, 2947–2953 CrossRef CAS.
- T. Otowa, Y. Nojima and T. Miyazaki, Carbon, 1997, 35, 1315–1319 CrossRef CAS.
- S. J. Park and Y. S. Jang, J. Colloid Interface Sci., 2002, 249, 458–463 CrossRef CAS.
- A. L. Cazetta, A. M. M. Vargas, E. M. Nogami, M. H. Kunita, M. R. Guilherme, A. C. Martins, T. L. Silva, J. C. G. Moraes and V. C. Almeida, Chem. Eng. J., 2011, 174, 117–125 CrossRef CAS.
- C. D. E. S. Barbosa, J. R. Corrêa, G. A. Medeiros, G. Barreto, K. G. Magalhaes, A. L. Oliveira, J. Spencer, M. O. Rodrigues and B. A. D. Neto, Chem.–Eur. J., 2015, 21, 5055–5060 CrossRef CAS.
- Y. J. Gao, X. Chen, J. G. Zhang and N. Yan, ChemPlusChem, 2015, 80, 1556–1564 CrossRef CAS.
- B. Li, F. Dai, Q. F. Xiao, L. Yang, J. M. Shen, C. M. Zhang and M. Cai, Energy Environ. Sci., 2016, 9, 102–106 RSC.
- W. Wang, H. Quan, W. Gao, R. Zou, D. Chen, Y. Dong and L. Guo, RSC Adv., 2017, 27, 16678–16687 RSC.
- J. Lahaye, G. Nansé, A. Bagreev and V. Strelko, Carbon, 1999, 37, 585–590 CrossRef CAS.
- B. Stöhr, H. P. Boehm and R. Schlögl, Carbon, 1991, 29, 707–720 CrossRef.
- J. Park, Y. Nabae, T. Hayakawa and M. Kakimoto, ACS Catal., 2014, 4, 3749–3754 CrossRef CAS.
- M. Seredych, D. Hulicova-Jurcakova, Q. L. Gao and T. J. Bandosz, Carbon, 2008, 46, 1475–1488 CrossRef CAS.
- N. Kan-Nari, S. Okamura, S. I. Fujita, J. I. Ozaki and M. Arai, Adv. Synth. Catal., 2010, 352, 1476–1484 CrossRef CAS.
- S. I. Fujita, H. Watanabe, A. Katagiri, H. Yoshida and M. Arai, J. Mol. Catal. A: Chem., 2014, 393, 257–262 CrossRef CAS.
- H. Guo, X. Li, J. L. Wang, X. H. Jin and X. F. Lin, Tetrahedron, 2011, 42, 8300–8303 Search PubMed.
- G. Bosica and K. Polidano, J. Chem., 2017, 2017, 6267036 Search PubMed.
- A. Corma, S. Iborra, I. Rodriguez, M. Iglesias and F. Sanchez, Catal. Lett., 2002, 82, 237–242 CrossRef CAS.
- R. Ballini, P. Marziali and A. Mozzicafreddo, J. Org. Chem., 1996, 61, 3209–3211 CrossRef CAS.
- J. M. Clacens, D. Genuit, L. Delmotte, A. G. Ruiz, G. Bergeret, R. Montiel, J. Lopez and F. Figueras, J. Catal., 2004, 221, 483–490 CrossRef CAS.
- B. M. Choudary, B. Kavita, N. S. Chowdari, B. Sreedhar and M. L. Kantam, Catal. Lett., 2002, 78, 373–377 CrossRef CAS.
- I. Ogino, Y. Suzuki and S. R. Mukai, Catal. Today, 2018, 314, 62–69 CrossRef CAS.
- C. L. Mangun, K. R. Benak, J. Economy and K. L. Foster, Carbon, 2001, 39, 1809–1820 CrossRef CAS.
- R. J. J. Jansen and H. V. Bekkum, Carbon, 1995, 33, 1021–1027 CrossRef CAS.
| This journal is © The Royal Society of Chemistry 2019 |

