 Open Access Article
Study on the effect of PolyFR and its FR system on the flame retardancy and foaming behavior of polystyrene
Yaqiao Wangab,
Hanchuan Jiangab,
Jingyue Niab,
Jianze Chenab,
Hongfu Zhouab,
Xiangdong Wang *ab and
Fei Xin
 *ab
*ab
aSchool of Materials and Mechanical Engineering, Beijing Technology and Business University, Beijing 100048, People's Republic of China. E-mail: wangxid@th.btbu.edu.cn; xinfei@th.btbu.edu.cn; Tel: +86 10 6898 3954 Tel: +86 10 6898 5531
bBeijing Key Laboratory of Quality Evaluation Technology for Hygiene and Safety of Plastics, Beijing 100048, People's Republic of China
First published on 21st December 2018
Abstract
A new class of brominated polymeric flame retardant (PolyFR) which is a kind of environmental FR was researched. Hydrotalcite (HT), applied as an environmentally-friendly heat stabilizer for PolyFR, was investigated by thermogravimetric analysis (TGA). It presented the result that no more than 0.15% HT significantly improved the thermal stability during processing but excessive HT would weaken the flame retardancy of PolyFR because of the ability to absorb hydrogen bromide (HBr). Flame-retardant polystyrene (PS) was prepared via mixing PolyFR/BDDP/HT and then introducing inorganic particles such as antimonous oxide (Sb2O3), organo montmorillonite (OMMT) and graphite to study their effect on the PolyFR/BDDP/HT system. The PS foams were prepared by batch foaming of the PS composites. Meanwhile, the combustion properties of PS composites and PS composite foams were characterized by limiting oxygen index (LOI) and vertical flame test (UL-94). The results indicated that the 2.5%PolyFR/2.5%BDDP/0.15%HT/PS composite possessed 25.7% LOI and pass UL-94 V-2 rating, while its foam possessed 30.7% LOI and pass UL-94 V-2 rating. And the addition of Sb2O3, OMMT and graphite reduced the oxygen index and vertical burning performance of PS composites and PS composite foams to different degrees. Otherwise, the flame-retardant (FR) mechanism of each FR system was studied by TGA and cone calorimetry. This revealed that PolyFR/BDDP promoted decomposition and dripping of PS early to remove heat through droplets and released HBr to quench free radicals and dilute combustible gas and oxygen during combustion. These properties of PolyFR/BDDP helped reduce the burning intensity and extinguish the flame through droplets, thereby endowing PS and its foam with better fire-resistant properties. When the addition of Sb2O3, OMMT or graphite improved the thermal stability of PS, they weakened the droplet effect as well. Besides, PS foams were characterized by scanning electron microscopy (SEM). The results indicated PolyFR played an efficient heterogeneous cell nucleation role in the foaming process to reduce average cell size (from 110.5 μm to 38.4 μm) and narrow cell distribution (from 60–160 μm to 20–60 μm).
1. Introduction
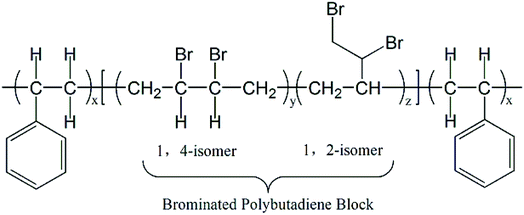
Polystyrene foams, as the second largest segment of the foam market, have been widely used in many applications in the field of thermal insulation because of their outstanding thermal insulation properties and compressive strength.1–6 But PS foam is an extremely flammable material; the LOI value of PS foam is only about 18% and has no UL-94 rating.7 Therefore, research on flame-retardant PS foam is necessary. Hexabromocyclododecane (HBCD), a traditional flame retardant of polystyrene foam, which can endow PS with excellent flame-retardant performance at a typical loading between 0.8 and 4.0 wt% (ref. 8) has been identified to be a kind of PBT (persistence, bioaccumulation, toxicity) substance and would be gradually replaced on a global scale.9–11In recent years, many kinds of non-halogen and halogen flame retardant PS composites had been studied.8,12 Some systems had been applied to flame retardant PS and PS foam, such as nitrogen phosphorus flame retardants and intumescent flame retardants.7,13–18 Besides organic flame-retardant additives, inorganic flame-retardant additives including layered double hydroxide of zinc aluminum and zinc magnesium19 carbon nanotubes20 and nanoclays,21–23 can also effectively reinforce flame-retardant properties of PS and PS foam. But in order to attain outstanding flame-retardant properties, the content of flame retardants is usually more than 20 wt%.8,24 However, such a large amount of flame retardants addition will have an adverse effect on the foaming properties of PS.8 As for halogen flame retardants, such as brominated polystyrene (BPS), decabromodiphenyl ethane (DBDPE) and tetrabromobisphenol A bis (2,3-dibromopropyl)ether (BDDP) with Sb2O3 which may be environmentally friendly brominated flame retardants for no production of dioxin during burning and have been commercialized were also studied.25–29 However, at least 10 wt% of BPS, DBDPE or BDDP should be mixed with PS or PS foam to acquire excellent flame retardancy.27–29 Therefore, the flame retardants which has high efficiency and low addition still need to be researched for meeting requirements for foaming properties. Recently, as in Scheme 1 a kind of brominated polymer flame retardant (PolyFR) which exhibits better environmental friendliness than that of HBCD was reported,30–32 in which only 3–5 wt% PolyFR in PS or PS foam can exert excellent flame-retardant effect.33
Mark W. Beach has studied on the mechanism of flame retardant of PolyFR and found that PolyFR has the similar flame retardant mechanism to HBCD in PS blends where both produce hydrogen bromide (HBr) to exert flame retardant effect in gas phase and both produce enhanced degradation of polymers as another important way to exert flame retardant effect in condensed phase.33–36 It can also be fined tuned to provide very good thermal stability where a higher level of brominated 1,2 units (relative to 1,4 units) in the polybutadiene portion provides better thermal stability. Addition of the styrene blocks to form the triblock structure gives a more compatible interface and many smaller domains.33 This increases the interface of dispersed phase which intends to lead to better cell morphology. What's more, PolyFR was an environmentally sustainable alternative to HBCD which has been demonstrated by the environmental health and safety (EH&S) evaluation.30 The physical chemical properties of PolyFR, namely its high molecular weight, indicated it would possess very low bioavailability and intrinsic toxicity. The results of the environmental fate and ecological toxicity testing demonstrated that PolyFR does not pose the health and environmental issues, such as bioaccumulation and toxicity, which are associated with HBCD.30
As a new flame retardant, PolyFR is environment-friendly, there are few reports about the effect of combination of PolyFR and other flame-retardant additives in PS or PS foams. So it is necessary for PolyFR to blend with other flame retardants additives to study their combined action. Besides, the study may reduce the costs. In addition, PolyFR would degrade in the process of blending PolyFR with PS in the torque rheometer and twin-screw extruder. Therefore, an efficient heat stabilizer is needed for PolyFR to adapt to different processing conditions.
In this paper, the flame-retardant PS composites and their foams were prepared via blending the flame-retardant PolyFR/BDDP with PS. Furthermore, the flame retardancy of PS composites and their foams were researched; the FR mechanism of PolyFR/BDDP was also illuminated. Besides, HT as heat stabilizer to PolyFR was used in flame-retardant system. At the same time, the effect of Sb2O3, OMMT and graphite on PolyFR/BDDP/HT system was studied.
2. Experimental
2.1 Materials
(1) Polystyrene (158 K) was purchased from BASF-YPC Co., Ltd; (2) brominated polybutadiene–polystyrene (PolyFR-122P) which has a typical 65% bromine content was purchased from Bromine Compounds Limited; (3) tetrabromobisphenol A bis (2,3-dibromopropyl)ether (HT-107) was purchased from Jinan Taixing Fine Chemicals Co., Ltd; (4) organo montmorillonite (DK1) was purchased from Zhejiang Fenghong New Material Co., Ltd; (5) graphite (S1) was purchased from Qingdao Ruisheng Graphite Co., Ltd.; (6) hydrotalcite (HYCITE®713) was purchased from Kelaien Chemical Co., Ltd; and (7) antimonous oxide was purchased from Sinopharm Chemical Reagent Co., Ltd.2.2 Sample preparation
In order to investigate thermal stabilization of HT on PolyFR, mixed powder was prepared by mixing and grinding PolyFR and HT with various weight ratios, the formulas were presented in Table 2. The FR PS composites were prepared via mixing PolyFR and HT into PS with different mass ratios. PS, PolyFR and HT were blended by torque rheometer at 190 °C for 10 min. (In the process of extrusion foaming, flame retardants will be heated to melt about 10 min at 190 °C.) Then, the flame-retardant PS composites were compressed to the required sheets with standard dimensions in the mold. The formulas were presented in Table 3. The PolyFR/BDDP/HT mixed Sb2O3, OMMT or graphite were blended into PS to prepare FR PS composites by the same process, the formulas were presented in Table 4. Some abbreviations and acronyms in the article were listed in Table 1.| Full name | Abbreviations |
|---|---|
| Polystyrene | PS |
| Hydrotalcite | HT |
| PolyFR | P |
| BDDP | B |
| Sb2O3 | S |
| OMMT | O |
| Graphite | G |
| Sample | PolyFR (wt%) | HT (wt%) |
|---|---|---|
| PolyFR | 100 | 0 |
| HT5%/PolyFR | 95 | 5 |
| HT10%/PolyFR | 90 | 10 |
| Sample | PS (wt%) | PolyFR (wt%) | HT (wt%) |
|---|---|---|---|
| P/PS | 95 | 5 | — |
| HT0.05%/P/PS | 94.95 | 5 | 0.05 |
| HT0.15%/P/PS | 94.85 | 5 | 0.15 |
| HT0.25%/P/PS | 94.75 | 5 | 0.25 |
| HT0.35%/P/PS | 94.65 | 5 | 0.35 |
| HT0.45%/P/PS | 94.55 | 5 | 0.45 |
| HT0.55%/P/PS | 94.45 | 5 | 0.55 |
| HT0.65%/P/PS | 94.35 | 5 | 0.65 |
| HT0.75%/P/PS | 94.25 | 5 | 0.75 |
| HT0.85%/P/PS | 94.15 | 5 | 0.85 |
| HT0.95%/P/PS | 94.05 | 5 | 0.95 |
| HT1.05%/P/PS | 93.95 | 5 | 1.05 |
| Sample | PS (wt%) | PolyFR (wt%) | BDDP (wt%) | HT (wt%) | Sb2O3 (wt%) | OMMT (wt%) | Graphite (wt%) |
|---|---|---|---|---|---|---|---|
| PS | 100 | — | — | — | — | — | — |
| P5%/HT/PS | — | 5 | 0.15 | — | — | — | |
| P3.5%/B1.5%/HT/PS | — | 3.5 | 1.5 | 0.15 | — | — | — |
| P2.5%/B2.5%/HT/PS | — | 2.5 | 2.5 | 0.15 | — | — | — |
| P1.5%/B3.5%/HT/PS | — | 1.5 | 3.5 | 0.15 | — | — | — |
| P2.5%/B2.5%/S0.8%/HT/PS | — | 2.5 | 2.5 | 0.15 | 0.8 | — | — |
| P2.5%/B2.5%/S1.6%/HT/PS | — | 2.5 | 2.5 | 0.15 | 1.6 | — | — |
| P2.5%/B2.5%/O1%/HT/PS | — | 2.5 | 2.5 | 0.15 | — | 1 | — |
| P2.5%/B2.5%/O2%/HT/PS | — | 2.5 | 2.5 | 0.15 | — | 2 | — |
| P2.5%/B2.5%/G1%/HT/PS | — | 2.5 | 2.5 | 0.15 | — | 1 | |
| P2.5%/B2.5%/G2%/HT/PS | — | 2.5 | 2.5 | 0.15 | — | 2 |
2.3 Batch foaming
Batch foaming method was applied to prepare the FR PS composite foams in autoclave and sc-CO2 was used as physical blowing agent. All of foams were prepared under the same condition to research the discrepancies of foaming behaviors for PS composites. First, the FR PS composites were placed in the autoclave at 130 °C and 12 MPa for 3 h to saturation. After the CO2 got adequate saturation in the PS melt, an instant pressure drop was exerted on the samples by discharge of CO2 to ambient pressure at even pressure drop rate of 3 MPa s−1. At last, the FR PS composite foams were shaped for further characterization.2.4 Characterizations
 | (1) |
 | (2) |
3. Results and discussion
3.1 Thermal stability of PolyFR
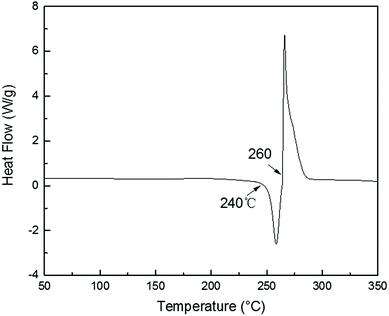
TGA curves of PolyFR shown in Fig. 2 indicated that its initial degradation (0.5% mass loss) temperature was about 243.1 °C. From DSC curve of PolyFR in Fig. 1, there was no obvious peaks in DSC observed before 240 °C indicating that no obvious crosslinking that could be caused by leftover double bonds from the PB occurred before degradation of PolyFR. The endothermic peak began to appear when the temperature reached 240 °C indicating that PolyFR began to decompose and release HBr when the temperature reached 240 °C. The similar result was observed in the TGA curve of PolyFR. The exothermic peak began to appear when the temperature reached 260 °C indicating that crosslinking did happen in the process of PolyFR degradation. The color of sample P5%/PS without HT had turned black after blending in a torque rheometer at 190 °C for 10 min shown in Table 7. This showed that PolyFR had been decomposed in this processing condition without any thermal stabilizer. The result was different from what we got from the TGA analysis curves of PolyFR in Fig. 2, in which the initial decomposing temperature was 243.1 °C more than the actual processing temperature. This was due to PolyFR would be affected by shear stress and thermal oxidative degradation in practice compared to TG test. So we used HT as the thermal stabilizer for PolyFR in the subsequent experiments.| Sample | PolyFR | HT5%/PolyFR | HT10%/PolyFR |
|---|---|---|---|
| Maximum decomposition (%) | 50.6 | 19.3 | 17.2 |
| Maximum decomposition rate (% min−1) | 6.36 | 1.55 | 1.49 |
3.2 Thermal stabilization of HT on PolyFR
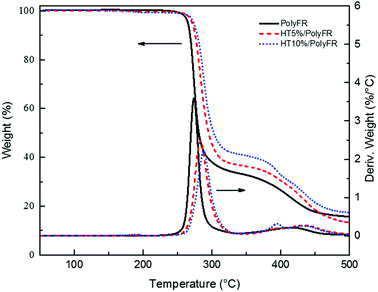
In order to testify thermal stabilization of HT on PolyFR, TGA of PolyFR and HT mixed powders were tested. Their TGA curves under N2 atmosphere were shown in Fig. 2 and Table 5.As shown in Fig. 2 and Table 5, when the samples were heated from 50 °C to 500 °C at a heating rate of 10 °C min−1, PolyFR with 5% or 10% HT had the higher onset decomposing temperature and lower maximum decomposing rate than pure PolyFR powder. The acid production HBr from decomposed PolyFR may promote the early degradation of PolyFR like the autocatalytic degradation of the polyvinylchloride because of the similar structure.38–40 HT as a kind of acid absorber has the basic properties that make it possible to absorb HBr formed during thermal dehydrobromination of PolyFR, and thus inhibit the degradation of the PolyFR.41–43
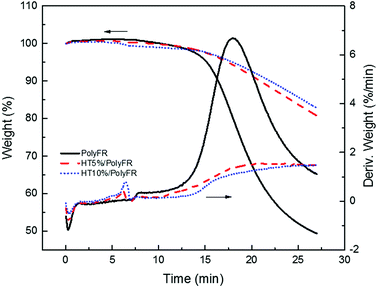
As shown in Fig. 3 and Table 6, the samples were heated from 50 °C to 240 °C at a heating rate of 30 °C min−1 and kept for 20 min. Pure PolyFR decomposing rate and decomposing amount increased sharply starting from 13th minute. When incorporating 5% HT to pure PolyFR, the maximum decomposing rate of mixed powder was decreased from 6.36% min−1 to 1.55% min−1 and the decomposing amount from 50.6% to 19.3%. It was further evidence the thermal stabilization of HT on PolyFR was remarkable. But when HT content was increased to 10%, the effect didn't have an obvious improvement. Because 5% HT may absorb most HBr formed during thermal dehydrobromination of PolyFR, excessive HT won't obviously improve the thermal stability of PolyFR.
To explore the thermal stabilization of HT on PolyFR in practice, the colors of samples were listed in Table 7. The colors of P/PS and HT0.05%/P/PS are black, because the content of HT in the samples is not enough to absorb most HBr formed during thermal dehydrobromination of PolyFR to inhibit the autocatalytic degradation of PolyFR which leading to their severe degradation. The radicals from degradation of PolyFR enhanced the chain scission of PS which contained tertiary carbon atoms in the backbone more easily.33,36 With the increase of the HT content, the degradation of PolyFR was weakened and the colors of samples with more than 0.15% HT turned into white.
3.3 Effect of HT on flame retardancy of PolyFR
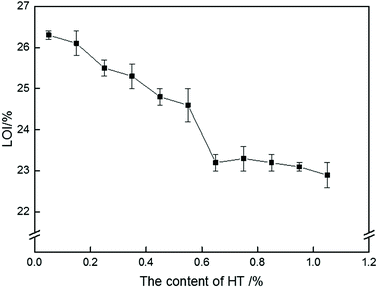
To explore the effect of HT on the flame retardancy of PolyFR, the LOI values of samples were carried out in Fig. 4. LOI values of PS composites were gradually decreased with the increase of HT content. Because PolyFR releases HBr in the gas phase after degradation. The HBr molecule acts as a radical scavenger of radicals (OH, H) to availably extinguish the flame.28,33,44 As was stated above, HBr released by PolyFR in combustion process would be absorbed by HT leading to HBr didn't work effectively.The addition amount of HT should be as little as possible but on the promise that PolyFR won't degrade severely during processing. By analyzing Fig. 4 and Table 7, the conclusion was that the addition amount of HT should be 0.15% at most for 5% PolyFR. For convenience of analysis, the content of HT in the following study is 0.15%.
3.4 Flame-retardant properties of PS with different PolyFR/BDDP
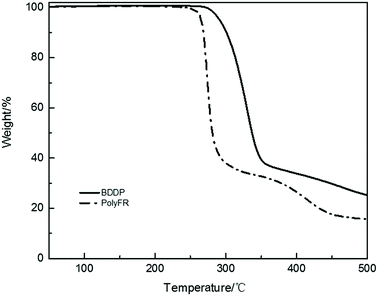
Fire performance data for composites and foams were listed in Tables 8 and 9. Compared with the data from Tables 8 and 9, the LOI value of neat PS is 17.5% and its foam is 18.1%. They all cannot pass UL94 test. After PolyFR/BDDP/HT were incorporated into PS, the flame-retardant properties of PS composites were gradually enhanced. When 5% PolyFR was blended into PS, the LOI value of PS composite was increased from 17.5% to 26.8%, and the UL94 test reached V-2 rating with a shorter combustion time. Corresponding to the PS composite, the LOI value of its foam was also increased from 18.1% to 32.1%, and the UL94 test reached V-2 rating. PolyFR endowed PS with better flame retardancy. With the increase of BDDP content and the decrease of PolyFR content the LOI values of PS composites and their foams decreased gradually. BDDP, a mixed aliphatic/aromatic bromine compound, has the better thermal stability than PolyFR, because aromatic bromine has the better thermal stability than aliphatic bromine as the TGA curves of BDDP and PolyFR shown in Fig. 5. In the process of combustion aromatic bromine released HBr later than aliphatic bromine, leading to aromatic bromine had the worse FR performance than aliphatic bromine.| Sample (resin) | LOI% | av-t1 (s) | av-t2 (s) | Dripping | Ignition | UL94 rating |
|---|---|---|---|---|---|---|
| PS | 17.5 ± 0.3 | >30 | >30 | Yes | Yes | Unrated |
| P5%/HT/PS | 26.8 ± 0.1 | 0.5 | 0.4 | Yes | Yes | V-2 |
| P3.5%/B1.5%/HT/PS | 26.2 ± 0.3 | 0.3 | 0.2 | Yes | Yes | V-2 |
| P2.5%/B2.5%/HT/PS | 25.7 ± 0.2 | 0.4 | 0.4 | Yes | Yes | V-2 |
| P1.5%/B3.5%/HT/PS | 24.5 ± 0.1 | 0.3 | 0.2 | Yes | Yes | V-2 |
| Sample (foam) | LOI% | av-t1 (s) | av-t2 (s) | Dripping | Ignition | UL94 rating |
|---|---|---|---|---|---|---|
| PS | 18.1 ± 0.3 | >30 | >30 | Yes | Yes | Unrated |
| P5%/HT/PS | 32.1 ± 0.3 | 0.4 | 0.3 | Yes | Yes | V-2 |
| P3.5%/B1.5%/HT/PS | 30.9 ± 0.1 | 0.4 | 0.4 | Yes | Yes | V-2 |
| P2.5%/B2.5%/HT/PS | 30.7 ± 0.4 | 0.8 | 0.3 | Yes | Yes | V-2 |
| P1.5%/B3.5%/HT/PS | 28.8 ± 0.2 | 0.9 | 0.2 | Yes | Yes | V-2 |
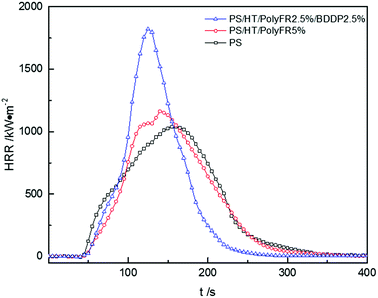
The curves of heat release rate (HRR) tested by cone calorimetry were shown in Fig. 6, and the relevant data were listed in Table 10. Actually, the heat took away by molten droplets in LOI and UL94 test led to incomplete combustion of PS composites, which resulted in a better flame retardant effect in these tests. However, in cone calorimetry test, molten resin was decomposed and burned in a limited space.45 Therefore, PolyFR/BDDP would exhibit a more obvious effect in the LOI and UL94 test than in the cone calorimetry test. Nevertheless, we still derived some properties of PolyFR/BDDP from these data.
| Sample | pk-HRR (kW m−2) | THR (MJ m−2) | av-EHC (MJ kg−1) | av-COY (kg kg−1) | av-CO2Y (kg kg−1) |
|---|---|---|---|---|---|
| PS | 1040 | 146.2 | 33.6 | 0.0197 | 2.901 |
| P5%/HT/PS | 1163 | 141.8 | 34.9 | 0.114 | 2.564 |
| P2.5%/B2.5%/HT/PS | 1821 | 139.9 | 35.9 | 0.139 | 2.944 |
After addition of flame retardants, PS composites reached peak of HRR (pk-HRR) values faster than pure PS and pk-HRR values was higher than pure PS. There are two reasons. First, in the cone calorimetry test, the samples were placed in the fixed container, and the molten resin would be continuously degraded in the container, and the heat was not taken away in time by the droplets, thus a higher peak would be produced. Second, the inducing degradation effect on PS of PolyFR/BDDP produced combustible gas faster leading to concentrated heat release during the combustion process. Although the pk-HRR values of PS composites increased, the values of THR decreased. After replacing 50% PolyFR with BDDP, pk-HRR value caused by burning intensity increased. As mentioned above, the bromine free radical from BDDP didn't quench free radicals of combustion effectively as PolyFR since aromatic bromine had the better thermal stability than aliphatic bromine. According to the outcome from P5%/HT/PS or P2.5%/B2.5%/HT/PS in Table 10, addition of PolyFR and PolyFR/BDDP decreased the total heat release (THR) values compared with pure PS, indicating that PolyFR and BDDP played a better flame-retardant effect in gas phase and led to more incomplete combustion.46 The average of carbon oxide yields (av-COY) and the average of carbon dioxide yields (av-CO2Y) values of samples were listed in Table 10. The av-COY values of all samples increased compared with pure PS. Meanwhile, av-CO2Y values had the reverse tendency. The results further confirmed that PolyFR and BDDP would availably inhibit radical chain reaction in burning process and cause incomplete combustion in gas phase. PS foam with 2.5% PolyFR and 2.5% BDDP still had LOI value of 30.7% and passed UL94 V-2 rating. On this basis, the synergy and antagonism of three kinds of inorganic particles on PolyFR/BDDP/HT system was studied.
3.5 Flame-retardant properties of PS with Sb2O3/PolyFR/BDDP/HT
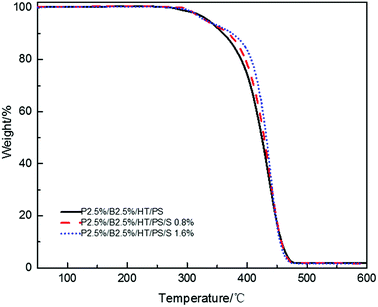
In order to research the effect of Sb2O3 on flame retardancy of PolyFR/BDDP/HT system, the Sb2O3 was incorporated into PolyFR/BDDP/HT/PS composites.Fire performance data for PS composites and their foams were listed in Tables 11 and 12. Compared with the data from Tables 11 and 12, samples no matter foamed or not, the LOI values decreased significantly and the vertical combustion performance decreased slightly with the increase of Sb2O3 content. Because Sb2O3 can promote the production of SbBr3 and HBr earlier by decomposing the bromine compound at lower temperature and HBr will most probably produce the retardant effect rather than SbBr3.28,47 As mentioned above, the aromatic bromine has a higher decomposition temperature than the aliphatic bromine. Therefore, Sb2O3 plays a more important role when combined with the aromatic bromine to advance the release of FR substances, but it has negative effect when combined with aliphatic bromine which decomposition temperature is low because of producing more SbBr3 and less HBr resulting in hindering the dripping effect and flame retardant performance in gas phase at the initial stage of combustion. There was only 1/4 aromatic bromine in the composites, so too much antimony would volatilizes aliphatic bromine as SbBr3 leading to reduce chain scission activity and then droplets which took away heat produced by molecular chain scission activity was weakened. As shown in Fig. 7, in nitrogen atmosphere, all the PS composites with Sb2O3 showed the higher decomposing temperatures compared with the PS composites without Sb2O3 and the thermal stability of PS composites was gradually improved with the increase of Sb2O3 content. As mentioned earlier, the increase of thermal stability would weaken the dripping effect.
| Sample (resin) | LOI% | av-t1 (s) | av-t2 (s) | Dripping | Ignition | UL94 rating |
|---|---|---|---|---|---|---|
| P2.5%/B2.5%/HT/PS | 25.7 ± 0.2 | 0.4 | 0.4 | Yes | Yes | V-2 |
| P2.5%/B2.5%/S0.8%/HT/PS | 25 ± 0.3 | 1.4 | 0.9 | Yes | Yes | V-2 |
| P2.5%/B2.5%/S1.6%/HT/PS | 22.5 ± 0.1 | 2 | 0.9 | Yes | Yes | V-2 |
| Sample (foam) | LOI% | av-t1 (s) | av-t2 (s) | Dripping | Ignition | UL94 rating |
|---|---|---|---|---|---|---|
| P2.5%/B2.5%/HT/PS | 30.7 ± 0.4 | 0.8 | 0.3 | Yes | Yes | V-2 |
| P2.5%/B2.5%/S0.83%/HT/PS | 30.8 ± 0.2 | 0.5 | 0.5 | Yes | Yes | V-2 |
| P2.5%/B2.5%/S1.66%/HT/PS | 26.6 ± 0.3 | 0.7 | 0.6 | Yes | Yes | V-2 |
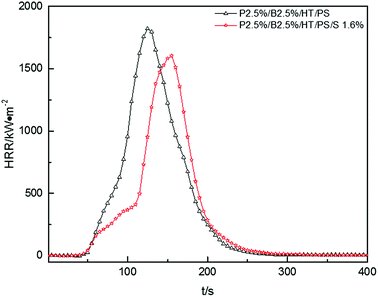
In Fig. 8, pk-HRR values of P2.5%/B2.5%/S1.6%/HT/PS were decreased into lower level than that of P2.5%/B2.5%/HT/PS. Moreover, HRR of P2.5%/B2.5%/S1.6%/HT/PS was suppressed at the initial stage of combustion compared with P2.5%/B2.5%/HT/PS. As mentioned above, in the container the heat was not able to be taken away in time by the droplets, the improvement of thermal stability of PS composites would weaken the combustion intensity of materials.
The av-EHC and THR values of P2.5%/B2.5%/S1.6%/HT/PS had been reduced compared with P2.5%/B2.5%/HT/PS or pure PS from Table 13, indicating that the combustion intensity was suppressed during the whole combustion process and the addition of Sb2O3 resulted in more incomplete combustion which was also evidenced by variation of av-COY and av-CO2Y values. This may reveal that Sb2O3 made the release of FR substance more durable instead of concentrated release. So the addition of Sb2O3 inhibited the dropping effect of PS composites combustion, but Sb2O3 had a synergistic effect with PolyFR/BDDP/HT system to some extent which inhibited the combustion intensity of samples.
| Sample | pk-HRR (kW m−2) | THR (MJ m−2) | av-EHC (MJ kg−1) | av-COY (kg kg−1) | av-CO2Y (kg kg−1) |
|---|---|---|---|---|---|
| P2.5%/B2.5%/S0.83%/HT/PS | 1821 | 139.9 | 35.9 | 0.139 | 2.944 |
| P2.5%/B2.5%/S1.66%/HT/PS | 1604 | 117.2 | 28.8 | 0.158 | 2.317 |
3.6 Flame-retardant properties of PS with OMMT/PolyFR/BDDP/HT
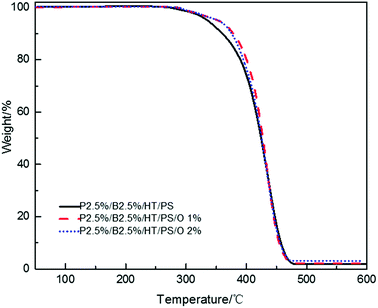
In order to research the effect of OMMT on flame retardancy of PolyFR/BDDP/HT system, the OMMT was incorporated into PolyFR/BDDP/HT/PS composites.The LOI value and the vertical combustion performance decreased significantly with the increase of OMMT content in Table 14. The LOI value of P2.5%/B2.5%/O1%/HT/PS declined sharply to 22% and that of P2.5%/B2.5%/O2%/HT/PS to 20.9% from 25.7%. Simultaneously, the UL94 results of PS composites also exhibited the similar trend. In Table 14, P2.5%/B2.5%/O1%/HT/PS passed UL94 V-2 rating but its self-extinguishing time increasing to 12.5 s from 0.8 s and P2.5%/B2.5%/O2%/HT/PS didn't even pass UL94 V-2 rating. The results showed the existence of antagonism FR effect between PolyFR/BDDP/HT and OMMT. The addition of OMMT improved the thermal stability of PS composites during the process of composites combustion. It is more difficult to produce droplets to take away heat when composites is burned. The slower thermal decomposition of the PS composites with OMMT may be ascribed to the barrier and labyrinth effects of the dispersed silicate layers which hinder diffusion of volatile decomposition products within the PS composites.48,49 TGA tests were conducted and results were illustrated in Fig. 9. PS composites with OMMT showed higher decomposition temperature than PS composites.
| Sample (resin) | LOI% | av-t1 (s) | av-t2 (s) | Dripping | Ignition | UL94 rating |
|---|---|---|---|---|---|---|
| P2.5%/B2.5%/HT/PS | 25.7 ± 0.2 | 0.4 | 0.4 | Yes | Yes | V-2 |
| P2.5%/B2.5%/D1%/HT/PS | 22 ± 0.1 | 12.5 | 3.5 | Yes | Yes | V-2 |
| P2.5%/B2.5%/D2%/HT/PS | 20.9 ± 0.2 | >30 | — | Yes | Yes | Unrated |
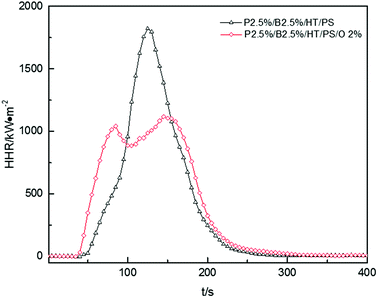
The HRR curves for P2.5%/B2.5%/O2%/HT/PS were shown in Fig. 10. The HRR of P2.5%/B2.5%/O2%/HT/PS exceeded that of P2.5%/B2.5%/HT/PS before 95 s, and then reached a maximum of 1117 kW m−2 after a slight drop. The HRR of P2.5%/B2.5%/HT/PS fell rapidly after reaching a maximum of 1821 kW m−2. Reduction of the HRR peak and weakening of combustion intensity are the typical features of polymer layered silicate nanocomposites, as reported by J. W. Gilman,50 Huaili Qin51 and A. B. Morgan.52 Many studies51,53,54 have shown that the presence of clay nanocomposites promoted carbon formation and carbon with multilayer carbonaceous silicate structure was formed after pyrolysis of composites. This carbonaceous-silicate char will form a protective layer on the surface of the burning composites which isolates the underlying materials and slows the escape of volatile products during the combustion and degradation of composites and the little change of av-EHC, av-COY and av-CO2Y also explained that the improvement in HRR was caused by burning process not in the gas phase. However, carbonaceous-silicate layer not only hindered the spread of volatile products by matrix resin but also by flame retardants. So on the other hand, the addition of OMMT in this system may have a bad effect on flame retardant. As the data listed in Table 15, THR of P2.5%/B2.5%/O2%/HT/PS was a little bigger than that of P2.5%/B2.5%/HT/PS, which indicated that the burning process of P2.5%/B2.5%/O2%/HT/PS intend to produce a longer duration fire.55 So the conclusion was that the addition of OMMT reduced burning intensity while hindering the effect of flame retardants severely in PolyFR/BDDP/HT system.
| Sample | pk-HRR (kW m−2) | THR (MJ m−2) | av-EHC (MJ kg−1) | av-COY (kg kg−1) | av-CO2Y (kg kg−1) |
|---|---|---|---|---|---|
| P2.5%/B2.5%//HT/PS | 1821 | 139.9 | 35.9 | 0.139 | 2.944 |
| P2.5%/B2.5%/D2%/HT/PS | 1117 | 143.8 | 34.4 | 0.141 | 2.728 |
3.7 Flame-retardant properties of PS with graphite/PolyFR/BDDP/HT
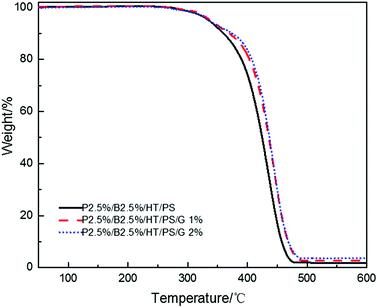
In order to research the effect of graphite of flame retardancy on PolyFR/BDDP/HT system, the graphite was incorporated into PolyFR/BDDP/HT/PS composites.As the data listed in Tables 16 and 17, no matter samples were foamed or not, the LOI value decreased in a small extent and the vertical combustion performance was no change with the increase of graphite content. Graphite is also layered structure just like layered silicates but would not form a similar intercalated-exfoliated structure. When addition of carbon particle, it would form a similar network structure which may impede the release of volatile products and produce barrier effect which can improve the thermal stability of PS composites.56 The study investigated by Bettina Dittrich56 reported that carbon particle worked as anti-dripping agents. TGA tests were conducted and results were illustrated in Fig. 11, the thermal stability of PS composites were improved with the increase of graphite content which weakened the droplet effect leading to the reduction of LOI value.
| Sample (resin) | LOI% | av-t1 (s) | av-t2 (s) | Dripping | Ignition | UL94 rating |
|---|---|---|---|---|---|---|
| P2.5%/B2.5%/HT/PS | 25.7 ± 0.2 | 0.4 | 0.4 | Yes | Yes | V-2 |
| P2.5%/B2.5%/G1%/HT/PS | 25.6 ± 0.3 | 0.5 | 0.3 | Yes | Yes | V-2 |
| P2.5%/B2.5%/G2%/HT/PS | 23.2 ± 0.2 | 0.4 | 0.5 | Yes | Yes | V-2 |
| Sample (foam) | LOI% | av-t1 (s) | av-t2 (s) | Dripping | Ignition | UL94 rating |
|---|---|---|---|---|---|---|
| P2.5%/B2.5%/HT/PS | 30.7 ± 0.4 | 0.8 | 0.3 | Yes | Yes | V-2 |
| P2.5%/B2.5%/G1%/HT/PS | 29.4 ± 0.2 | 0.4 | 0.3 | Yes | Yes | V-2 |
| P2.5%/B2.5%/G2%/HT/PS | 28.6 ± 0.1 | 0.5 | 0.4 | Yes | Yes | V-2 |
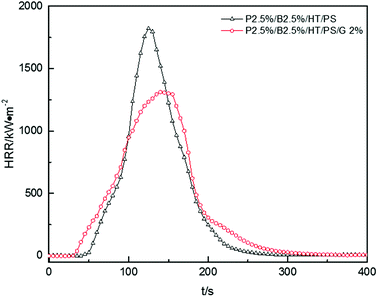
Fig. 12, presented the HRR curves of P2.5%/B2.5%/HT/PS and P2.5%/B2.5%/G2%/HT/PS. The pk-HHR value of P2.5%/B2.5%/G2%/HT/PS was 1312 kW m−2 lower 509 kW m−2 than the value of P2.5%/B2.5%/HT/PS. A residue layer from the carbon particles would be formed during combustion. The dense and stable layer structure on the surface of the burning composites would act as a heat and mass transport barrier which delayed heat conduction to the underlayered material resulted in the better thermal stability of composites, therefore reducing combustion intensity.57 The other data listed in Table 18, such as av-EHC, av-COY and av-CO2Y values had no obvious change indicating the change of combustion performance was mainly caused by condensed phase. However, the change of THR was similar to that of the PS composite with OMMT also indicating a longer duration fire. So the addition of graphite inhibited the dropping effect of PS composites during combustion leading to the LOI value decreased in a small extent, but also inhibited the combustion intensity of samples.
| Sample | pk-HRR (kW m−2) | THR (MJ m−2) | av-EHC (MJ kg−1) | av-COY (kg kg−1) | av-CO2Y (kg kg−1) |
|---|---|---|---|---|---|
| P2.5%/B2.5%/HT/PS | 1821 | 139.9 | 35.9 | 0.139 | 2.944 |
| P2.5%/B2.5%/G2%/HT/PS | 1312 | 144.3 | 35.1 | 0.127 | 2.825 |
3.8 Foaming behavior of various PS composite samples
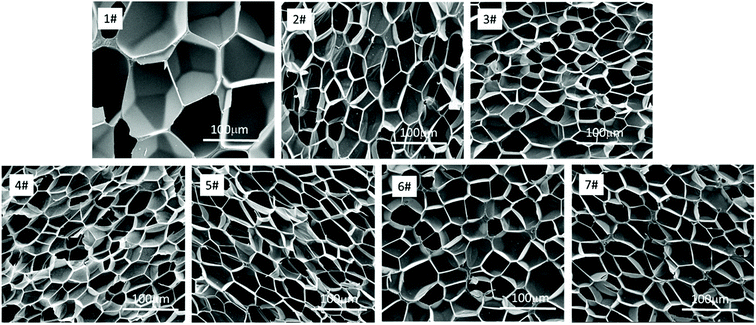
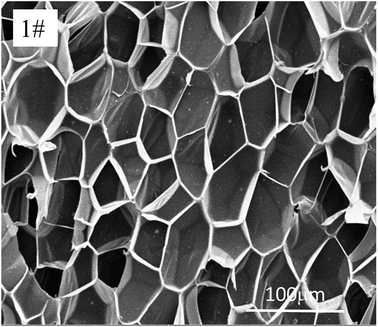
The SEM images of the different PS composite foams and pure PS were shown in Fig. 13, and foaming parameters (cell size, density, expansion ratio, cell density) of all the composite foams were shown in Table 19. It was found that when PolyFR and HT was added into PS, the cell density of foams increased sharply from 0.49 × 10⁸ to 1.29 × 10⁸ cells per cm3, the cell size of PS composite foams (2#) decreased from 110.5 μm to 39.2 μm obviously, the density and the expansion ratio just had a small change. The main reason was that PolyFR was not melted particles at 190 °C and HT was inorganic particle, PolyFR/HT played an efficient heterogeneous cell nucleation role in the foaming process, but the amount of HT was so small that it played a minor role in heterogeneous cell nucleation. A large number of white particles were observed in Fig. 14, indicating that microphase separation on the foam cell surface happened between filler and polystyrene. Compared with homogeneous nucleation, the activation energy of heterogeneous nucleation is lower, which makes it easier to nucleate on the interface of the two polymers.58 Compared with the sample 2#, cell size, density, expansion ratio and cell density of samples (3#–7#) had no big change. As a kind of non-melting particle33 which was added into PS with a large contents, the interfaces of PS and PolyFR had provided a large number of heterogeneous cell nucleation points leading to cell nucleation of the system reaching saturation. Therefore, the addition of inorganic particles had no obvious effect on nucleation.| Sample | Density (g cm−3) | Expansion ratio | Cell size (μm) | Cell density (cells per cm3) |
|---|---|---|---|---|
| 1# | 0.0989 | 10.1 | 110.5 | 0.49 |
| 2# | 0.0938 | 10.6 | 39.2 | 1.29 |
| 3# | 0.0838 | 11.9 | 38.4 | 1.83 |
| 4# | 0.0960 | 10.4 | 40.0 | 1.78 |
| 5# | 0.0865 | 11.5 | 41.5 | 1.83 |
| 6# | 0.1080 | 9.2 | 45.9 | 1.09 |
| 7# | 0.0970 | 10.3 | 41.6 | 1.56 |
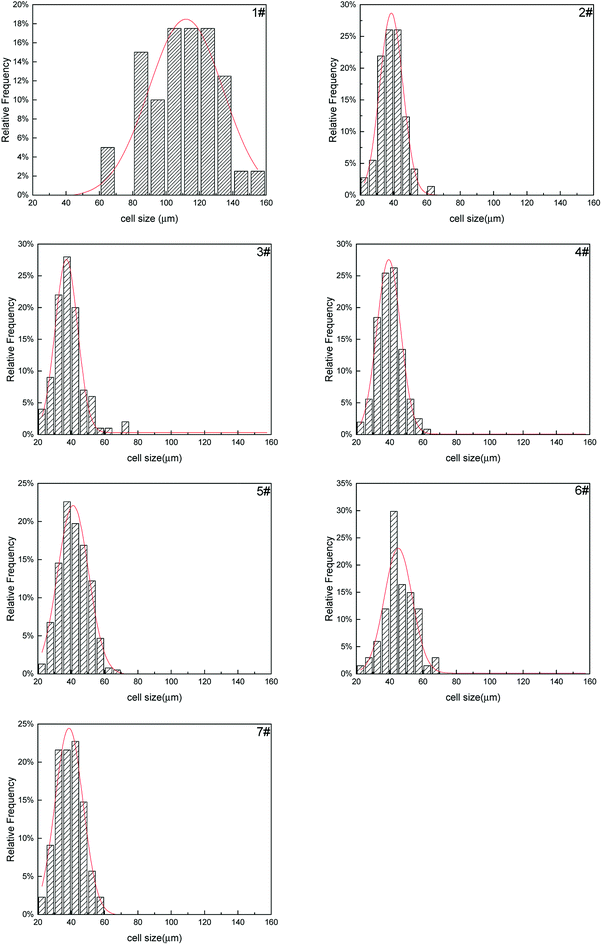
The cell size distribution of PS composite foams were shown in Fig. 15. Cell size distribution was a parameter to show the cell number within a certain range of cell size. The cell size distribution of PS foam (1#) was mainly from 80 μm to 140 μm. The cell size distribution of PS composite foams (2#–7#) were mainly from 30 μm to 50 μm but their cell size distribution had no obvious differences. As mentioned above, the addition of a large number of non-melting PolyFR particles led to cell nucleation of the system reaching saturation so that the addition of inorganic particles would not have a big change in cell size distribution.
4. Conclusion
PolyFR would be affected by shear stress and thermal oxidative degradation in practice leading to serious degradation. HT was able to added into the flame retardant system to improve the thermal stability of PolyFR because of the its ability to absorb HBr formed during thermal dehydrobromination of PolyFR to inhibit the autocatalytic degradation of the PolyFR. The LOI value of PS and PS foams containing 5% PolyFR reached 26.8% and 32.1%, UL94 rating are V-2. With the increase of BDDP content and the decrease of PolyFR content the LOI values of PS composites and their foams decreased gradually. When incorporating Sb2O3 into the PS composites, it inhibited the dropping effect of PS composites combustion resulted in a decrease in LOI value, but Sb2O3 also had a synergistic effect with PolyFR/BDDP to some extent, which inhibited the combustion of polymers by reducing and delaying HRR peak, THR, av-EHC. When OMMT existed in the flame retardant system, the flame retardancy of PS composites and their foams decreased sharply. These were attributed to the barrier and labyrinth effects of the dispersed silicate layers which hinder diffusion of volatile decomposition products within the PS composites leading to weakening of droplet effect and impede the circulation of HBr. The addition of graphite into the flame retardant system had the same phenomenon as adding OMMT. The barrier and labyrinth effects of the dispersed graphite layers also leading to weakening of droplet effect and impede the circulation of HBr, but flame retardancy wouldn't decrease that much like the composites with OMMT.As a kind of non-melting particle, 2.5% PolyFR provided a large number of heterogeneous cell nucleation points compared with pure PS which just had homogeneous nucleation which leading to cell nucleation of the system reached saturation. Therefore, the addition of Sb2O3, OMMT and graphite had no obvious effect on nucleation and cell size distribution.
Conflicts of interest
There are no conflicts to declare.Acknowledgements
This work was supported by the National Key Research and Development Program of China (2016YFB0302203 and 2016YFB0302205).References
- X. Han, J. Shen, H. Huang, D. L. Tomasko and L. J. Lee, Polym. Eng. Sci., 2007, 47, 103–111 CrossRef CAS.
- D. L. Tomasko, A. Burley, L. Feng, S.-K. Yeh, K. Miyazono, S. Nirmal-Kumar, I. Kusaka and K. Koelling, J. Supercrit. Fluids, 2009, 47, 493–499 CrossRef CAS.
- Y. Zhou, R. Bu, J. Gong, W. Yan and C. Fan, Exp. Therm. Fluid Sci., 2018, 92, 346–352 CrossRef CAS.
- C. Zhang, B. Zhu, D. Li and L. J. Lee, Polymer, 2012, 53, 2435–2442 CrossRef CAS.
- C. Zhang, B. Zhu and L. J. Lee, Polymer, 2011, 52, 1847–1855 CrossRef CAS.
- Z. Xing, M. Wang, G. Du, T. Xiao, W. Liu, D. Qiang and G. Wu, J. Supercrit. Fluids, 2013, 82, 50–55 CrossRef CAS.
- B. Cao, X. Gu, X. Song, X. Jin, X. Liu, X. Liu, J. Sun and S. Zhang, J. Appl. Polym. Sci., 2016, 134 Search PubMed.
- J. Q. Wang and W. K. Chow, J. Appl. Polym. Sci., 2005, 97, 366–376 CrossRef CAS.
- S. Yi, J. G. Liu, J. Jin and J. Zhu, Chemosphere, 2016, 150, 431–437 CrossRef CAS PubMed.
- M. Ezechias, S. Covino and T. Cajthaml, Ecotoxicol. Environ. Saf., 2014, 110, 153–167 CrossRef CAS PubMed.
- C. Koch, T. Schmidt-Kotters, R. Rupp and B. Sures, Environ. Pollut., 2015, 199, 26–34 CrossRef CAS PubMed.
- S. V. Levchik and E. D. Weil, Polym. Int., 2008, 57, 431–448 CrossRef CAS.
- G. Wang, X. Chen, P. Liu and S. Bai, J. Appl. Polym. Sci., 2016, 134 CAS.
- Y. Shi, B. Yu, L. Duan, Z. Gui, B. Wang, Y. Hu and R. K. K. Yuen, J. Hazard. Mater., 2017, 332, 87–96 CrossRef CAS PubMed.
- Z.-M. Zhu, Y.-J. Xu, W. Liao, S. Xu and Y.-Z. Wang, Ind. Eng. Chem. Res., 2017, 56, 4649–4658 CrossRef CAS.
- G. Wang and S. Bai, J. Appl. Polym. Sci., 2017, 134, 45474 CrossRef.
- H. Yan, J. Zhang, M. Zhang, X. Du, S. Ma and B. Xu, Adv. Polym. Technol., 2016, 35, 208–214 CrossRef CAS.
- B. Yuan, A. Fan, M. Yang, X. Chen, Y. Hu, C. Bao, S. Jiang, Y. Niu, Y. Zhang, S. He and H. Dai, Polym. Degrad. Stab., 2017, 143, 42–56 CrossRef CAS.
- Y. Han, Y. Wu, M. Shen, T. Li, Y. Wang, Q. Zhang and Z. Wang, Polym. Compos., 2017, 38, 1680–1688 CrossRef CAS.
- W. Xing, W. Yang, W. Yang, Q. Hu, J. Si, H. Lu, B. Yang, L. Song, Y. Hu and R. K. Yuen, ACS Appl. Mater. Interfaces, 2016, 8, 26266–26274 CrossRef CAS PubMed.
- J. Liu, M. Fu, M. Jing and Q. Li, Polym. Adv. Technol., 2013, 24, 273–281 CrossRef CAS.
- Z. Zhang, Y. Han, T. Li, T. Wang, X. Gao, Q. Liang and L. Chen, Synth. Met., 2016, 221, 28–38 CrossRef CAS.
- Y. Han, T. Li, B. Gao, L. Gao, X. Tian, Q. Zhang and Y. Wang, J. Appl. Polym. Sci., 2016, 133, 43047 CrossRef.
- Z. Wang, S. Jiang and H. Sun, Iran. Polym. J., 2016, 26, 71–79 CrossRef.
- Z. Guo, S. Ran and Z. Fang, J. Therm. Anal. Calorim., 2017, 128, 1719–1730 CrossRef CAS.
- S. Ran, C. Chen, Z. Guo and Z. Fang, J. Appl. Polym. Sci., 2014, 131, 4401–4404 CrossRef.
- C. G. Zang, X. P. Cao and J. C. Zhang, Adv. Mater. Res., 2013, 652–654, 423–429 Search PubMed.
- J. Kaspersma, C. Doumen, S. Munro and A. M. Prins, Polym. Degrad. Stab., 2002, 77, 325–331 CrossRef CAS.
- H. Lu and C. A. Wilkie, Polym. Degrad. Stab., 2010, 95, 564–571 CrossRef CAS.
- M. W. Beach, D. A. Beaudoin, I. Beulich, J. C. Bloom, J. W. Davis, H. M. Hollnagel, J. W. Hull, B. King, S. Kram, C. Lukas, M. Matteucci, T. Morgan and B. Stobby, Cell. Polym., 2013, 32, 229–236 CrossRef CAS.
- Additives for Polymers, 2015, 2015, 5–6 Search PubMed.
- Additives for Polymers, 2014, 2014, 8 Search PubMed.
- M. W. Beach, J. W. Hull, B. A. King, I. I. Beulich, B. G. Stobby, S. L. Kram and D. B. Gorman, Polym. Degrad. Stab., 2017, 135, 99–110 CrossRef CAS.
- M. Lewin and E. D. Weil, Fire Retard. Mater., 2001, 31–68 CAS.
- J. Eichhorn, J. Appl. Polym. Sci., 2010, 8, 2497–2524 CrossRef.
- M. W. Beach, N. G. Rondan, R. D. Froese, B. B. Gerhart, J. G. Green, B. G. Stobby, A. G. Shmakov, V. M. Shvartsberg and O. P. Korobeinichev, Polym. Degrad. Stab., 2008, 93, 1664–1673 CrossRef CAS.
- S. H. Park, S. T. Lim, T. K. Shin, H. J. Choi and M. S. Jhon, Polymer, 2001, 42, 5737–5742 CrossRef CAS.
- R. Bacaloglu and M. Fisch, Polym. Degrad. Stab., 1994, 45, 301–313 CrossRef CAS.
- P. Šimon, Polym. Degrad. Stab., 1992, 36, 85–89 CrossRef.
- Y. Lin, J. Wang, D. G. Evans and D. Li, J. Phys. Chem. Solids, 2006, 67, 998–1001 CrossRef CAS.
- J. Yu, L. Sun, C. Ma, Y. Qiao and H. Yao, Waste Manag., 2016, 48, 300–314 CrossRef CAS PubMed.
- Y.-J. Lin, D.-Q. Li, D. G. Evans and X. Duan, Polym. Degrad. Stab., 2005, 88, 286–293 CrossRef CAS.
- X. Zhang, L. Zhou, H. Pi, S. Guo and J. Fu, Polym. Degrad. Stab., 2014, 102, 204–211 CrossRef CAS.
- V. Babushok, W. Tsang, G. T. Linteris and D. Reinelt, Combust. Flame, 1998, 115, 551–560 CrossRef CAS.
- W. Xi, L. Qian, Y. Qiu and Y. Chen, Polym. Adv. Technol., 2016, 27, 781–788 CrossRef CAS.
- Y. Cao, L. Qian, Y. Chen and Z. Wang, J. Appl. Polym. Sci., 2017, 45126 CrossRef.
- T. Handa, T. Nagashima and N. Ebihara, Fire Mater., 2010, 3, 61–67 CrossRef.
- Y. Hu, S. Wang, Z. Ling, Y. Zhuang, Z. Chen and W. Fan, Macromol. Mater. Eng., 2003, 288, 272–276 CrossRef CAS.
- M. Masoomi, R. Bagheri, L. Ahmadkhanbeigi and M. Asgari, J. Appl. Polym. Sci., 2014, 131, 178–184 CrossRef.
- J. W. Gilman, Appl. Clay Sci., 1999, 15, 31–49 CrossRef CAS.
- H. Qin, Q. Su, S. Zhang, B. Zhao and M. Yang, Polymer, 2003, 44, 7533–7538 CrossRef CAS.
- A. B. Morgan, Polym. Adv. Technol., 2006, 17, 206–217 CrossRef CAS.
- M. Zanetti, T. Kashiwagi, a. L. Falqui and G. Camino, Chem. Mater., 2002, 14, 881–887 CrossRef CAS.
- M. Zanetti, G. Camino, D. Canavese, A. B. Morgan, F. J. Lamelas and C. A. Wilkie, Chem. Mater., 2002, 14, 189–193 CrossRef CAS.
- R. Shen, L. C. Hatanaka, L. Ahmed, R. J. Agnew, M. S. Mannan and Q. Wang, J. Therm. Anal. Calorim., 2016, 128, 1443–1451 CrossRef.
- B. Dittrich, K.-A. Wartig, D. Hofmann, R. Mülhaupt and B. Schartel, Polym. Degrad. Stab., 2013, 98, 1495–1505 CrossRef CAS.
- B. Schartel and A. Weiß, Fire Mater., 2010, 34, 217–234 CrossRef CAS.
- J. S. Colton and N. P. Suh, Polym. Eng. Sci., 1987, 27, 493–499 CrossRef CAS.
| This journal is © The Royal Society of Chemistry 2019 |

