 Open Access Article
Compatibility and thermal decomposition mechanism of nitrocellulose/Cr2O3 nanoparticles studied using DSC and TG-FTIR
Yu Guoa,
Ningning Zhaoa,
Ting Zhanga,
Hujun Gongb,
Haixia Ma *a,
Ting Anc,
Fengqi Zhaoc and
Rongzu Huc
aSchool of Chemical Engineering, Northwest University, Shaanxi, Xi'an 710069, P. R. China. E-mail: mahx@nwu.edu.cn
bState Key Laboratory of Continental Dynamics, Northwest University, Shaanxi, Xi'an 710069, P. R. China
cScience and Technology on Combustion and Explosion Laboratory, Xi'an Modern Chemistry Research Institute, Shaanxi, Xi'an 710065, P. R. China
First published on 29th January 2019
Abstract
Nano metal oxides are common combustion catalysts for enhancing the burning rate of solid propellants. Cr2O3 nanoparticles (NPs) are efficient combustion catalysts for the pyrolysis of energetic components. In this study, Cr2O3 NPs were synthesized via a modified sol–gel method and further used for studying the thermal decomposition of nitrocellulose (NC). Differential scanning calorimetry (DSC) and thermogravimetry-Fourier-transform infrared spectroscopy (TG-FTIR) analyses indicate that the Cr2O3 NPs can be safely used with NC and the mechanism of the reaction between Cr2O3/NC and pure NC follows the Avrami–Erofeev equation: f(α) = 3(1 − α)[−ln(1 − α)]1/3/2. The peak temperature and activation energy (Ea) for the thermal decomposition of Cr2O3/NC are lower than those of pure NC. NO2 was detected at a lower temperature after NC was mixed with Cr2O3 NPs; this indicated the catalytically accelerated bond cleavage of NC by Cr2O3 NPs.
Introduction
Solid propellants as the power source of missiles and rocket engines are significant. They are composite materials that are made up of an oxidation agent, a burning catalyst, a binder and so on. For solid propellants, the core of the propulsion technology is combustion performance.1 The combustion performance refers to the burning rate and the pressure index. A propellant without a catalyst has a low burning rate, a high-pressure index, and unstable combustion. Therefore, a burning-rate catalyst is an indispensable key material in solid propellants. Nitrocellulose (NC) is a common oxidant in solid propellants, and its decomposition properties are closely connected to the combustion performances of propellants.2 Several studies have demonstrated that by adding burning catalysts, the oxidizer decomposition can be significantly accelerated and the burning rate of the propellant can be enhanced.3 In recent years, nanoscale metal oxides have exhibited high catalytic activity due to their large surface area, high mobility of their surface atoms, small particle size, and varied lattice defects, which have drawn extensive attention in various fields such as in photocatalysis,4 electrochemistry,5 solid-oxide fuel cells,6 magnetic materials,7 etc.8 As a common transition metal oxide in nature, Cr2O3 is environmentally compatible, low-cost, less toxic, and naturally abundant and exhibits good catalytic activity; moreover, it has been widely applied as a burning catalyst. For instance, annealed Cr2O3 nanorods could accelerate the thermal decomposition process of cyclotrimethylenetrinitramine (RDX) and reduce the decomposition temperature by 10 °C.9 Another study showed that nanosized Cr2O3 NPs decreased the ignition delay time by a factor of 3.5 (16 ± 2 vs. 54 ± 4 ms) and accelerated the combustion rate (340 ± 10 mm s−1) of the Al/Cr2O3 thermite, which was fabricated by Cr2O3 micro- or nanoparticles (Φ ≈ 20 nm) and Al NPs (Φ ≈ 50 nm).10A number of efforts have been devoted towards the exploration of the catalytic effects of Cr2O3, and as a burning catalyst, Cr2O3 exhibits excellent catalyst performance. However, studies on the compatibility and thermal decomposition mechanism of nitrocellulose/Cr2O3 NPs have been rarely reported. Compatibility is one of the most important measures for energetic materials, which determines whether two components can be used together. Moreover, investigation of the thermal decomposition mechanism could help to understand the catalytic mechanism and design efficient catalysts.
In this study, we prepared Cr2O3 NPs using a sol–gel method and studied the thermal behaviour and non-isothermal decomposition kinetics of the Cr2O3/NC composite. DSC thermal analysis was applied to evaluate the compatibility between Cr2O3 NPs and NC. Thermal decomposition mechanism of NC under catalysis by Cr2O3 was investigated using DSC and TG-FTIR techniques. The results indicate that the Cr2O3 NPs have good compatibility with NC and can be used as a potential catalyst in the solid propellant due to their potential catalytic effect on the decomposition of the main components of propellants.
Experimental
Materials
The chemicals used in the experiment are as follows: chromic chloride (CrCl3·6H2O, 99.0%, Xilong Chemical Reagent Co.), alcohol (C2H5OH, anhydrous, Xilong Chemical Reagent Co.), propylene oxide (C3H6O, 99.0%, Kelong Chemical Reagent Co.), NC (12.6% N, Xi'an Modern Chemistry Research Institute), and Al powders (≈50 nm, Jiaozuo Banlv Nano Material Engineering Co.). The chemicals were of analytical grade and used without any further purification. Deionized water was used throughout the experiment.Caution! NC is an explosive hazardous material. It is strongly recommended to wear safety glasses and face shields while handling these materials in large quantities. Metal spatulas are strictly forbidden. Fire and static electricity discharge should be avoided. For the TG-FTIR and DSC analyses, not more than 2 mg of sample should be used to avoid instrument damage. NC was provided by the Xi'an Modern Chemistry Research Institute.
Preparation of the Cr2O3 NPs
Cr2O3 nanopowders were prepared by a sol–gel method. In the synthesis of the Cr2O3 gel, CrCl3·6H2O was used as the chromium source, and propylene oxide was used as the complexing agent. Typically, 0.66 g of CrCl3·6H2O was dissolved in 2.0 mL of anhydrous ethanol, and a green transparent solution was obtained by ultrasonic dispersion at room temperature. Then, 0.85 mL of propylene oxide was added to form a uniform, stable dark green wet gel within 10 minutes. After aging for 24 h, the precursors were removed by drying in an oven at 60 °C. The resulting xerogel was calcined at 800 °C for 2 h.Preparation of composite materials
The Cr2O3 NPs were evenly mixed with NC to obtain composite materials at a 1![[thin space (1/6-em)]](https://www.rsc.org/images/entities/char_2009.gif) :
:![[thin space (1/6-em)]](https://www.rsc.org/images/entities/char_2009.gif) 1 proportion by mass. The products were used for the DSC experiment to assess the compatibility of Cr2O3 NPs with the main component of the double-base (DB) propellant.
1 proportion by mass. The products were used for the DSC experiment to assess the compatibility of Cr2O3 NPs with the main component of the double-base (DB) propellant.
Samples characterization
Physical phase, composition, morphology and structure of the raw materials and products were characterized by XRD, SEM-EDS and FTIR spectroscopy. X-ray diffractograms were obtained via the D/MAX-3C (Japan) instrument using Cu Kα radiation (λ = 0.15406 nm) at 40 kV voltage and 40 mA current in the range from 15° to 65°. Scanning electron microscopy (SEM) observations were carried out using the Quanta 400 FESEM (FEI Co., USA) at the acceleration voltage of 30 kV. Energy Dispersive Spectroscopy (EDS) were obtained using the INCAIE350 testing device, obtained from OXFORD Instruments INC (UK), with the discharge voltage of 4–10 kV and a distance of exactly 1 mm between electrodes. The morphology and size of the as-obtained products were investigated via transmission electron microscopy (TEM) and high-resolution TEM using Libra 200FE (Carl Zeiss SMT Pte Ltd., Germany). FTIR spectra were obtained using the Bruker Tensor 27 (KBr) spectrometer. The Brunauer–Emmett–Teller (BET) specific surface areas were obtained using the Micromeritics Tristar 3000 automated gas adsorption analyzer.Thermal behaviors of the samples were determined using differential scanning calorimetry (DSC) at the heating rate of 10 °C min−1 from room temperature to 350 °C under a N2 atmosphere at the flow rate of 50 mL min−1 under ambient atmospheric pressure. To explore the reaction mechanism of the intense exothermic decomposition processes of NC and Cr2O3/NC composite energetic materials and obtain the corresponding kinetic parameters [apparent activation energy (Ea/kJ mol−1) and the pre-exponential constant (A/s−1)] and the most probable kinetic model function, the DSC curves were obtained at the heating rates of 5.0, 10.0, 15.0, 20.0, 25.0 and 30.0 °C min−1. Thermal decomposition studies of NC and Cr2O3/NC were also performed using the TG-FTIR simultaneous analysis device (Netzsch STA 409, Brucker V70) under a nitrogen atmosphere at the heating rate of 10 °C min−1.
Results and discussion
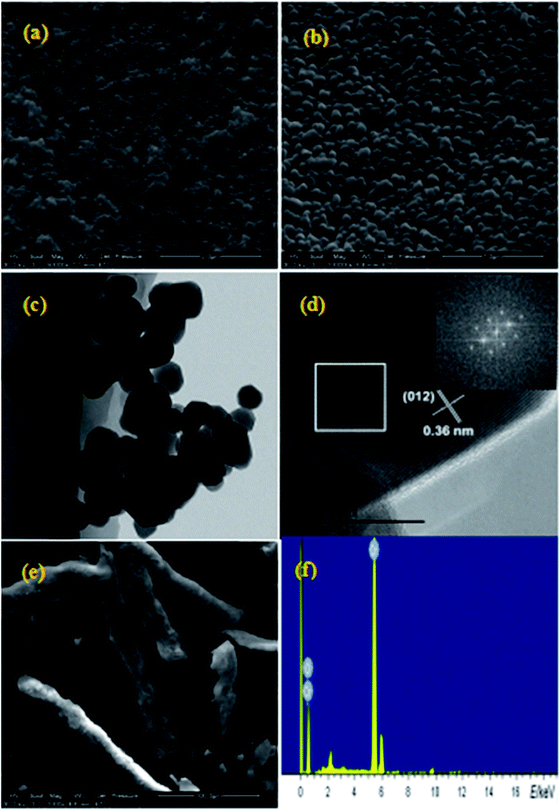
The morphology and size of the nanometer oxides and composite materials were investigated by SEM and TEM. Fig. 1a and b show the SEM images of Cr2O3 NPs obtained with ×50![[thin space (1/6-em)]](https://www.rsc.org/images/entities/char_2009.gif) 000 and ×100
000 and ×100![[thin space (1/6-em)]](https://www.rsc.org/images/entities/char_2009.gif) 000 magnification, respectively. In these images, a loosely agglomerated structure can be observed. The Cr2O3 NPs are spherical in shape with an average diameter of ∼100 nm. As determined from the typical TEM image (Fig. 1c), thickly dotted pits were found on the surface of the Cr2O3 NPs. The cross-sectional HRTEM image of a small part of the Cr2O3 nanoparticle is shown in Fig. 1d. Only one set of clear lattice fringes with an interplanar distance of 0.36 nm could be seen, which could be indexed to the 012 plane of the Cr2O3 structure. Good crystallinity is also confirmed by the corresponding fast Fourier-transform (FFT) image (the inset in Fig. 1d). As displayed in Fig. 1e, the Cr2O3/NC composite material shows a claviform structure with rough and irregular surfaces, diameter in the range from 25 to 35 μm and length in the range from 80 to 200 μm. Elemental analysis (as shown in Fig. 1e) reveals that the presence of only chromium and oxygen elements agrees with the chemical composition of Cr2O3.
000 magnification, respectively. In these images, a loosely agglomerated structure can be observed. The Cr2O3 NPs are spherical in shape with an average diameter of ∼100 nm. As determined from the typical TEM image (Fig. 1c), thickly dotted pits were found on the surface of the Cr2O3 NPs. The cross-sectional HRTEM image of a small part of the Cr2O3 nanoparticle is shown in Fig. 1d. Only one set of clear lattice fringes with an interplanar distance of 0.36 nm could be seen, which could be indexed to the 012 plane of the Cr2O3 structure. Good crystallinity is also confirmed by the corresponding fast Fourier-transform (FFT) image (the inset in Fig. 1d). As displayed in Fig. 1e, the Cr2O3/NC composite material shows a claviform structure with rough and irregular surfaces, diameter in the range from 25 to 35 μm and length in the range from 80 to 200 μm. Elemental analysis (as shown in Fig. 1e) reveals that the presence of only chromium and oxygen elements agrees with the chemical composition of Cr2O3.
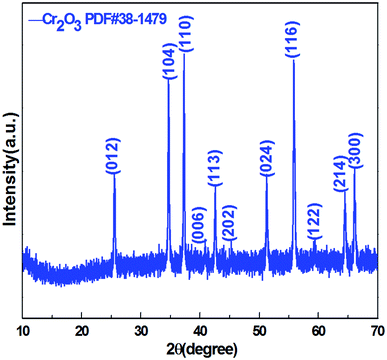
Crystal structure and phase composition of the resulting sample were characterized using the X-ray powder diffraction (XRD) technique. Fig. 2 displays the XRD pattern of the as-prepared Cr2O3 NPs. The reflection peaks shown in Fig. 2 are consistent with those provided in the Joint Committee on Powder Diffraction Standards (JCPDS) card 38-1479 of the Cr2O3 structure. The sharp peaks suggest that the Cr2O3 NPs are highly crystalline. These peaks are attributed to the rhombohedral structure (space group R![[3 with combining macron]](https://www.rsc.org/images/entities/char_0033_0304.gif) c) with the unit cell parameters a = b = 4.9619 Å, c = 13.7128 Å, α = β =90° and γ = 120° of the Cr2O3 phase.
c) with the unit cell parameters a = b = 4.9619 Å, c = 13.7128 Å, α = β =90° and γ = 120° of the Cr2O3 phase.
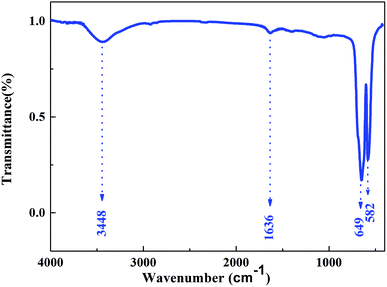
The FTIR spectrum of Cr2O3 NPs (Fig. 3) in the 4000–400 cm−1 region displayed the characteristic bands at 3448, 1636, 649, and 582 cm−1. The band at 3448 cm−1 is due to the O–H stretching of the surface hydroxyls groups and undissociated water molecules.11 Absorption at 1636 cm−1 can be relatively assigned to the bending modes of undissociated water molecules. Strong bands at 649 and 582 cm−1 were observed and indicated the presence of crystalline α-Cr2O3;12 this was consistent with the XRD analysis results. Furthermore, the absorption peaks of α-Cr2O3 NPs have an obvious blue-shift via the quantum confinement effect relative to those of the bulk crystal.13
Thermal behavior of NC and composite materials
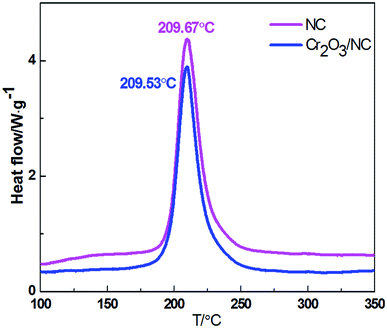
Fig. 4 shows the thermal decomposition behavior of NC and Cr2O3/NC at the heating rate of 10 °C min−1. It can be seen that the entire decomposition processes of NC and Cr2O3/NC are similar, and the peak temperature of Cr2O3/NC is lower than that of pure NC at 0.14 °C. To obtain the kinetic parameters [apparent activation energy (Ea) and pre-exponential factor (A)] of the exothermic main decomposition reaction for Cr2O3/NC and find out the catalytic effect of Cr2O3, DSC curves were obtained at the heating rates of 5.0, 10.0, 15.0, 20.0, 25.0 and 30.0 °C min−1. Moreover, two model-free isoconversional methods, the Kissinger equation14 and the Flynn–Wall–Ozawa (F–W–O) equation,15 were employed for calculations.As listed in Table 1, the Eα obtained by the Kissinger method14 is determined to be 190.86 kJ mol−1, and the pre-exponential constant (A) is 1018.87 s−1. The linear correlation coefficient (rk) is 1.0000. The value of Eα obtained by the Ozawa's method15 is 189.16 kJ mol−1, and the value of ro is 1.0000.
| Eq | β/°C min−1 | E/kJ mol−1 | lg (A/s−1) | r |
|---|---|---|---|---|
| a E with the subscript eo and po is the apparent activation energy obtained from the onset temperature (Te) and the peak temperature (Tp), respectively, by the Ozawa's method, E with the subscript K is the apparent activation energy obtained from the peak temperature (Tp) by the Kissinger's method. | ||||
| MacCallum–Tanner | 5.0 | 172.16 | 16.57 | 0.9961 |
| 10.0 | 178.83 | 17.34 | 0.9965 | |
| 15.0 | 188.42 | 18.39 | 0.9962 | |
| 20.0 | 191.07 | 18.68 | 0.9966 | |
| 25.0 | 189.04 | 18.45 | 0.9964 | |
| 30.0 | 187.49 | 18.29 | 0.9965 | |
| Šatava–Šesták | 5.0 | 170.73 | 16.45 | 0.9961 |
| 10.0 | 177.03 | 17.18 | 0.9965 | |
| 15.0 | 186.08 | 18.17 | 0.9962 | |
| 20.0 | 188.59 | 18.45 | 0.9966 | |
| 25.0 | 186.67 | 18.23 | 0.9964 | |
| 30.0 | 185.20 | 18.08 | 0.9965 | |
| Agrawal | 5.0 | 171.61 | 16.56 | 0.9957 |
| 10.0 | 178.12 | 17.30 | 0.9962 | |
| 15.0 | 187.57 | 18.33 | 0.9958 | |
| 20.0 | 190.16 | 18.62 | 0.9963 | |
| 25.0 | 188.10 | 18.39 | 0.9961 | |
| 30.0 | 186.53 | 18.22 | 0.9962 | |
| General integral | 5.0 | 175.57 | 15.34 | 0.9959 |
| 10.0 | 182.14 | 16.07 | 0.9963 | |
| 15.0 | 191.63 | 17.08 | 0.9960 | |
| 20.0 | 194.24 | 17.36 | 0.9965 | |
| 25.0 | 192.20 | 17.14 | 0.9963 | |
| 30.0 | 190.64 | 16.98 | 0.9963 | |
| Universal integral | 5.0 | 190.64 | 16.98 | 0.9963 |
| 10.0 | 178.12 | 17.31 | 0.9962 | |
| 15.0 | 187.57 | 18.33 | 0.9958 | |
| 20.0 | 190.16 | 18.62 | 0.9963 | |
| 25.0 | 188.10 | 18.39 | 0.9961 | |
| 30.0 | 186.53 | 18.22 | 0.9962 | |
| Mean | 184.40 | 17.64 | ||
| Flynn–Wall–Ozawa | 189.16 (Epo) | 1.0000 | ||
| Kissinger | 190.86 (EK) | 18.87 | 1.0000 | |
| Mean (Eeo, Epo, EK) | 179.14 | |||
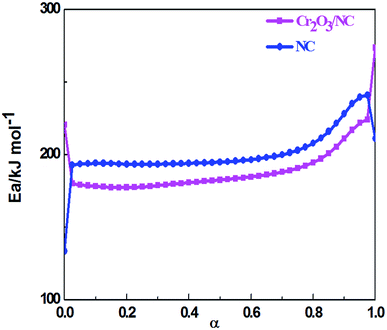
The values of Ea obtained by the Ozawa's method from the isoconversional DSC curves at the heating rates of 5.0, 10.0, 15.0, 20.0, 25.0 and 30.0 °C min−1 were used to draw the Ea–α (α, the extent of the reaction) relation (Fig. 5). To compare the thermal behaviors of NC and the composite material, the Ea–α relation of NC was obtained by the same method as shown in Fig. 5. The Cr2O3 NPs had an obvious catalytic effect on NC due to their lower apparent activation energy. From the curve of Cr2O3/NC shown in Fig. 5, it could be seen that the values of Eα in the range of α = 0.25–0.675 were in good agreement with the calculated values of Eα obtained by the Kissinger's method and Ozawa's method. The E values calculated using the Flynn–Wall–Ozawa equation14 were used to check the validity of the activation energy values determined by other methods.
The integral equations (MacCallum–Tanner, Šatava–Šesták, Agrawal, general integral, universal integral, and Flynn–Wall–Ozawa) have been cited to obtain the values of E, A and the most probable kinetic model function G(α) from a single non-isothermal DSC curve.16
Herein, forty-one types of kinetic model functions reported in the ref. 17 and basic data were put into the integral equations and the Kissinger equation for calculation, respectively. The kinetic parameters and the probable kinetic model function were selected by the logical choice method, satisfying the ordinary range of the thermal decomposition kinetic parameters for energetic materials (E = 80–250 kJ mol−1, log![[thin space (1/6-em)]](https://www.rsc.org/images/entities/char_2009.gif) A = 7–30 s−1). These data together with the appropriate values for the linear correlation coefficient (r), standard mean square deviation (S) and believable factor (d, where d = (1 − r)S) are presented in Table 1. The values of E are very close to each other. The values of E and A obtained from a single non-isothermal DSC curve are in good agreement with the calculated values obtained by the Kissinger's method and Ozawa's method. Therefore, we concluded that the main exothermic decomposition reaction mechanism of Cr2O3/NC could be classified as the nucleation and growth mechanism, and the mechanism followed the Avrami–Erofeev equation, where n = 2/3.18 The reaction mechanism of the exothermic main decomposition process of the compound is classified as f(α) = 3(1 − α)[−ln(1 − α)]1/3/2, G(α) = [−ln(1 − α)]2/3. f(α) was substituted with 3(1 − α)[−ln(1 − α)]1/3/2, E was substituted with 184.40 kJ mol−1 and A was substituted with 1017.64 s−1 in eqn (1).
A = 7–30 s−1). These data together with the appropriate values for the linear correlation coefficient (r), standard mean square deviation (S) and believable factor (d, where d = (1 − r)S) are presented in Table 1. The values of E are very close to each other. The values of E and A obtained from a single non-isothermal DSC curve are in good agreement with the calculated values obtained by the Kissinger's method and Ozawa's method. Therefore, we concluded that the main exothermic decomposition reaction mechanism of Cr2O3/NC could be classified as the nucleation and growth mechanism, and the mechanism followed the Avrami–Erofeev equation, where n = 2/3.18 The reaction mechanism of the exothermic main decomposition process of the compound is classified as f(α) = 3(1 − α)[−ln(1 − α)]1/3/2, G(α) = [−ln(1 − α)]2/3. f(α) was substituted with 3(1 − α)[−ln(1 − α)]1/3/2, E was substituted with 184.40 kJ mol−1 and A was substituted with 1017.64 s−1 in eqn (1).
 | (1) |
The kinetic equation for the exothermic decomposition reaction can be described as
The values Te0 and Tp0 of the onset temperature (Te) and the peak temperature (Tp) corresponding to β → 0 obtained by eqn (2) are 180.74 °C and 193.50 °C, respectively.
| Te or p = Te0 or p0 + aβi + bβi2 + cβi3 i = 1–6 | (2) |
The corresponding critical temperatures of thermal explosion (Tb) obtained from eqn (3) taken from the ref. 17 is 203.49 °C.
 | (3) |
The entropy of activation (ΔS≠), enthalpy of activation (ΔH≠) and free energy of activation (ΔG≠) corresponding to T = TPO, Ea = Ek and A = Ak (obtained by eqn (4)–(6)) are 112.61 J mol−1 K−1, 190.86 kJ mol−1 and 138.31 kJ mol−1, respectively.
 | (4) |
 | (5) |
| ΔG≠ = ΔH≠ − TΔS≠ | (6) |
The thermal behavior of NC was analyzed using the same method. The results show that the reaction mechanism of the intense exothermic decomposition process can be classified as the reaction order f(α) = 3(1 − α)[−ln(1 −α)]1/3/2, G(α) = [−ln(1 − α)]2/3. The calculated values of the kinetic parameters of the decomposition reaction for NC and Cr2O3/NC are listed in Table 2. According to the ref. 19, the higher the values of Te0, Tp, Tb, Ea and ΔH≠, the better the heat resistant feature of the materials. This means that materials with low values of Te0, Tp, Tb, Ea and ΔH≠ easily decompose when heated. Compared to NC, the Cr2O3/NC composite will easily decompose based on the calculated thermal parameters.
| Sample | Ea | log(A/s−1) | Te0/°C | Tp0/°C | Tbe0/°C | Tbp0/°C | ΔS≠ J mol−1k−1 | ΔH≠ kJ mol−1 | ΔG≠ kJ mol−1 |
|---|---|---|---|---|---|---|---|---|---|
| a The values (Te0 and Tp0) of the onset temperature (Te) and peak temperature (Tp), the thermal ignition temperature (Tbe0), and the critical temperatures of thermal explosion (Tbp0). | |||||||||
| NC | 207.48 | 20.22 | 181.76 | 197.00 | 191.42 | 206.69 | 138.40 | 199.68 | 134.61 |
| Cr2O3/NC | 184.40 | 17.64 | 180.74 | 193.50 | 192.18 | 203.49 | 112.61 | 190.86 | 138.31 |
The compatibility analysis
Compatibility of two or more materials refers to their ability to maintain their original physical and chemical properties when mixed together. Poor compatibility may result in changes in the formulation quality, activity and efficiency. It can also lead to variations in thermal safety. Analytical techniques such as differential scanning calorimetry (DSC), pressure differential scanning calorimetry (PDSC),20,21 thermogravimetry/differential thermal analysis (TG/DTA), isothermal storage tests (IST), pressure isothermal storage tests (PIST), manometric vacuum stability tests (MVST), pressure vacuum stability tests (PVST),22 and isothermal microcalorimetry (IMC)23 have been used for compatibility studies. The DSC thermal analysis method24 is widely applied to evaluate the chemical compatibility between explosives and the contacted materials at high temperatures due to its features such as time-saving ability, reduced sample usage and operation convenience. Herein, the DSC thermal analysis method was applied to evaluate the compatibility of Cr2O3 NPs with NC. The experimental data show that the decomposition peak temperature of Cr2O3/NC is lower than that of NC at 0.14 °C, which is within the experimental and instrumental error. The result indicates that the compatibility of the Cr2O3 powder with NC is good.25 Therefore, the Cr2O3/NC composite can be used as a component in the preparation of propellants and explosives.Thermal decomposition mechanism
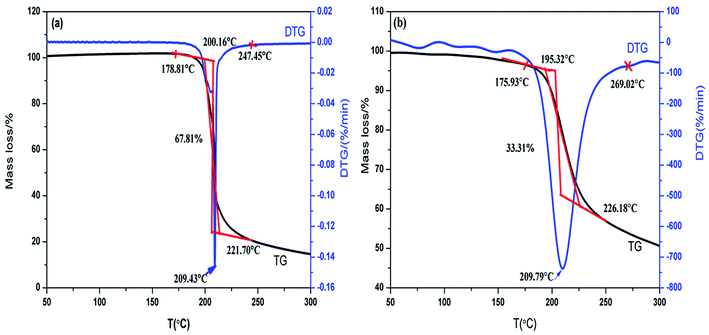
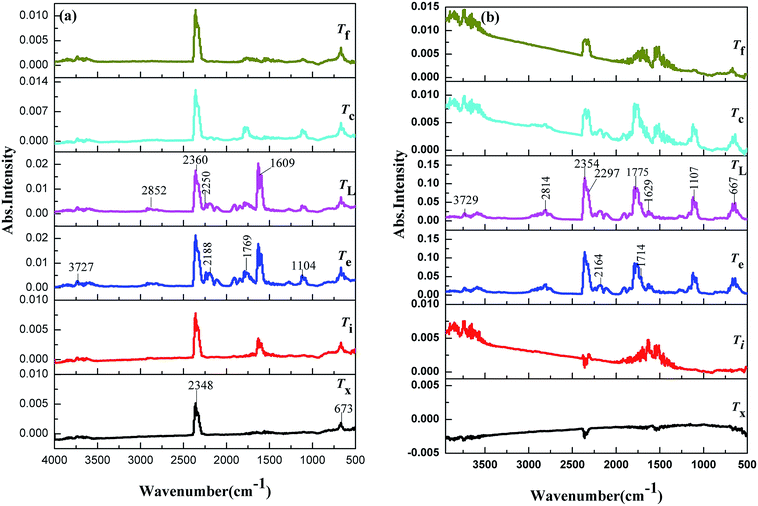
The TG-FTIR simultaneous analysis technique was employed to investigate the thermal degradation process of NC and Cr2O3/NC at the heating rate of 10 °C min−1. It was found from the TG-DTG curves of NC and Cr2O3/NC (Fig. 6) that only one stage of the total mass loss occurred. The onset decomposition temperature (Ti) of Cr2O3/NC is 175.93 °C, which is 2.88 °C lower than that of NC.The apparent variation in the IR characteristic absorption peaks of the gaseous decomposition products of NC and Cr2O3/NC formed due to the thermal decomposition process at typical temperatures, including the temperature before decomposition (Tx), the initial temperature (Ti), the extrapolated onset temperature (Te), the peak temperature (Tp), the extrapolated end temperature (Tc), and the final temperature (Tf), are shown in Fig. 7 and Table 3. For pure NC, the IR absorption peaks of H2O (3600–3740 cm−1), CO2 (2300–2380, 660–670 cm−1) and NO2 (1593–1635 cm−1)26,27 are detected at 178.81 °C (Ti), which is the initial temperature of NC. The IR spectrum acquired at 164.92 °C was obtained (Fig. 7a (Tx)) to determine whether H2O and CO2 detected at 178.81 °C originated from the decomposition of NC. The intensities of the IR absorption of H2O and CO2 remained basically unchanged at both 164.92 °C and 178.81 °C; this indicated that H2O and CO2 were not the initial degradation products of NC. Therefore, NO2 was considered to be the initial degradation product; this meant that the breakage of the O–NO2 bond was deemed to be the first decomposition step as reported in previous studies.28–32 When the temperature increased (Te, Tp, Tc), the gaseous products such as NO (1762–1965 cm−1), CO (2150–2194 cm−1), N2O (2200–2300 cm−1), HCHO (2700–2900 cm−1, 1720–1740 cm−1), and HCOOH (1080–1128 cm−1) were detected.27,28 The peaks at 2852 cm−1 and 1769 cm−1 are attributed to the modes of the C–H and C![[double bond, length as m-dash]](https://www.rsc.org/images/entities/char_e001.gif) O stretching bands of HCHO, respectively,28 which are generated by the –CH2ONO2 group.33 Evolution of the HCOOH gas is due to the secondary autocatalytic reactions of NC.31–33 At the end of the decomposition process (Tf), the IR absorption peaks of H2O, CO2, NO and HCOOH26,27 are still easily identifiable in Fig. 7a (Tf). The species and the intensities of the gas products obtained via the degradation of NC are also shown in the 3D FTIR spectra (Fig. 9a).
O stretching bands of HCHO, respectively,28 which are generated by the –CH2ONO2 group.33 Evolution of the HCOOH gas is due to the secondary autocatalytic reactions of NC.31–33 At the end of the decomposition process (Tf), the IR absorption peaks of H2O, CO2, NO and HCOOH26,27 are still easily identifiable in Fig. 7a (Tf). The species and the intensities of the gas products obtained via the degradation of NC are also shown in the 3D FTIR spectra (Fig. 9a).
| NC | Cr2O3/NC | ||
|---|---|---|---|
| Temperature/°C | Gaseous products | Temperature/°C | Gaseous products |
| a Tx, some temperature below the initial decomposition temperature; Ti, the initial decomposition temperature; Te, the extrapolated onset temperature; TL, the peak temperature; Tc, the extrapolated end temperature; and Tf, the final temperature. | |||
| 164.92 (Tx) | H2O, CO2 | 159.96 (Tx) | H2O, CO2 |
| 178.81 (Ti) | H2O, CO2, NO2 | 175.93 (Ti) | H2O, CO2, NO2 |
| 200.16 (Te) | H2O, CO2, NO2, NO, CO | 195.32 (Te) | H2O, CO2, NO2, NO, CO |
| 209.43 (TL) | H2O, CO2, NO2, NO, N2O, HCHO, HCOOH | 209.79 (TL) | H2O, CO2, CO, NO2, NO, N2O, HCHO, HCOOH |
| 221.70 (Tc) | H2O, CO2, NO, HCOOH | 226.18 (Tc) | H2O, CO2, CO, NO2, NO, N2O, HCHO, HCOOH |
| 247.45 (Tf) | H2O, CO2, NO, HCOOH | 269.02 (Tf) | H2O, CO2, NO, NO2, HCOOH |
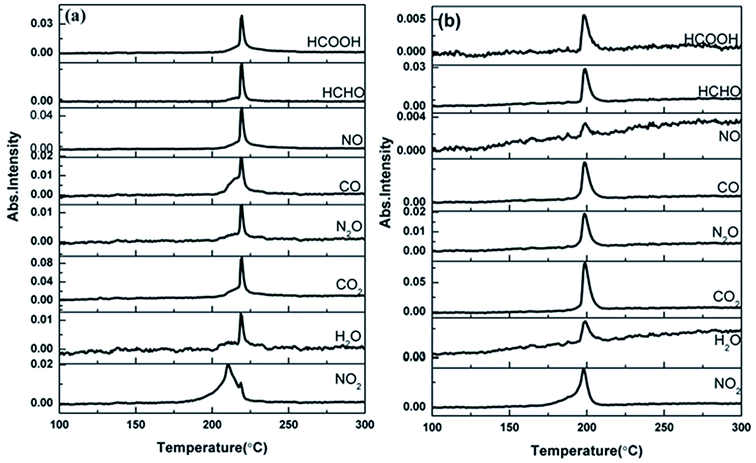 | ||
| Fig. 8 The density distribution of the gas phase decomposition products of NC (a) and Cr2O3/NC (b). The temperature refers to the peak temperature. | ||
 | ||
| Fig. 9 3D-IR spectra of the gas products of NC (a) and Cr2O3/NC (b) at the heating rate of 10 °C min−1. | ||
From the gaseous product data obtained at Tx and Ti of Cr2O3/NC listed in Table 3, we can see that H2O and CO2 originate from gases in the environment, and NO2 can be first detected at 175.93 °C. Moreover, the noticeable IR peaks of CO and NO can be found at a lower temperature of 195.32 °C (Te, Fig. 7b) than those obtained for pure NC. After comparing the gaseous species with pure NC, we found that the Cr2O3/NC composite released more gaseous products at Tc and Tf. This is additional evidence of the catalytic effect of Cr2O3 NPs on the thermal decomposition of NC, which may be due to the released NO2 or radical stagnate in the polymer skeleton, which then reacts with the other radicals or degradation products to produce several small molecular products. The density distributions of the gas-phase decomposition products of NC and Cr2O3/NC are shown in Fig. 8. It can be seen that NO2 is the initial released gas during the thermal decomposition process of NC and Cr2O3/NC. Other products were released afterward. Notably, due to the catalytic effect of Cr2O3, NO, CO, N2O, HCHO and HCOOH gases were gradually released and reached their highest densities at lower temperatures. Upon comprehensive analysis of the density distribution and IR spectra of two samples, we can conclude that Cr2O3 can accelerate the bond cleavage of NC and the secondary reactions of the condensed phases to form numerous gaseous products.
The Brunauer–Emmett–Teller (BET) specific surface area of Cr2O3 NPs is 11.2 m2 g−1. The specific surface area of NPs is the dominant factor for adsorption capacity. Generally, the larger the surface areas that the NPs possess, the higher the adsorption capacity and the better the catalytic ability that the NPs exhibit. The decomposition reaction is controlled by the condensed phase, the gaseous products or the reaction between the condensed phase and the gaseous products. With the adsorption effect of Cr2O3 NPs, gaseous products such as NO2 do not escape easily from the condensed phase. Therefore, the concentration of intermediate reactants increased during the secondary reaction. Then, the reaction rate increased, and the activation energy of Cr2O3/NC decreased under the direct control of the secondary reaction including the reaction between the condensed phase and the gaseous products or among the gaseous products. In other words, the Cr2O3 NPs could accelerate the thermal decomposition of NC.
The decomposition residue of the Cr2O3/NC composite was characterized by SEM and XRD measurements, as shown in Fig. 10a and b, respectively. Fig. 10a shows that there exists obvious aggregation in the reaction residue. The particle size (about 100 nm) of Cr2O3 showed no obvious change before and after the decomposition reaction. Most of the particles are spherical in shape, except for a few particles sticking together in clumps at elevated temperatures. Fig. 10b shows that the diffraction peaks in the pattern are indexed to the rhombohedral phase of Cr2O3 (JCPDS: 38-1479), which reveals that the vast majority of the Cr2O3/NC residues obtained after the thermal treatment are Cr2O3 powders.
Fig. 10c displays the FTIR spectra of NC, NC residue, Cr2O3/NC and Cr2O3/NC residue. The characteristic absorption peaks and the corresponding assignments are listed in Table 4. It can be seen that the quantities and varieties of the absorption peaks of NC and Cr2O3/NC are consistent in the range of 4000–400 cm−1. The Cr–O vibrational absorption bands are found in the FTIR spectrum of both Cr2O3/NC (649 and 573 cm−1) and the Cr2O3/NC residue (649 and 578 cm−1).12 Furthermore, the FTIR spectrum of the Cr2O3/NC residue shows the characteristic peaks of the –CH and C–O groups, indicating that the NC residues (Fig. 10c) exist in the Cr2O3 NPs after thermal treatment.
| NC | NC residue | Cr2O3/NC | Cr2O3/NC residue | ||||
|---|---|---|---|---|---|---|---|
| Frequency/cm−1 | Assignments | Frequency/cm−1 | Assignments | Frequency/cm−1 | Assignments | Frequency/cm−1 | Assignments |
| a υ is the stretching vibration, υs is the symmetrical stretching vibration, υas is the asymmetrical stretching vibration, δ is the bending vibration, and τ is the twisting vibration. | |||||||
| 3565 | υ(O–H) | 3429 | υ(O–H) | 3467 | υ(O–H) | 3435 | υ(O–H) |
| 2978 | υas(–CH2) | 2973 | υas(–CH2) | ||||
| 2919 | υs(–CH) | 2929 | υs(–CH) | 2908 | υs(–CH) | 2922 | υs(–CH) |
| 1654 | υas(–NO2); δ(O–H) | 1621 | δ(O–H) | 1637 | υas(–NO2); δ(O–H) | 1627 | δ(O–H) |
| 1376 | δ(–CH) | 1403 | δ(–CH) | 1382 | δ(–CH) | 1399 | δ(–CH) |
| 1279 | υs(–NO2) | 1279 | υs(–NO2) | ||||
| 1159 | υas(oxygen bridges) | 1164 | υas(oxygen bridges) | ||||
| 1122 | υas(ring) | 1111 | υas(ring) | 1122 | υas(ring) | ||
| 1067 | υ(interannular C–O) | 1062 | υ(interannular C–O) | ||||
| 1029 | υ(C–O) | 1040 | υ(C–O) | 1025 | υ(C–O) | 1045 | υ(C–O) |
| 996 | υ(C–O) | 996 | υ(C–O) | ||||
| 833 | υ(O–NO2) | 822 | υ(–NO2) | ||||
| 741 | τ(O–NO2) | 747 | τ(O–NO2) | ||||
| 681 | τ(O–NO2) | ||||||
| 649 | υ(Cr–O) | 649 | υ(Cr–O) | ||||
| 573 | υ(Cr–O) | 578 | υ(Cr–O) | ||||
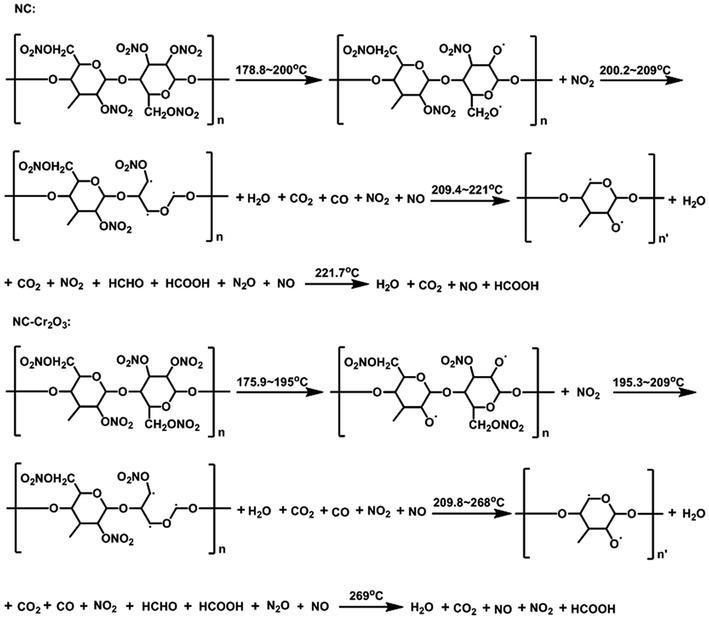
Based on the TG-FTIR analyses and literature results,34 the proposed thermal decomposition mechanism of NC and Cr2O3/NC composite has been suggested as follows (Scheme 1):
Conclusion
Herein, Cr2O3 NPs were synthesized by a sol–gel method with a shortened synthesis time when compared with the case of the reported method. The prepared Cr2O3 NPs were subsequently combined with NC to evaluate their catalytic effect. The non-isothermal decomposition kinetic studies carried out on NC and Cr2O3/NC showed that the Cr2O3 NPs could decrease the activation energy and the decomposition temperature of the thermal explosion of NC. Cr2O3 NPs were found to have good compatibility with NC and could be safely used in NC-based propellants. Through the TG-IR simultaneous analyses, we suggested that Cr2O3 NPs could accelerate the bond cleavage of NC and speed up the secondary reaction of the condensed phase. The results indicate the potential application of Cr2O3 NPs in solid propellants due to the potential catalytic effect of these NPs on the decomposition of the main components of propellants.Conflicts of interest
The authors declare that they have no conflict of interest.Acknowledgements
This work was supported by the program for the National Natural Science Foundation of China (No. 21673179) and the Opening Foundation of the State Key Laboratory of Continental Dynamics (Northwest University, No. 12LCD07).References
- T. Zhang, N. Zhao, J. C. Li, H. J. G. Gong, T. An, F. Q. Zhao and H. X. Ma, RSC Adv., 2017, 7, 23583–23590 RSC.
- Y. Zu, Y. Zhao and K. Xu, et al., Ceram. Int., 2016, 42, 18844–18850 CrossRef CAS.
- N. Zhao, J. Li and H. Gong, et al., J. Anal. Appl. Pyrolysis, 2016, 120, 165–173 CrossRef CAS.
- K. M. Parida, K. H. Reddy and S. Martha, et al., Int. J. Hydrogen Energy, 2010, 35(22), 12161–12168 CrossRef CAS.
- M. L. Grilli, E. D. Bartolomeo and E. Traversa, J. Electrochem. Soc., 2001, 148(9), H98–H102 CrossRef CAS.
- T. H. Shin, S. Ida and T. Ishihara, J. Am. Chem. Soc., 2011, 133(48), 19399–19407 CrossRef CAS PubMed.
- M. Sivakumar, A. Gedanken and W. Zhong, et al., J. Mater. Chem., 2004, 14(4), 764–769 RSC.
- S. Xiang, Z. Zhang and C. Gong, et al., Mater. Lett., 2018, 216, 1–4 CrossRef CAS.
- H. W. Liao, L. Mu, M. Zheng and Y. Y. Meng, Chin. J. Explos. Propellants, 2009, 32, 50–53 CAS.
- P. Gibot, M. Comet, A. Eichhorn, F. Schnell, O. Muller, F. Ciszek, Y. Boehrer and D. Spitzer, Propellants, Explos., Pyrotech., 2011, 36, 80–87 CrossRef CAS.
- Z. M. Yao, Z. H. Li and Y. Zhang, Studies on thermal dehydration of hydrated chromic oxide, J. Colloid Interface Sci., 2003, 266, 382–387 CrossRef CAS PubMed.
- L. Znaidi and C. Pommier, Eur. J. Solid State Inorg. Chem., 1998, 35, 405–417 CrossRef CAS.
- L. Q. Zhou, C. W. Wang, N. H. Yang, Y. G. Liang, L. J. Yuan, M. Li, J. G. Cheng and J. T. Sun, J. Wuhan Univ., Nat. Sci. Ed., 2005, 51(4), 404–410 Search PubMed.
- H. E. Kissinger, Anal. Chem., 1957, 29, 1702–1706 CrossRef CAS.
- T. Ozawa, Bull. Chem. Soc. Jpn., 1957, 38, 1881–1886 CrossRef.
- R. Z. Hu, Z. Q. Yang and Y. J. Liang, Thermochim. Acta, 1988, 123, 135–151 CrossRef.
- R. Z. Hu and Q. Z. Shi, Thermal analysis kinetics, Science Press, Beijing, 2001, pp. 127–131 Search PubMed.
- T. L. Zhang, R. Z. Hu, Y. Xie and F. P. Li, Thermochim. Acta, 1994, 244, 171–176 CrossRef CAS.
- R. Z. Hu, F. Q. Zhao, H. X. Gao and J. R. Song, Calorimetry basis and application, Science Press, Beijing, 2011, pp. 463–464 Search PubMed.
- Q. L. Yan, X. J. Li, L. Y. Zhang, J. Z. Li, H. L. Li and Z. R. Liu, J. Hazard. Mater., 2008, 160, 529–534 CrossRef CAS PubMed.
- J. Z. Li, X. Z. Fan, X. P. Fan, F. Q. Zhao and R. Z. Hu, J. Therm. Anal. Calorim., 2006, 85, 779–784 CrossRef.
- W. P. C. De Klerk, M. A. Schrader and A. C. Van der Steen, J. Therm. Anal. Calorim., 1999, 56, 1123–1131 CrossRef CAS.
- A. S. Tompa and W. F. Bryant, Thermochim. Acta, 2001, 367–368, 433–441 CrossRef CAS.
- T. An, F. Q. Zhao, H. X. Gao, H. X. Ma, H. X. Hao, J. H. Yi and Y. Yang, J. Mater. Eng., 2011, 11(23–28), 34 Search PubMed.
- Z. F. Yang, F. Q. Zhao, X. Li and J. Sichuan, Ordnance, 2015, 36(3), 141–146 Search PubMed.
- Y. Li, K. Chenxia, C. Huang and Y. Cheng, J. Therm. Anal. Calorim., 2002, 109, 171–176 CrossRef.
- Q. Dong, Infrared spectrometry, Press, Beijing, 1977, pp. 165–170 Search PubMed.
- A. Gratien, E. Nilsson, J. F. Doussin, M. S. Johnson, C. J. Nielsen, Y. Stenstrom and B. Picquet-Varrault, J. Phys. Chem. A, 2007, 111, 11506–11513 CrossRef CAS PubMed.
- A. L. Kon'Kin, B. G. Ershov, Y. M. Kargin, A. A. Chichirov and M. N. Agafonov, Russ. Chem. Bull., 1989, 38, 2426–2428 CrossRef.
- P. S. Makashir, R. R. Mahajan and J. P. Agrawal, J. Therm. Anal., 1995, 45, 501–509 CrossRef CAS.
- A. B. Shehata, M. A. Hassan and M. A. Nour, J. Hazard. Mater., 2003, 102, 121–136 CrossRef CAS PubMed.
- K. Katoh, E. Higashi, K. Nakano, S. Ito, Y. Wada, J. Kasamatsu, H. Miya, M. Yamamoto and Y. Wada, Propellants, Explos., Pyrotech., 2010, 35, 461–467 CrossRef CAS.
- J. K. Chen and T. B. Brill, Combust. Flame, 1991, 85, 479–488 CrossRef CAS.
- Y. Wang, R. Liu, B. K. Ning, Q. Pan and R. Z. Hu, Chin. J. Mater. Res., 1998, 6, 157–168 CAS.
| This journal is © The Royal Society of Chemistry 2019 |

