 Open Access Article
Co-amorphous palbociclib–organic acid systems with increased dissolution rate, enhanced physical stability and equivalent biosafety†
Man Zhang,
Xinnuo Xiong,
Zili Suo,
Quan Hou,
Na Gan,
Peixiao Tang *,
Xiaohui Ding and
Hui Li
 *
*
School of Chemical Engineering, Sichuan University, Chengdu, Sichuan 610065, China. E-mail: lihuilab@sina.com; tangpeixiao@126.com; Fax: +86 028 85401207; Tel: +86 026 85405220
First published on 29th January 2019
Abstract
The preparation of co-amorphous drug systems by adding a small molecular excipient is a promising formulation in the modern pharmaceutical industry to improve the solubility, dissolution rate, and bioavailability of poorly soluble drugs. In this study, palbociclib co-amorphous systems with organic acids (succinic, tartaric, citric, and malic acid) at molar ratios of 1![[thin space (1/6-em)]](https://www.rsc.org/images/entities/char_2009.gif) :
:![[thin space (1/6-em)]](https://www.rsc.org/images/entities/char_2009.gif) 1 were prepared by co-milling and characterized by differential scanning calorimetry (DSC), fourier transform infrared spectroscopy (FTIR) and solid-state nuclear magnetic resonance (SS-NMR). These solid-state investigations have confirmed the formation of co-amorphous salts between PAL and organic acids. The solubility, dissolution rate and stability of the four co-amorphous drug systems were significantly improved compared with these of crystalline and amorphous palbociclib. The biosafety of the co-amorphous drug systems was the same as that of palbociclib without affecting the efficacy of the drug and eliciting toxic side effects. These comprehensive approaches for the palbociclib–acid co-amorphous drug systems provided a theoretical basis for its clinical applications.
1 were prepared by co-milling and characterized by differential scanning calorimetry (DSC), fourier transform infrared spectroscopy (FTIR) and solid-state nuclear magnetic resonance (SS-NMR). These solid-state investigations have confirmed the formation of co-amorphous salts between PAL and organic acids. The solubility, dissolution rate and stability of the four co-amorphous drug systems were significantly improved compared with these of crystalline and amorphous palbociclib. The biosafety of the co-amorphous drug systems was the same as that of palbociclib without affecting the efficacy of the drug and eliciting toxic side effects. These comprehensive approaches for the palbociclib–acid co-amorphous drug systems provided a theoretical basis for its clinical applications.
1. Introduction
Approximately 40% of marketed drugs and 75% of clinical research drugs exhibit limited water solubility,1,2 which severely limits the absorption of drugs and increases the side effects of oral drugs.3–5 Polymer is usually added to prepare an amorphous solid dispersion, increasing the dissolution rate and stability of the amorphous drug.6 Nevertheless, this technique has considerable drawbacks; for instance, the hygroscopicity of many polymers and the limited miscibility of drugs to polymers increases the volume and weight of formulations.7–9 Using small molecular ligands to prepare co-amorphous systems rather than drug–polymer combinations has gained considerable interest in the pharmaceutical field.10–12 Co-amorphous drug systems are composed of a fixed stoichiometric ratio of API and other small-molecule solid substances (organic acids, amino acids, or drugs) that forming a homogeneous single-phase solid formulation.13–15 An active drug and a ligand may interact via ionic bonds, hydrogen bonds, or other noncovalent bonds, which overcomes the disadvantages of amorphous drugs that it easily crystallizes, thereby improving the physical properties of drugs.16–18 For example, ionic interactions in indomethacin–arginine co-amorphous system remarkably enhanced the intrinsic dissolution rate and physical stability relative to amorphous indomethacin.19 Tryptophan bound to carbamazepine via hydrogen bonding and π–π interaction.20 Meanwhile, co-amorphous can improve the drug release properties through the precipitation of drug rich phase of nano/micro dimensions.21 Since co-amorphous drug systems show an improvement in supersaturation ability, it is a promising drug system for increasing the solubility of poorly soluble drugs and stabilizing amorphous drugs.22–24Palbociclib (PAL, Fig. 1A) is the first highly selective inhibitor of CDK4/6 approved by the FDA in treating advanced breast cancer.25 PAL inhibits not only the proliferation of breast cancer cells in combination with letrozole but also the proliferations of human hepatocellular carcinoma cells, colon cancer, and mantle cell lymphoma.26 As a heavyweight drug for breast cancer, the effectiveness of oral PAL monotherapy is greatly reduced, and its toxic side effects are increased because of its low solubility and poor bioavailability.27,28 Unfortunately, there has not been published any peer reviewed study on solid state forms of PAL such as polymorphs and amorphous solid dispersions in the current research.
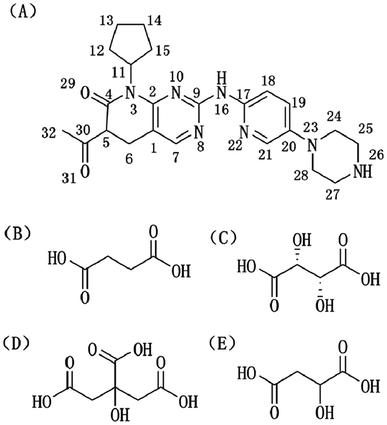 | ||
| Fig. 1 Molecular structures of (A) palbociclib (PAL), (B) succinic acid (SUC), (C) L-tartaric acid (TAR), (D) citric acid anhydrous (CIT), and (E) D,L-malic acid (MAL). | ||
In recent years, research on co-amorphous system has focused on the structural characterization, solubility, and dissolution properties.29 Few reports had confirmed the formation of co-amorphous salts between weakly basic APIs and acidic excipients and evaluated the biosafety of co-amorphous formulation compared to the existing formulation in this field. This paper aims to study the co-amorphous drug systems from the perspective of bonding performance and biosafety. Four co-amorphous drug systems of PAL and organic acids (succinic, tartaric, citric, and malic acid, Fig. 1B–E) were prepared by co-milling and performed DSC, IR, and SS-NMR to explore the intermolecular bonding properties between PAL and organic acids. The biosafety of the four co-amorphous drug systems was assessed through cytotoxicity experiments. The effects of the addition of several organic acids on normal kidney cells, normal breast cells, and breast cancer cells were evaluated. These researches on the co-amorphous systems presented a safe and effective formulation technology for the development of new PAL solid forms with great dissolution rates, good physical stability, and high bioavailability.
2. Experiments and methods
2.1 Materials
The main drug crystalline PAL (>98%, ρ0 = 1.313 g cm−3) was obtained from Chemsky International Co., Ltd. (Shanghai, China). Succinic acid (SUC, ρ1 = 1.572 g cm−3), L-tartaric acid (TAR, ρ2 = 1.76 g cm−3), citric acid anhydrous (CIT, ρ3 = 1.542 g cm−3), and D,L-malic acid (MAL, ρ4 = 1.601 g cm−3) were purchased from Kelong Company, Ltd. (Chengdu, China). All of the reagents were of analytical grade. Millipore water was used in the cell experiments.2.2 Preparation of co-amorphous and physical mixtures
Co-amorphous of PAL–acids systems (SUC, TAR, CIT, MAL) were prepared by co-milling in a ball mill (LNMN-QM 0.4L, Heishan Xinlitun Agate Handicrafts Co., Ltd. China) for 4 hours at 25 °C. A total mass of 1 g of the PAL and four organic acid at molar ratios of 1![[thin space (1/6-em)]](https://www.rsc.org/images/entities/char_2009.gif) :
:![[thin space (1/6-em)]](https://www.rsc.org/images/entities/char_2009.gif) 1 were placed into four agate balls jars (50 cm3) containing 10 agate balls (∅ = 10 mm) and 30 agate balls (∅ = 3 mm). Amorphous PAL was prepared by milling crystalline PAL for 6 hours. The rotation speed of the solar disk was set to 574 rpm, and alternate co-milling periods (typically 10 min) with pause periods (typically 2 min) were applied to limit the mechanical heating of the sample.
1 were placed into four agate balls jars (50 cm3) containing 10 agate balls (∅ = 10 mm) and 30 agate balls (∅ = 3 mm). Amorphous PAL was prepared by milling crystalline PAL for 6 hours. The rotation speed of the solar disk was set to 574 rpm, and alternate co-milling periods (typically 10 min) with pause periods (typically 2 min) were applied to limit the mechanical heating of the sample.
Physical Mixtures (PM) were prepared by geometric mixing of crystalline PAL with each acid in 1![[thin space (1/6-em)]](https://www.rsc.org/images/entities/char_2009.gif) :
:![[thin space (1/6-em)]](https://www.rsc.org/images/entities/char_2009.gif) 1 molar ratio using a motor and pestle for a few minutes.
1 molar ratio using a motor and pestle for a few minutes.
2.3 Analytical techniques
 | (1) |
 | (2) |
2.4 Solubility and dissolution studies
UV-vis spectrophotometer (TU-1901, Peking General Instrument, China) was used to estimate the supersaturation solubility profile. To estimate dissolution kinetics, supersaturated solutions were prepared by adding a large excess of the samples to phosphate buffer (pH = 6.8). The solutions were stirred at 37 °C for a specified amount of time. Each sample was filtered through a 0.45 μm syringe, immediately diluted and concentration was estimated using UV-vis spectroscopy. Powder dissolution studies were conducted in triplicate and the average values have been reported.Co-amorphous dissolution experiments were conducted using a ZRC-8D dissolution tester (Chuangxing, Tianjin, China) at 100 rpm and 37 ± 0.5 °C (paddle). Powder samples containing 75 mg of PAL equivalent were introduced to the dissolution medium of 900 mL (pH = 6.8 phosphate buffer solution). Then, 5 mL of the eluted sample was withdrawn at 2, 5, 10, 15, 30, 45, 60, 120, 180, and 240 min, filtered through a 0.45 μm syringe, and supplemented with 5 mL of phosphate buffer solution in a buffer vessel. At least triplicate samples were used for each measurement.
2.5 Physical stability test
The stability of the form was investigated at 40 °C under relative humidity (RH) levels of 32%, 57%, and 75%, which were achieved with the saturated salt solutions of MgCl2, NaBr, and NaCl in desiccators, respectively. The samples were repeatedly analyzed through XRD at 3, 15, 30, and 90 days.2.6 Cytotoxicity evaluation
The cytotoxicity of PAL and PAL–acid co-amorphous systems on breast cancer cells (MDA-MB-453, MCF-7), normal breast cells (MCF-10A), and renal epithelial cells (293T) were detected through MTT assay. After the cells were cultured in the logarithmic growth phase at a seeding density of 3.0 × 10³–5.0 × 10³ cells per well for 24 h in a 96-well plate, the drug of the specified concentration gradient (DMSO dissolution, medium dilution) was added, and the test was repeated thrice. The cells were cultured in an incubator at 37 °C, 5% CO2, and saturated humidity for 48 h. Afterward, 20 μL of MTT (5 mg mL−1) was added to each well. The specimens were further incubated at 37 °C for 4 h, the medium was carefully aspirated, 150 μL of DMSO was added to each well to dissolve the purple crystals, and the shaker was slowly shaken to dissolve the crystals sufficiently. Absorbance at 492 nm was obtained using a microplate reader (Molecular Devices, USA).3. Results and discussion
3.1 Preparation of co-amorphous drug systems
We recorded peak changes at various milling times by XRD measurements (Fig. 2). The diffraction peaks of the four systems and PAL itself gradually weaken as the milling time increases, eventually becoming an amorphous halo. However, the four ligand organic acids remained crystalline during the corresponding milling time. The phenomenon initially indicated the formations of amorphous PAL and PAL–acid co-amorphous mixtures (CM). We utilized four organic acids: succinic (SUC), tartaric (TAR), citric (CIT), and malic acid (MAR) to increase the stability of amorphous PAL. The pKa1 and ΔpKa values of the acids are summarized in Table 1. According to the empirical pKa rule, the salt formation can be distinguished from the co-crystals when the ΔpKa (pKa(base) − pKa(acid)) is greater than 3.32,33 Since the pKa values are reflections in the aqueous solution,34 it is difficult to accurately assess molecular interactions of PAL–acid co-amorphous systems based on ΔpKa values.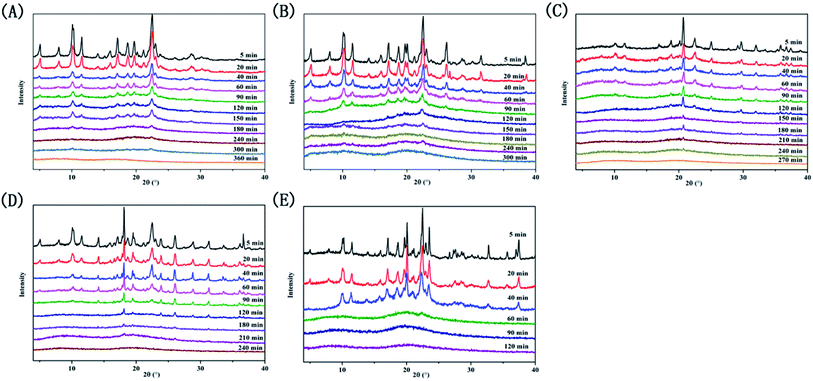 | ||
| Fig. 2 X-ray powder diffraction patterns at selected time intervals. (A) PAL, (B) PAL–SUC CM, (C) PAL–TAR CM, (D) PAL–CIT CM, and (E) PAL–MAL CM. | ||
3.2 Micromorphology analysis
The micromorphological characteristics and particle size of the amorphous samples at μm scale were observed through scanning electron microscopy. The crystalline and amorphous PAL presented regular prismatic or rod-like structures (Fig. 3a and b). The columnar structure was more favorable for the mixing uniformity of PAL with organic acids than the tabular structure. Amorphous PAL showed needle morphology at a magnification of 20![[thin space (1/6-em)]](https://www.rsc.org/images/entities/char_2009.gif) 000×. This structure was much smaller than that of crystalline PAL. Four free organic acids appeared in large block morphology at a 100 μm magnification scale (Fig. S3†). Compared with amorphous PAL, the micromorphological of four co-amorphous had changed. The block structures of the four co-amorphous particles were larger than PAL, and the surface of the former was smoother than that of the latter (Fig. 3c–f).
000×. This structure was much smaller than that of crystalline PAL. Four free organic acids appeared in large block morphology at a 100 μm magnification scale (Fig. S3†). Compared with amorphous PAL, the micromorphological of four co-amorphous had changed. The block structures of the four co-amorphous particles were larger than PAL, and the surface of the former was smoother than that of the latter (Fig. 3c–f).
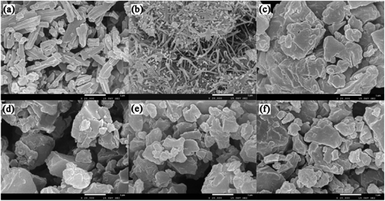 | ||
Fig. 3 SEM images of powder sample: (a) crystalline PAL, (b) amorphous PAL, (c) PAL–SUC CM, (d) PAL–TAR CM, (e) PAL–CIT CM, and (f) PAL–MAL CM. The images were magnified at 20![[thin space (1/6-em)]](https://www.rsc.org/images/entities/char_2009.gif) 000×. 000×. | ||
3.3 Thermal analysis
The Gordon–Taylor equation assumes that no specific interaction occurs between the two molecules.20 Consequently, the deviation between the experimental Tg value and the theoretical Tg value represents the intensity of the molecular interaction. The determination of the glass transition temperature (Tg) of the co-amorphous systems is a reliable method to evaluate intermolecular interaction.7,8Unfortunately, the amorphization of four organic acids were not obtained by ball milling (Fig. S2†) and only the Tg value of CIT was reported as 11 °C, which resulted in the difficulty of predicting the Tg of co-amorphous systems.2 In case of co-amorphous PAL–SUC, PAL–TAR, and PAL–MAL, it assumed that the Tg values of the organic acid were equal to 0.67 × Tm (melting point) according to the empirical formula.35 Although this formula was incompletely accurate, it provided a basis for calculating Tg values of acid and then calculated the Tg value of co-amorphous system.36 The calculated Tg values of SUC, TAR, and MAL were 37, 24, and −2 °C, respectively.
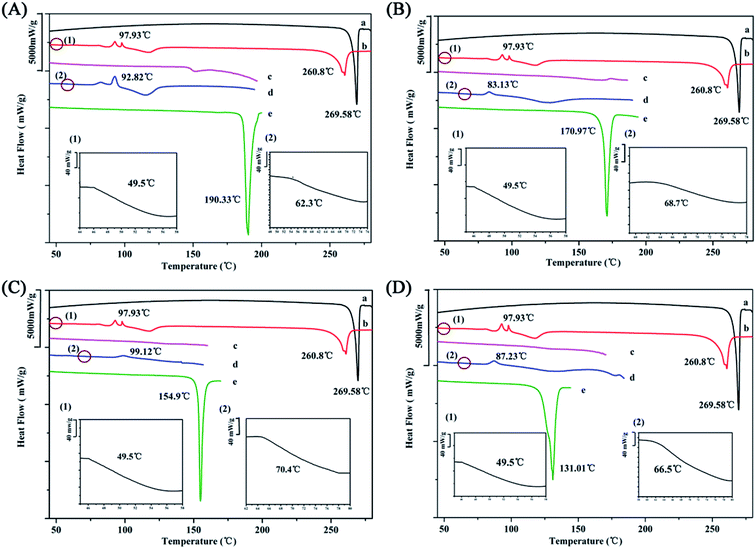
The experimental Tg value of amorphous PAL was approximately 50 °C, whereas the addition of the four organic acids led to a significant increase in Tg values of the co-amorphous systems (Fig. 4 and Table 2). The experimental Tg value of co-amorphous PAL–CIT was 70 °C, much higher than the calculated one. When ΔTg (experimental Tg value − theoretical Tg value) was higher, stronger interactions, such as ionic bonds, may exist between drugs molecules and organic acid molecules.34 Meanwhile, the experimental Tg values of the other three systems were also higher than the calculated ones. ΔTg values predicted the formation of co-amorphous salts between PAL and organic acids in these four systems. This strong electrostatic interaction between PAL and the acid molecules greatly interfered with the short-range order of the amorphous PAL molecule and consequently inhibited the tendency of the PAL–acid co-amorphous to recrystallize.
| Experimental Tg (°C) | Calculated Tg (°C) | ΔTg (°C) | |
|---|---|---|---|
| PAL | 49 ± 1.8 | — | — |
| PAL–SUC | 62.3 ± 1.4 | 47 | 15 |
| PAL–TAR | 68.7 ± 0.9 | 41 | 27 |
| PAL–CIT | 70.4 ± 0.8 | 25 | 45 |
| PAL–MAL | 66.5 ± 1.2 | −11 | 77 |
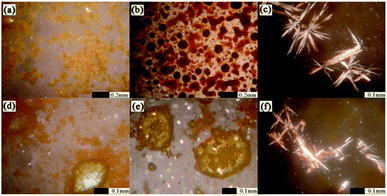
HSM was applied to monitor the recrystallization of amorphous PAL and co-amorphous products.37,38 As shown in Fig. 5, amorphous PAL recrystallized at approximately 100 °C and began to melt at 250 °C, which was consistent with the DSC result in Fig. 4 (98 °C for recrystallization and 260 °C for melting). The birefringence observed in the four co-amorphous forms of HSM at 80–100 °C corresponded to the recrystallization peak in DSC (Fig. 5c–f). However, only PAL–SUC and PAL–MAL systems clearly showed the obvious needle crystalline forms under HSM. The co-amorphous PAL–TAR and PAL–CIT observed in HSM became yellow needle-like or block near the recrystallization temperature compared with that in the absence of refraction at 40 °C (Fig. S4†). The results showed that the co-amorphous samples were easily converted into crystals when the temperature was higher than 80 °C because amorphous PAL and co-amorphous PAL–acid in high-energy states lack a long-range disordered structure, which absorbed energy during heating, and the disorderly molecular orientation moves for recrystallization.39
3.4 Spectroscopic characterization
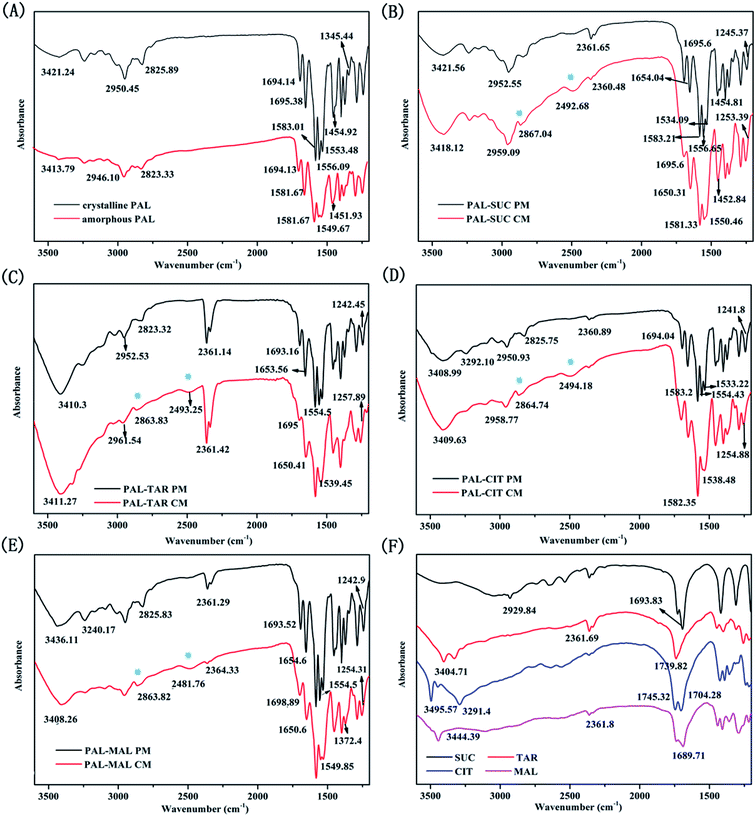
The bonding properties between PAL and four organic acids were characterized through FTIR and SS-NMR. The results are shown in Fig. 6 and 7. No significant change was observed in the carbonyl vibration in the 1900–1650 cm−1 region of the IR spectra. As such, the N–H stretching region was mainly compared in these four systems. The N–H stretching of pure amorphous PAL exhibited a bathochromic shift from 3421.24 cm−1 to 3413.79 cm−1, whereas the N–H bending vibration (at 1556.09 and 1553.48 cm−1 in the crystalline PAL) merged and shifted to 1549.67 cm−1 (Fig. 6A). Co-amorphous PAL–SUC had a broad peak at 2492.68 cm−1 and a sharp peak at 2867.04 cm−1 compared with its physical mixture. The same peak changes were observed in PAL–TAR, PAL–CIT, PAL–MAL co-amorphous systems, whereas these shifts were not detected in the corresponding physical mixtures (Fig. 6B–E). The appearances of these new peaks around 2490 and 2860 cm−1 were attributed to the stretching vibration of amine salt. These findings confirmed the formation of co-amorphous salts between PAL and the organic acids.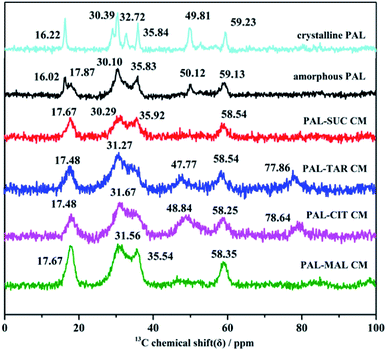 | ||
| Fig. 7 Solid-state 13C NMR spectra of crystalline PAL, amorphous PAL, and four co-amorphous PAL–acid systems (CM). | ||
Molecular interactions between PAL and four organic acids were further investigated through SS-NMR. Amorphous samples were broader than crystalline PAL and PAL–acid physical mixtures because of a wide range of molecular orientations. No significant shifts were observed in the four co-amorphous 4C and 30C of carbonyl groups, and the 9C on the pyrimidine ring (corresponding to crystalline PAL 165.86, 205.71, and 161.86 ppm, respectively, Fig. S5†). Therefore, the most potential site in PAL was 26N located in piperazine ring, and the strength of the PAL–acid interaction was determined by studying the displacement of 24C–25C.
The studied amorphous solids corresponding to the crystalline samples with 29–36 ppm multiple peaks on SS-NMR broadened and merged into one or two peaks with a small shift because of the anisotropy of chemical shift and the interaction between amorphous molecules. The chemical shifts of 24C in the four PAL–acid PM were approximately 59.42 ppm, which corresponded to the resolved peak in crystalline PAL observed at 59.23 ppm. This peak in PAL–acid CM had a change in the chemical shift of 1.0–0.7 ppm, moving to approximately 58.35 ppm (Fig. 7). The protonation of 26N increased the shielding effect on the piperazine ring, thereby exhibiting a slight variation. The results of SS-NMR further confirmed that the four co-amorphous drug systems were the structure of co-amorphous salts. 1H NMR spectra of the samples proved that actual chemical composition of the co-amorphous particles is the salt of the drug PAL and the acid at a molar ratio of 1![[thin space (1/6-em)]](https://www.rsc.org/images/entities/char_2009.gif) :
:![[thin space (1/6-em)]](https://www.rsc.org/images/entities/char_2009.gif) 1 (Fig. S6†).
1 (Fig. S6†).
3.5 Solubility and dissolution rate tests
Since the PAL–acid co-amorphous drug systems were developed to increase its aqueous solubility, powder dissolution studies and dissolution rate experiments were conducted. Four co-amorphous systems had the desired spring and parachute supersaturation profile, in the absence of crystallisation inhibitors. A crystallization behavior involves the development of supersaturation, nucleation and the subsequent.17 The concentration of the drug in the supersaturated solution is much greater than its solubility, which may cause the reprecipitation of dissolved drug in dissolution medium.23 Just as expected, crystalline PAL had a slow and low dissolution in pH = 6.8 buffer solution, and the supersaturation solubility after 24 h was only 35.27 μg mL−1 (Fig. 8A). For amorphous PAL, its supersaturated dissolution profile showed that the maximum solubility was 181.53 μg mL−1 after 15 min and then the dissolution began to fall. It was possible that the amorphous PAL may gradually recrystallize for 15 min, and then transform into the crystalline drug itself after one hour. Fig. 8A showed that the co-amorphous PAL–SUC reached the highest level of supersaturation (1034.06 μg mL−1) after 5 minutes. Meanwhile, The supersaturated dissolution profile of the other three co-amorphous systems was also significantly higher than the API itself.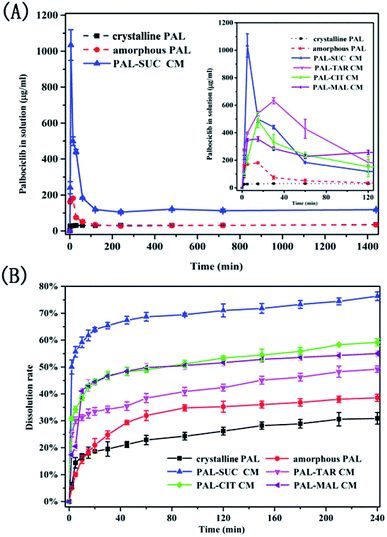 | ||
| Fig. 8 Supersaturated dissolution profile (A) and dissolution rate curves (B) of crystalline PAL, amorphous PAL, and PAL–acid CM. | ||
It could be seen from Fig. 8B that the drug dissolved approximately 31% for crystalline PAL and 38% for amorphous PAL after 4 h. Four co-amorphous forms showed faster dissolution rates and higher cumulative dissolutions compared with the crystalline PAL. Among them, PAL–SUC displayed the most fast dissolution rate which released 50% of the drug within 2 min. Moreover, the cumulative dissolution of PAL–SUC after 4 h was 76%, representing a greater than 2-fold increase than that of amorphous PAL (Fig. 8B). The improvement in the dissolution rates of the co-amorphous system were attributed to co-amorphous salts between PAL and acid, since corresponding PAL–acid physical mixtures had a similar dissolution rate as crystalline PAL (Fig. S7†). These results suggested that four co-amorphous systems had solubility and dissolution advantages while PAL–SUC showed optimal properties and it might be in favour of its oral bioavailability.
3.6 Physical stability
This study explored the effects of temperature and humidity on amorphous PAL and co-amorphous PAL–acid. The pure amorphous PAL converted to crystalline state at 40 °C for 3 days (Fig. 9B, S8 and S9†). Co-amorphous PAL–SUC and PAL–MAL systems maintained an amorphous halo after 3 months under accelerated conditions (40 °C, 75% RH), while co-amorphous PAL–TAR and PAL–CIT had a tendency to recrystallize after half a month (Fig. 9C–F). Four co-amorphous samples were stable at 40 °C storage conditions. The stability test under 40 °C temperature and various humidity conditions revealed that co-amorphous PAL–acid forms were more stable than amorphous PAL. Among them, co-amorphous PAL–SUC and PAL–MAL were more stable systems. The stabilizing effect of organic acids on amorphous drugs may due to the interaction of carboxylic acid groups with drugs, thereby interfering with the interaction between drug molecules and enhancing the stability of systems.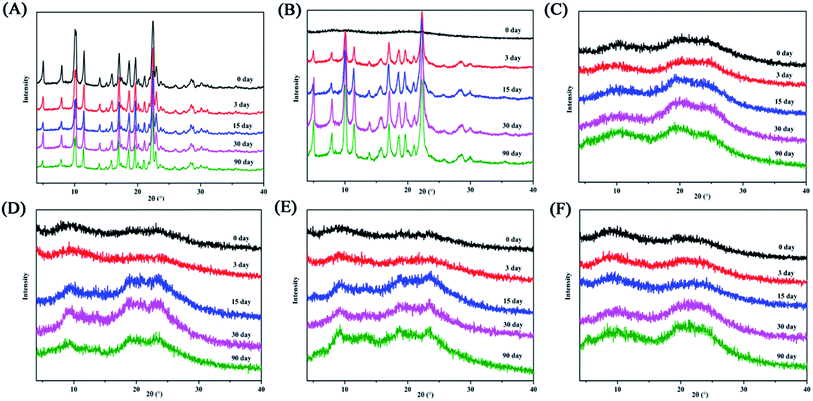 | ||
| Fig. 9 XRD diffractograms for (A) crystalline PAL, (B) amorphous PAL, (C) PAL–SUC CM, (D) PAL–TAR CM, (E) PAL–CIT CM, and (F) PAL–MAL CM stored at 40 °C/RH 75% over a specified period. | ||
3.7 Cytotoxicity evaluation
In view of biosafety considerations, we investigated the toxic effects of the co-amorphous drug system on the cells and the drug efficacy, although the four organic acids used in co-amorphous systems are recognized as safer ligands. We utilized two breast cancer cells and two normal cells to explore a co-amorphous biosafety. The effects of the addition of several organic acids on normal kidney cells, normal breast cells, and breast cancer cells were evaluated. Four ligand acids did not influence the growth of cells. The results of cell experiments with four small molecule ligands also demonstrated that the four organic acids used in the co-amorphous drug systems had no toxic side effects on normal cells and breast cancer cells (Fig. S10†).From Fig. 10A and B, the inhibition rate on MDA-MB-453 cells was higher than that of MCF-7 cells, and the addition of organic acid did not change the PAL efficacy on breast cancer cells. The co-amorphous systems had an equivalent inhibition rate for cancer cells compared with that of the drug substance. PAL formed three hydrogen bonds between 8N, 16N with CDK6-cyclin V101 and 31C![[double bond, length as m-dash]](https://www.rsc.org/images/entities/char_e001.gif) O with DFG-D163 N–H to inhibit cancer cell growth,25 the co-amorphous forms displayed an ionic bond between 26N on the piperazine ring with a carboxyl group in acid. The action sites of the pharmacophore and the co-amorphous binding are inconsistent, thereby the formation of the co-amorphous salt did not affect the drug effect, which was also proved by cell experiments. Meanwhile, the studied samples were not cytotoxic to normal breast cancer cells (MCF-10A) and renal epithelial cells (293T) (Fig. 10C and D).
O with DFG-D163 N–H to inhibit cancer cell growth,25 the co-amorphous forms displayed an ionic bond between 26N on the piperazine ring with a carboxyl group in acid. The action sites of the pharmacophore and the co-amorphous binding are inconsistent, thereby the formation of the co-amorphous salt did not affect the drug effect, which was also proved by cell experiments. Meanwhile, the studied samples were not cytotoxic to normal breast cancer cells (MCF-10A) and renal epithelial cells (293T) (Fig. 10C and D).
Overall, the results demonstrated that the biosafety of the co-amorphous systems was the same as that of PAL without affecting the efficacy of the drug and without eliciting toxic side effects.
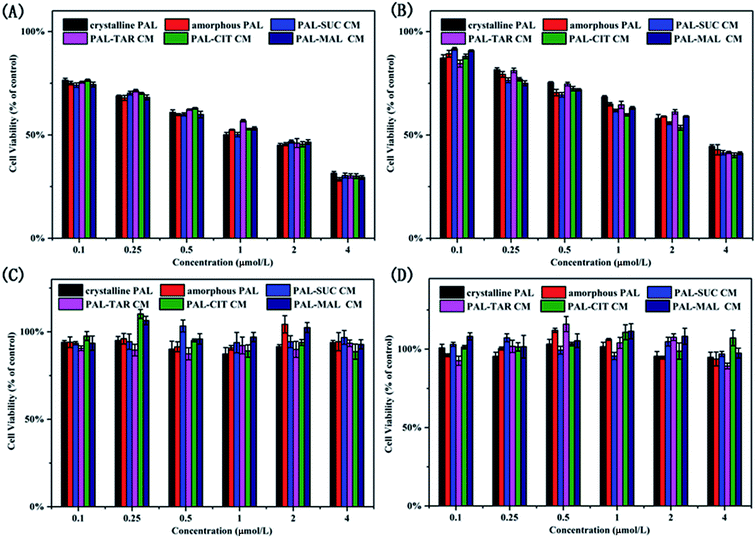 | ||
| Fig. 10 Proliferation inhibition of (A) MDA-MB-453, (B) MCF-7, (C) MCF-10A, and (D) 293T treated with crystalline PAL, amorphous PAL, and PAL–acid CM. | ||
4. Conclusion
In this study, four PAL–acid co-amorphous systems were successfully prepared by co-milling and characterized through XRD, SEM, DSC, HSM, FTIR, and SS-NMR. Our results revealed that ionic bond interaction existed between PAL and four organic acids. Crystalline PAL had a low dissolution and the supersaturation solubility after 24 h was only 35.27 μg mL−1, while the co-amorphous PAL–SUC reached the highest level of supersaturation (1034.06 μg mL−1) after 5 minutes. The solubility and dissolution rate of the co-amorphous PAL–acid systems were higher than that of the crystalline and amorphous PAL forms, and it might be in favour of its oral bioavailability. The stability of four co-amorphous systems was greatly improved under various temperature and humidity conditions compared with the extremely unstable amorphous PAL. The biosafety of the co-amorphous forms was similar to that of PAL. Cytotoxicity experiments explored the effect of adding small molecules on cell inhibition rate. PAL–acid co-amorphous drug systems did not elicit toxic side effects on 293T and MCF-10A and did not affect the efficacy of the PAL on MDA-MB-453 and MCF-7. Four organic acids could be used as the promising excipients to optimize drug properties, and the biosafety of the co-amorphous systems was the same as that of PAL. These comprehensive investigations for the PAL–acid co-amorphous drug systems developed a safe and effective formulation technology, providing a promising approach to improve the dissolution rate of crystalline drugs and the stability of amorphous drugs.Conflicts of interest
There are no conflicts to declare.Acknowledgements
This work was supported by the Applied Basic Research Project of Sichuan Province (Grant No. 2014JY0042). We are grateful to the Analytical Testing center of Sichuan University for providing solid nuclear magnetic and scanning electron microscopy.Notes and references
- K. Xu, S. Zheng, L. Guo, S. Li, L. Wang, P. Tang, J. Yan, D. Wu and H. Li, RSC Adv., 2015, 5, 96392–96403 RSC.
- H. Ueda, W. Wu, K. Lobmann, H. Grohganz, A. Mullertz and T. Rades, Mol. Pharmaceutics, 2018, 15, 2036–2044 CrossRef CAS PubMed.
- A. Newman, S. M. Reutzel-Edens and G. Zografi, J. Pharm. Sci., 2018, 107, 5–17 CrossRef CAS PubMed.
- K. Xu, S. Zheng, L. Guo, S. Li, L. Wang, P. Tang, J. Yan, D. Wu and H. Li, RSC Adv., 2015, 5, 96392–96403 RSC.
- P. Tang, Q. Sun, L. Zhao, H. Pu, H. Yang, S. Zhang, R. Gan, N. Gan and H. Li, Carbohydr. Polym., 2018, 198, 418–425 CrossRef CAS PubMed.
- S. Mohapatra, S. Samanta, K. Kothari, P. Mistry and R. Suryanarayanan, Cryst. Growth Des., 2017, 17, 3142–3150 CrossRef CAS.
- K. Lobmann, H. Grohganz, R. Laitinen, C. Strachan and T. Rades, Eur. J. Pharm. Biopharm., 2013, 85, 873–881 CrossRef CAS PubMed.
- K. Lobmann, R. Laitinen, H. Grohganz, K. C. Gordon, C. Strachan and T. Rades, Mol. Pharmaceutics, 2011, 8, 1919–1928 CrossRef CAS PubMed.
- R. Ojarinta, A. T. Heikkinen, E. Sievanen and R. Laitinen, Eur. J. Pharm. Biopharm., 2017, 112, 85–95 CrossRef CAS PubMed.
- R. B. Chavan, R. Thipparaboina, D. Kumar and N. R. Shastri, Int. J. Pharm., 2016, 515, 403–415 CrossRef CAS PubMed.
- H. Ueda, N. Muranushi, S. Sakuma, Y. Ida, T. Endoh, K. Kadota and Y. Tozuka, Pharm. Res., 2016, 33, 1018–1029 CrossRef CAS PubMed.
- I. Petry, K. Lobmann, H. Grohganz, T. Rades and C. S. Leopold, Eur. J. Pharm. Biopharm., 2018, 133, 151–160 CrossRef CAS PubMed.
- Y. Pan, W. Pang, J. Lv, J. Wang, C. Yang and W. Guo, J. Pharm. Biomed. Anal., 2017, 138, 302–315 CrossRef CAS PubMed.
- J. M. Skieneh, I. Sathisaran, S. V. Dalvi and S. Rohani, Cryst. Growth Des., 2017, 17, 6273–6280 CrossRef CAS.
- L. Arnfast, M. Kamruzzaman, K. Lobmann, J. Aho, S. Baldursdottir, T. Rades and J. Rantanen, Pharm. Res., 2017, 34, 2689–2697 CrossRef CAS PubMed.
- R. Laitinen, K. Lobmann, H. Grohganz, C. Strachan and T. Rades, Mol. Pharmaceutics, 2014, 11, 2381–2389 CrossRef CAS PubMed.
- J. Wang, R. Chang, Y. Zhao, J. Zhang, T. Zhang, Q. Fu, C. Chang and A. Zeng, AAPS PharmSciTech, 2017, 18, 2541–2550 CrossRef CAS PubMed.
- S. Qian, W. Heng, Y. Wei, J. Zhang and Y. Gao, Cryst. Growth Des., 2015, 15, 2920–2928 CrossRef CAS.
- M. Fung, K. R. Be Rzins and R. Suryanarayanan, Mol. Pharmaceutics, 2018, 15, 1862–1869 CrossRef CAS PubMed.
- S. J. Dengale, H. Grohganz, T. Rades and K. Lobmann, Adv. Drug Delivery Rev., 2016, 100, 116–125 CrossRef CAS PubMed.
- V. Sai Krishna Anand, S. D. Sakhare, K. S. Navya Sree, A. R. Nair, K. Raghava Varma, K. Gourishetti and S. J. Dengale, Eur. J. Pharm. Sci., 2018, 123, 124–134 CrossRef CAS PubMed.
- Y. Bi, D. Xiao, S. Ren, S. Bi, J. Wang and F. Li, J. Pharm. Sci., 2017, 106, 3150–3155 CrossRef CAS PubMed.
- Y. Gao, J. Liao, X. Qi and J. Zhang, Int. J. Pharm., 2013, 450, 290–295 CrossRef CAS PubMed.
- G. Kasten, H. Grohganz, T. Rades and K. Lobmann, Eur. J. Pharm. Sci., 2016, 95, 28–35 CrossRef CAS PubMed.
- R. Roskoski Jr, Pharmacol. Res., 2016, 107, 249–275 CrossRef PubMed.
- Y. Katsumi, T. Iehara, M. Miyachi, S. Yagyu, S. Tsubai-Shimizu, K. Kikuchi, S. Tamura, Y. Kuwahara, K. Tsuchiya, H. Kuroda, T. Sugimoto, P. J. Houghton and H. Hosoi, Biochem. Biophys. Res. Commun., 2011, 413, 62–68 CrossRef CAS PubMed.
- A. Ruiz-Garcia, A. Plotka, M. O'Gorman and D. D. Wang, Cancer Chemother. Pharmacol., 2017, 79, 527–533 CrossRef CAS PubMed.
- W. Sun, K. J. Klamerus, L. M. Yuhas, S. Pawlak, A. Plotka, M. O'Gorman, L. Kirkovsky, M. Kosa and D. Wang, Cancer Chemother. Pharmacol., 2017, 6, 614–626 CAS.
- J. Mishra, K. Lobmann, H. Grohganz and T. Rades, Int. J. Pharm., 2018, 552, 407–413 CrossRef CAS PubMed.
- M. K. Riekes, A. Engelen, B. Appeltans, P. Rombaut, H. K. Stulzer and G. Van den Mooter, Pharm. Res., 2016, 33, 1259–1275 CrossRef CAS PubMed.
- J. A. Baird and L. S. Taylor, Adv. Drug Delivery Rev., 2012, 64, 396–421 CrossRef CAS PubMed.
- B. Swapna and A. Nangia, Cryst. Growth Des., 2017, 17, 3350–3360 CrossRef CAS.
- L. Orola, I. Sarcevica, A. Kons, A. Actins and M. V. Veidis, J. Mol. Struct., 2014, 1056–1057, 63–69 CrossRef CAS.
- M. H. Fung, M. DeVault, K. T. Kuwata and R. Suryanarayanan, Mol. Pharmaceutics, 2018, 15, 1052–1061 CrossRef CAS PubMed.
- D. Elliott, R. Dawson, W. Elliott and K. Jones, Data for biochemical research, Clarendon Press, Oxford, 1959, p. 221 Search PubMed.
- S. M. Moinuddin, S. Ruan, Y. Huang, Q. Gao, Q. Shi, B. Cai and T. Cai, Int. J. Pharm., 2017, 532, 393–400 CrossRef CAS PubMed.
- Z. Zhou, H. M. Chan, H. H. Sung, H. H. Tong and Y. Zheng, Pharm. Res., 2016, 33, 1030–1039 CrossRef CAS PubMed.
- B. Zhu, J.-R. Wang and X. Mei, Cryst. Growth Des., 2015, 15, 4959–4968 CrossRef CAS.
- J. Sibik, K. Lobmann, T. Rades and J. A. Zeitler, Mol. Pharmaceutics, 2015, 12, 3062–3068 CrossRef CAS PubMed.
Footnote |
| † Electronic supplementary information (ESI) available. See DOI: 10.1039/c8ra09710k |
| This journal is © The Royal Society of Chemistry 2019 |

