 Open Access Article
Fragment-centric topographic mapping method guides the understanding of ABCG2-inhibitor interactions†
Yao Wua,
Xin-Ying Gaoa,
Xin-Hui Chena,
Shao-Long Zhangb,
Wen-Juan Wanga,
Xie-Huang Sheng *a and
De-Zhan Chen
 *a
*a
aCollege of Chemistry, Chemical Engineering and Materials Science, Collaborative Innovation Centre of Functionalized Probes for Chemical Imaging in Universities of Shandong, Key Laboratory of Molecular and Nano Probes, Ministry of Education, Shandong Provincial Key Laboratory of Clean Production of Fine Chemicals, Shandong Normal University, Jinan 250014, P. R. China
bCollege of Physics and Electronics, Shandong Normal University, Jinan 250014, P. R. China. E-mail: shengxiehuang@sdnu.edu.cn; dchen@sdnu.edu.cn
First published on 8th March 2019
Abstract
Understanding protein–ligand interactions is crucial to drug discovery and design. However, it would be extremely difficult for the proteins which only have one available apo structure but multiple binding sites. To address this constraint, a fragment-centric topographic mapping method (AlphaSpace software) was employed to map out concave interaction pockets at the assigned protein region. These pockets are used as complementary spaces to screen the known inhibitors for this specific binding site and to guide the molecular docking pose selection as well as protein–ligand interaction analysis. By mapping the shape of central cavity surface, we have tested the strategy against a multi-drug resistant transmembrane protein-ABCG2 to assist in generating a pharmacophore model for its inhibitors that is based on the structure of apo. Classical molecular simulation and accelerated molecular simulation are used to verify the accuracy of inhibitor screening and binding pose selection. Our study not only has gained insight for the development of novel specific ABCG2 inhibitors, but also has provided a general strategy in describing protein–ligand interactions.
1 Introduction
Protein–ligand interactions play a vital role in all biological processes ranging from metabolic enzyme catalysis to regulation of complex signalling cascades.1 Knowledge on the molecular details of these interactions is crucial to complete the understanding of the biological system and to discover drugs for the treatment of diseases. Protein–ligand interactions mainly concern the binding affinity, steric complementarity of the surface and pharmacophoric patterns of the compound to the target protein.2 Heretofore, crystal structures of protein–ligand complexes are the best models to provide a detailed view of their spatial arrangements and interactions.3 However, there are still many proteins that only have one available apo structures in PDB database.Molecular docking is an effective tool in predicting the structures of protein–ligand complexes as well as studying the protein–ligand interactions, and evaluating the binding affinities of such complexes.4 A typical docking program implements a sampling algorithm to generate possible binding poses and a scoring function of binding affinity estimation.5 Modern docking tools such as AutoDock Vina6 and glide7 are currently capable of generating near-native poses with a re-docking success rate at over 50% on three diverse benchmarks.8 However, the near-native poses are often not the lowest binding energy ones. Thus, it is still a challenge for pharmacologists to identify the correct binding pose from the poses library.9,10 Understanding of protein–ligand interactions is directly determined by the accurate selection of the binding pose.11,12 It would produce an unreliable result of protein–ligand interaction and greatly hinder drug development if an incorrect one was selected. Under this circumstance, a reliable theoretical method is an extraordinarily urgent need to improve the ability of selecting correct docking pose and to better understand the interaction between known inhibitors with protein in apo structure.
Human ABCG2 is one of the three major human ATP binding cassette (ABC) transporters (the other two are P-glycoprotein and MRP1).13 It facilitates the efflux of a broad range of anticancer drugs,14 decreases the intracellular accumulation of cytotoxic drug and impairs the success of chemotherapeutic regimens.15–17 Over-expression of ABCG2 has been frequently found in various drug-selected cancer cell lines. It contributes to clinical MDR of solid tumours and hematopoietic malignancies (Fig. 1).18–20 ABCG2 transports a structurally diverse array of substrates, some shared with P-glycoprotein and MRP1 while others are ABCG2 specific,21 including topoisomerase inhibitors, anthracyclines, camptothecin analogues, tyrosine kinase inhibitors, antimetabolites, non-nucleoside reverse transcriptase inhibitors and protease inhibitors (Fig. 1).22
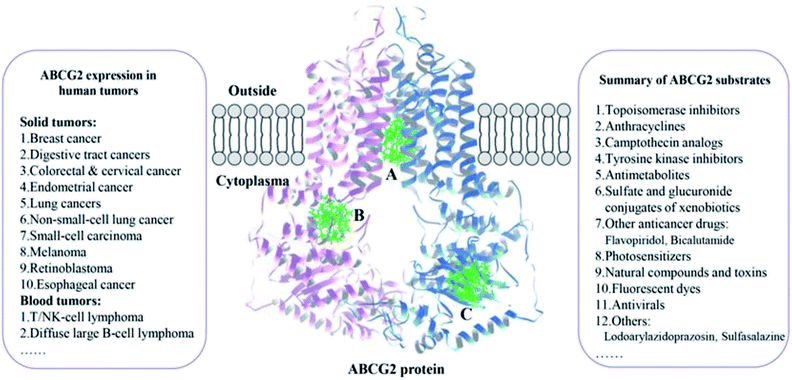 | ||
| Fig. 1 The human tumors caused by ABCG2 over-expression and summary of ABCG2 substrates are listed, and the candidate binding sites of ABCG2 are also marked in this figure. | ||
Owing to their potential values as reversal agents for the treatment of cancer chemotherapy, extensive studies have been made to the development of specific inhibitors against human ABCG2. Fumitremorgin C (FTC) was the first ABCG2 inhibitor to be described in 1998, it reversed chemo-resistance of colon carcinoma to MTX.23 Since then, nearly a hundred agents have been described that inhibit in vitro the action of ABCG2.22 Unfortunately, none of these compounds has been used clinically.24 Thus, researches of ABCG2 inhibitors have so far failed becoming the “valley of death” in drug development. One of the critical obstacles to discover ABCG2 inhibitors is the lack of extensive understanding of protein–ligand interaction. Currently only an apo crystal structures (5NJ3)25 was determined as ABCG2. What's more, there are three regions in ABCG2 that are recognized as the candidate binding sites for inhibitors: (i) specifically targeting the binding site of substrates and the common translocation pathway composed of various sub-sites for multiple scaffolds26 (site A); (ii) specifically targeting the nucleotide-binding domains (NBDs) region to interfere with ATP hydrolysis (site B); (iii) specifically targeting the hinge region between NBD and TMD to block the conformational transformation (site C).27 In sum, the study of protein (apo)–ligand interactions has become more challenging with a wide variety of inhibitors targeting multiple binding sites.
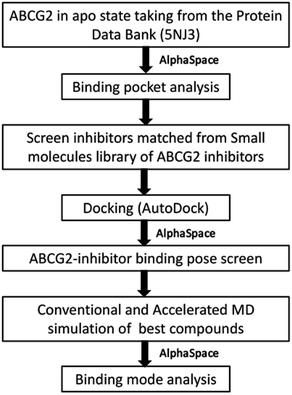
Herein, we have described a comprehensive computational workflow (Fig. 2) to elucidate the protein–ligand interaction of ABCG2 (site A) with the aid of AlphaSpace,28 a fragment-centric topographic mapping tool. Its attractive feature is capability to detect the fragment-centric modularity at protein surface and to characterize the large protein binding interface as a set of localized, fragment-targetable interaction pocket.28 Firstly, candidate ligands targeting site A are screened out from inhibitors library (Fig. S1†) according to the rule of spatial complementarity towards the protein surface which was analyzed by AlphaSpace. Secondly, this surface map of protein further guides a suitable binding pose selection from molecular docking output. Finally, classical molecular simulation, which accelerated molecular simulation along with MM/PBSA binding energy calculations are employed to verify the accuracy of candidate ligands screen and binding pose selection, and to deeply study the interaction of inhibitors with ABCG2 and develop a high-quality pharmacophore model. More importantly, with the understanding of the favourable interactions between ABCG2 protein and inhibitors, we can start to rationalize design novel specific ABCG2 inhibitors by strengthening preferred interactions.
2 Methods
2.1 System preparation
The initial structures of ABCG2 were taken from Protein Data Bank (PDB) with code 5NJ3.25 Gaps in the crystal structure (44-64, 300-326, 355-369) were filled via SWISS-MODEL.29 The library consisted of 156 ABCG2 inhibitors were collected from literature and DrugBank (https://www.drugbank.ca/categories/DBCAT002662) (Fig S1†). The center cavity surface of ABCG2 is characterized with fragment-centric topographical mapping tool, AlphaSpace.28 The inhibitors which possible targeted to the center cavity are screened out based on the topographic mapping of center cavity surface and the rule of spatial complementarity. In this study, we select sildenafil, vardenafil (two approved drugs) and E9 as represented compound for further research. Then the selected inhibitors are docked into the active site of ABCG2 via AutoDock Vina30 using the standard setting. The binding pose of sildenafil/ABCG2 complex is determined by long-term molecule dynamics simulation. For vardenafil/ABCG2 complex and E9/ABCG2 complex, the binding poses are picked out according to the topographic mapping analysis. The PDB2PQR server was used to estimate protonation states of the protein at constant pH 7 based on pKa calculations.312.2 Conventional and accelerated MD simulation
Conventional MD simulation was carried out with pmemd.cuda module of the AMBER 14 package.32 Protein models used ff14SB force field,33 with TIP3P model. Chloride ions were added to neutralize the system using TIP3P ions with parameters form Joung and Cheatham.34 Ligands were parameterized using GAFF force field for the bonded and van der Waals parameters. Partial charges for ligands that fits for the electrostatic potentials were obtained with the use of RESP35 which is calculated with Gaussian36 at the B3LYP/6-31 + g(d,p) level of theory. A cubic periodic box was used with a minimum distance of 10 Å between any box edge as well as any solute atom. All systems were minimized for 10![[thin space (1/6-em)]](https://www.rsc.org/images/entities/char_2009.gif) 000 cycles of steepest descent followed by 10
000 cycles of steepest descent followed by 10![[thin space (1/6-em)]](https://www.rsc.org/images/entities/char_2009.gif) 000 cycles of conjugate gradient. The minimized system was gradually heated from 0 K to 300 K under NVT ensemble condition. It equilibrated 3 ns at 300 K and followed by 400 ns of MD simulation under the NPT ensemble condition. The SHAKE algorithm was adopted to bond length constraints.37 The time step and non-bonding interaction cut off radius were set to 2 fs and 10 Å, respectively.
000 cycles of conjugate gradient. The minimized system was gradually heated from 0 K to 300 K under NVT ensemble condition. It equilibrated 3 ns at 300 K and followed by 400 ns of MD simulation under the NPT ensemble condition. The SHAKE algorithm was adopted to bond length constraints.37 The time step and non-bonding interaction cut off radius were set to 2 fs and 10 Å, respectively.
The aMD protocol38,39 which modifies the initial potential energy surface of the biomolecular system was applied to enhance conformational sampling of the systems, and, to enlarge the accessible time scale of cMD. Acceleration comes from a “boost potential”, ΔV(r), was added to the original dihedral potential, V(r), which increases the energy to V*(r) within basins, by using the equations
| V*(r) = V(r) + ΔV(r) |
where E is a threshold dihedral energy specified by the user. It controls the level of the potential surface affected by bias, and α is the acceleration parameter which establishes the shape of the modified potential.
Thus, it is quite important to choose an appropriate E and α for the transition from one state to another. In this work, value E and α come from the following equation:  where Vav is the average dihedral energy from 10 ns cMD simulation c is a constant and should be specified by the user. Constant 0.2 was chosen to conduct all ABCG2 complex simulations with random velocities.
Saved snapshots were analysed using cpptraj module40 in AmberTools 15. The principal component analysis (PCA) was performed with R-based package Bio3d41 and pharmacophore model was established on the Discovery Studio (DS v4.5).42 All figures were produced with Chimera,43 Matplotlib44 and Microsoft Excel.
2.3 Protein pocket and binding pocket analysis
Binding pocket analysis was performed via AlphaSpace, a computational tool for fragment-centric topographical mapping of intermolecular interfaces.28 Pockets were selected for analysis based on direct contact with any atom from ligand. The occupation status of individual alpha-space within each pocket was evaluated based on the distance (using 1.6 Å cutoffs) between its associated alpha-atom and the nearest atom from peptide ligand. The total pocket occupation residue was calculated by taking the sum of all occupied alpha-space volumes associated with that residue.3 Results and discussion
3.1 Screening of candidate inhibitors based on the topographical mapping analysis
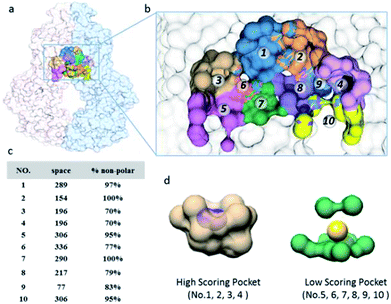
Human ABCG2 protein forms a symmetric homodimer with a two-folded axis perpendicular in the plasma membrane. It is captured in a conformation that is with a central cavity between two transmembrane domains (TMDs) (Fig. 3a). The conformation faces inward and reflects apo state. The central cavity has proven to be the place where the substrate was combined and transported as well as the blocking site for inhibitors.25 Thus, we analysed the transmission interface of ABCG2 with AlphaSpace.28 The shape of central cavity surface is a typical structure as “ ” (Fig. 3a and b). Its surface is mainly composed of hydrophobic and non-polarized residues (Fig. 3c), which are very consistent with experimental results that the lipophilicity is as a predictor of ABCG2 inhibitors.45 As shown in Fig. 3b and d, the geometry of sub-pockets can be classified into two categories: deep pocket and shallow pocket (Fig. S2†). Interestingly, the four deep sub-pockets were all located at the edge of cavity thus favourable for ligand binding. It can be speculated that pockets 1–4 are the sites where the inhibitor pharmacophore binds. Correspondingly, the shallow pockets (pockets no. 5–10) make up two planar parts of the cavity. The average height of cavity is 8.08 Å (Fig. S3†) which is suitable for planar ligand to intrude only. In addition, each plane has a phenylalanine (Fig. S4†) which a π–π stacking can be easily formed with a planar ligand. Thus, this conformation feature is consistent with QSAR results that planar structure increases the ABCG2-inhibitory properties of a drug. We suppose pockets 5–10 are the sites that are suitable for the binding of the inhibitor scaffold.
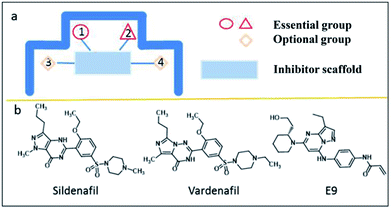
Based on pocket-centric topographic mapping analysis and the rule of spatial complementarity, the molecular profile of ABCG2 inhibitors that target site A can be easily depicted (as shown in Fig. 4a). In addition, we hypothesized that when the space at the top (pocket 1 and pocket 2) are filled by inhibitors, the conformational changes of TMDs will induce by the motion of NBDs. Thus, the structure of ABCG2 inhibitors must contain two groups that simultaneously bind with two deep pockets at the top. It also needs to bind with a planar moiety and the groups that bind with pocket 3 or pocket 4 are optional (Fig. 4a). After screening of the known inhibitors library (Fig. S1†), 32 compounds were found to meet the above criteria. In this study, sildenafil,46 vardenafil,47 E9 (ref. 48) (Fig. 4b) were chosen as candidate inhibitors to explore the protein–ligand interaction at site A.
3.2 Selecting docking pose based on the topographical mapping analysis
Ranking of docking-generated poses is a challenging problem as sampling algorithms can generate binding poses that is close to the correct solution. At the same time, identifying the near-native binding poses using scoring functions has been always difficult as well.49,50 A reliable method for screening correct binding poses would be able to rank near-native binding poses higher than the poses far away from the native. More importantly, the selected binding poses should be stably combined with proteins and have the capacity to produce biological effects. Sildenafil, vardenafil and E9 were docked into the central cavity of ABCG2 via AutoDock Vina, respectively, and Auto dock energy scoring parameters are listed in Table S1.† 30 The 20 docking poses of sildenafil were shown in pocket-centric topographical map calculated by AlphaSpace (Fig. 5). The docking poses of vardenafil and E9 are shown in Fig. S5.† From Fig. 5, it can be easily observed that some docking poses are with a high score, such as no. 1, 2, 3. They are not the most appropriate, because of the significant flexibility due to their location. However, sildenafil only stabilized at the top of the central cavity to play a role in blocking substrate efflux. As discussion above, the structure of the ABCG2 inhibitors must contain two essential groups that simultaneously bind to the two deep pockets (Fig. 4). Therefore, pose 15 is the best binding pose of sildenafil against ABCG2. Correspondingly, binding pose 13 for vardenafil and binding pose 10 for E9 (Fig. S5†) were chosen as candidate structures to explore the protein–ligand interaction against ABCG2 at site A.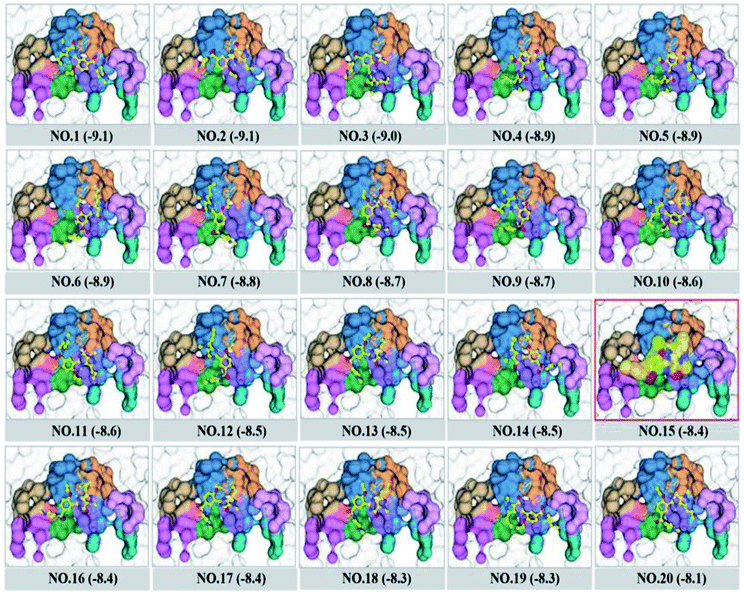 | ||
| Fig. 5 The 20 docking poses of sildenafil in pocket-centric topographical map calculated by AlphaSpace. And Auto dock scoring parameters are listed. | ||
In order to verify the accuracy of the docking pose selection method which is fragment-based topographical mapping analysis, molecular dynamics and accelerated molecular dynamics (aMD) of ABCG2/sildenafil complex were employed to track the motion of sildenafil. 20 docking poses of sildenafil were divided into 7 categories based on the RMSD (Fig. S6†). After a long-time simulation, two types of movement patterns from seven MD trajectories have been found (Fig. 6). Remarkably, the first type of sildenafil was dramatically and stably bound to the top of central cavity of ABCG2 (trajectory E and trajectory G). This type is consistent with our hypothesis that two groups of sildenafil simultaneously bind to the top pockets of the center cavity. It's favorable to lock ABCG2 in inward-facing state. However, the second type (trajectory A B C D and trajectory F) of sildenafil was more flexible with a downward motion which eventually located at the entrance to the central cavity (Fig. 6). It clearly exhibits that they do not have inhibitory function in these cases. Among them, the binding pose 15 selected with the help of pocket-centric topographical mapping method belongs to the first type. Thus, the interaction between sildenafil and ABCG2 is so weak that sildenafil could not play the inhibitory effect in these cases.
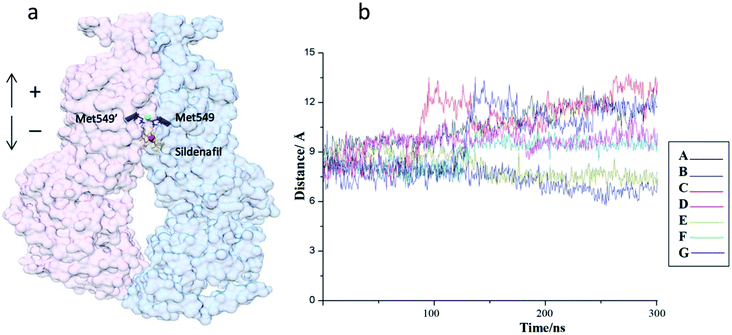 | ||
| Fig. 6 (a and b) The distance between centre of sildenafil and top of the cavity from seven MD trajectories. | ||
3.3 Inhibitors stabilize ABCG2 transport in an inward-facing conformation
The ATP dependent conformation switching from inward-facing to outward-facing occurs in ABCG2-mediate substrate transport.51 Thus, a long-term lock of transporter in inward-facing state to prevent ATP binding and hydrolysis is a critical approach to suppress the transport activity of ABCG2.52To explore the stability of ABCG2 when combined with inhibitors, classical molecular dynamics (cMD) were performed to characterize the dynamical behaviour of ABCG2-inhibitors (sildenafil, vardenafil, and E9) complexes. RMSD values of ABCG2 Cα atoms during the 500 ns production phase that are relative to the initial structures were calculated and plotted in Fig. 7a. The trajectory of the ABCG2/E9 complex fluctuates more than two other trajectories at around 50–80 ns. After that it went parallel to each other, which indicates the conformations of all three ABCG2-inhibitors complexes were in good equilibrium. The result also signifies that conformation of all three complexes were similar to the apo structures during the course of simulations with RMSD values around 2.0 to 2.5 Å to ensure stable trajectories (Fig. S7†).
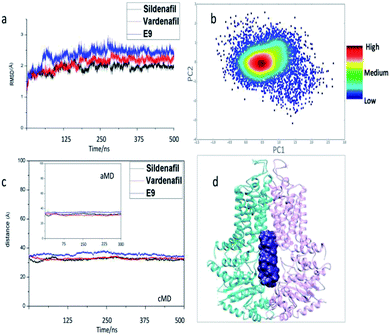 | ||
| Fig. 7 Inhibitors stabilized the structure of ABCG2 in an inward-facing conformation. (a) The root-mean-square deviation (RMSD) of all atoms in ABCG2 was relative to the crystal structures (PDBID: 5NJ3). (b) Projection of TMDs conformational space simulated by aMD onto the principal components produced from the PCA analysis aMD trajectories. (c) The distance between centres of the two NBDs was measured during the cMD and aMD. (d) A typical structure after MDs represents inhibitors that stabilized ABCG2 protein in an inward-facing conformation. | ||
We further performed accelerated molecular dynamics (aMD) simulation which has the capability of capturing millisecond time scale events to ensure these inhibitors tightly bind to the transport cavity and persistently lock the overall topology structure of ABCG2 in inward-facing conformation. The two-dimensional image of ABCG2/sildenafil trajectories projected to the principal components (PCs) is shown in Fig. 7b. In our 300 ns aMD simulation, the inward-facing conformation was observed (Fig. 7d), but no other conformations such as occluded conformation and outward-facing conformation were found. In addition, the distance between the centres of two NBDs was measured during cMD and aMD (Fig. 7c and d). The data elucidates that the distances always fluctuate around 33 Å, which is close to the apo structure with the distance of 35.3 Å.
Taking all the above results together, we come to a conclusion that three inhibitors lock the structure of ABCG2 in inward-facing state with no significant conformational changes. Therefore, the three small molecules are potential inhibitors of ABCG2 which can effectively block the substrates efflux out. What's more, the MD results suggest that the binding poses selected by fragment-centric topographical mapping method are correct.
3.4 Understanding the protein–ligand interaction of ABCG2
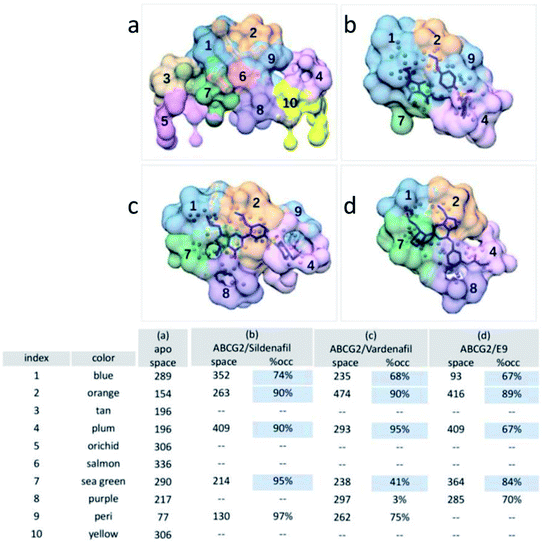
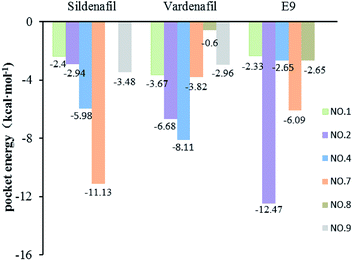
Three inhibitors permanently stayed inside the transport cavity throughout the simulation and presented strong binding ability toward ABCG2. The calculated binding interaction of ABCG2/sildenafil, ABCG2/vardenafil, ABCG2/E9 complexes are −39.70, −37.63, −46.96 kcal mol−1, respectively. In accordance with the components of the binding interaction from Table S2,† the favourable binding energy is van der Waals interactions (ΔEvdw), the non-polar solvation energy (ΔGnopol) and intermolecular electrostatic interactions (ΔEele) in all three complexes. The polar solvation energy (ΔGpol) effects weakened inhibitor bindings. The data is consistent with the result of previous pocket analysis that the cavity surface of ABCG2 is mainly composed of hydrophobic residues. It can be speculated that hydrophobicity is a fundamental factor for the design of novel ABCG2 inhibitors.Our next objective is to understand the protein–ligand interaction of ABCG2 with small molecular inhibitors by means of AlphaSpace matching28 and MM-PBSA decomposition analysis. As shown in Fig. 8, the overall shape of the central cavity is basically unchanged, only some sub-pockets have been reorganized after inhibitors were added. For example, P6 was merged into P2 with the space volume increased from 154 to 474 in ABCG2/vardenafil complex (Fig. 8c). Remarkably, by displaying the fragment-centric topographical mapping of each interface, we can easily find out the conserved pockets for binding inhibitors. P1, P2 and P4 were simultaneously occupied by small molecular with the occupied value above 65% in all three complexes. This is consistent with MM-PBSA decomposition analysis that residues which make up these pockets are primarily involved in the interaction of ABCG2/inhibitors complexes (Fig. 9). It indicates that these sites are crucial for inhibitors binding. Moreover, the three deep sub-pockets were all located at the edge of cavity which particularly facilitates the ligand bind. And the high score pocket P1, P2, P4, P7, P8, and P9 are mainly composed by hydrophobic and non-polarized residues (Table S3†). For example, at the sildenafil/ABCG2, the hydrophobic residues F432, F439, I543, V546, and M549 have strong interaction with ligand which are very consistent with experimental results and percent of non-polar atoms measured by AlphaSpace (Fig. 3c). And a mutation of high energy residue V546 in ABCG2 to a phenylalanine also interfered with biliary cholesterol transport, which was interpreted as a possible steric clash with bound cholesterol by the larger, aromatic residue. Besides the importance of pharmacophores, planar structure from the inhibitors can form a stable sandwich-like structure with residues F439, F439′ in the upper and lower plane of cavity, respectively (Fig. S4†). The sandwich-like structure greatly contributed to the high stability of ABCG2-inhibitor interaction with a calculated π–πstacking energy that is higher than −3.8 kcal mol−1 in all complexes. Among them, the energy even reached −11.1 kcal mol−1 in ABCG2/sildenafil complex among them. The result indicates that this planar aromatic group is an important component for ABCG2 inhibitors.
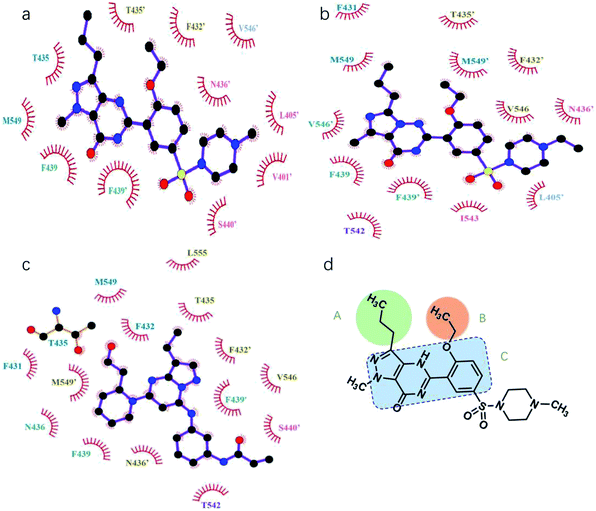
As is known to all that the substrates transported by ABCG2 are driven by the conformational change of TMDs. Thus, pocket 1 and 2 at the top of central cavity will inevitably experience shape transformation during the transport. In this study, we discovered that simultaneously binding to two pockets(P1, P2) can effectively lock ABCG2 protein structure in an inward-facing conformation (Fig. 10a–c). It can be concluded that the groups (site A and B, Fig. 10d) which can bind with pockets 1 and 2 are essential pharmacophores for ABCG2 inhibitors. The second typical structure of inhibitors is the planar aromatic moiety (site C, Fig. 10d). On one hand, it fixes functional groups in the right place. On the other hand, this group forms a π–π interaction with residue F439 and F439′ on the cavity which plays an important role in stabilizing complexes. But, the planar aromatic moiety is not a determining factor in distinguishing between inhibitors and substrates for all substrates with aromatic groups. Therefore, it would be a specific scaffold structure for ABCG2 inhibitors.
4 Conclusions
The lack of a well resolved binding mode between ABCG2 and ligands is one of the reasons for hindering the discovery of new inhibitors of ABCG2. In the present work, a fragment-centric topographical mapping method28 (AlphaSpace software), is adopted to guide the study of molecular mechanism of inhibitor against ABCG2-mediated efflux of drugs. The conventional molecular dynamics and accelerated molecular dynamics simulations have been carried out to understand the interaction of ABCG2/inhibitors. The followings are major findings from the present work.(1) Fragment-centric topographical mapping method is a powerful tool to guide the study of protein–ligand interaction. It has the capability of detecting the fragment-centric modularity at the protein surface and characterizing large protein binding interface as a set of localized, fragment-targetable interaction pocket. This topographical map of intermolecular interfaces provides great convenience for known inhibitors screening and docking poses selection.
(2) Fragment-centric topographical matching is an efficient method of summarizing the interaction of various inhibitors with receptors. It has the ability of tracking pockets at a fragment-centric resolution and assessing the degree of structural conservation or flexibility at the protein surface among several ABCG2/inhibitors complexes.
(3) Inhibitors simultaneously binding to the two pockets at the top of cavity can effectively lock ABCG2 structure in an inward-facing conformation in suppressing ABCG2 transport.
(4) A credible model for ABCG2 inhibitors was developed. Two groups that simultaneously bound to two pockets (P1, P2) at the top of cavity is the primary and the most important pharmacophoric moiety for ABCG2 inhibitors. And the planar aromatic group linked by pharmacophores is the scaffold of inhibitor which plays key role in stabilizing the interaction of ABCG2/inhibitors complexes (Fig. 10d).
The present study has developed a comprehensive computational strategy to understand the protein–ligand interaction with the help of AlphaSpace,28 a fragment-centric topographic mapping tool. We expect that our current studies can provide theoretical aids for designs of high effective drugs targeting ABCG2 to cure diseases such as cancer resistant.
Conflicts of interest
The authors declare no competing financial interest.Acknowledgements
This work is supported by grants from the Shandong Province independent innovation and transformation of Scientific & Technological achievements project (No. 2014ZZCX02104), the Primary Research & Development Plan of Shandong Province (No. 2015GSF118175) and the National Undergraduates’ Innovation and Entrepreneurship Training Program (No. 201710445061).References
- P. Anand, D. Nagarajan, S. Mukherjee and N. Chandra, Database, 2014, 2014, bau029 CrossRef PubMed.
- H.-J. Böhm and G. Schneider, Protein, WILEY-VCH Verlag GmbH & Co. KGaA, Weinheim, 2003 Search PubMed.
- I. Schlichting, Protein–Ligand Interactions: Methods and Applications, ed. G. Ulrich Nienhaus, Humana Press, Totowa, NJ, 2005, pp. 155–165, DOI:10.1385/1-59259-912-5:155.
- N. Andrusier, E. Mashiach, R. Nussinov and H. J. Wolfson, Proteins, 2008, 73, 271–289 CrossRef CAS PubMed.
- H. Li, K.-S. Leung, M.-H. Wong and P. J. Ballester, BMC Bioinf., 2016, 17, 308 CrossRef PubMed.
- O. Trott and A. J. Olson, J. Comput. Chem., 2010, 31, 455–461 CAS.
- R. A. Friesner, R. B. Murphy, M. P. Repasky, L. L. Frye, J. R. Greenwood, T. A. Halgren, P. C. Sanschagrin and D. T. Mainz, J. Med. Chem., 2006, 49, 6177–6196 CrossRef CAS PubMed.
- H. Li, K.-S. Leung, P. J. Ballester and M.-H. Wong, PLoS One, 2014, 9, e85678 CrossRef PubMed.
- K. Terayama, H. Iwata, M. Araki, Y. Okuno and K. Tsuda, Bioinformatics, 2018, 34, 770–778 CrossRef PubMed.
- M. L. Verdonk, P. N. Mortenson, R. J. Hall, M. J. Hartshorn and C. W. Murray, J. Chem. Inf. Model., 2008, 48, 2214–2225 CrossRef CAS PubMed.
- S.-Y. Huang and X. Zou, Int. J. Mol. Sci., 2010, 11, 3016–3034 CrossRef CAS PubMed.
- K. M. Elokely and R. J. Doerksen, J. Chem. Inf. Model., 2013, 53, 1934–1945 CrossRef CAS PubMed.
- E. M. Leslie, R. G. Deeley and S. P. Cole, Toxicol. Appl. Pharmacol., 2005, 204, 216–237 CrossRef CAS PubMed.
- R. Gatenby and J. Brown, Cold Spring Harbor Perspect. Med., 2017, 8, a033415 CrossRef PubMed.
- P. D. Eckford and F. J. Sharom, Chem. Rev., 2009, 109, 2989–3011 CrossRef CAS PubMed.
- B. C. Baguley, Mol. Biotechnol., 2010, 46, 308–316 CrossRef CAS PubMed.
- T. Ozben, FEBS Lett., 2006, 580, 2903–2909 CrossRef CAS PubMed.
- K. Natarajan, Y. Xie, M. R. Baer and D. D. Ross, Biochem. Pharmacol., 2012, 83, 1084–1103 CrossRef CAS PubMed.
- R. Allikmets, L. M. Schriml, A. Hutchinson, V. Romano-Spica and M. Dean, Cancer Res., 1998, 58, 5337–5339 CAS.
- L. A. Doyle, W. Yang, L. V. Abruzzo, T. Krogmann, Y. Gao, A. K. Rishi and D. D. Ross, Proc. Natl. Acad. Sci. U. S. A., 1998, 95, 15665–15670 CrossRef CAS.
- M. Dean, A. Rzhetsky and R. Allikmets, Genome Res., 2001, 11, 1156–1166 CrossRef CAS PubMed.
- W. Mo and J.-T. Zhang, Int. J. Biochem. Mol. Biol., 2012, 3, 1–27 CAS.
- S. K. Rabindran, H. He, M. Singh, E. Brown, K. I. Collins, T. Annable and L. M. Greenberger, Cancer Res., 1998, 58, 5850–5858 CAS.
- J. Ricci, D. Lovato and R. Larson, J. Dev. Drugs, 2015, 4, 138 Search PubMed.
- N. M. I. Taylor, I. Manolaridis, S. M. Jackson, J. Kowal, H. Stahlberg and K. P. Locher, Nature, 2017, 546, 504 CAS.
- S. M. Jackson, Nat. Struct. Mol. Biol., 2018, 25(4), 333 CrossRef CAS PubMed.
- M. K. Krapf, J. Gallus, V. Namasivayam and M. Wiese, J. Med. Chem., 2018, 61, 7952–7976 CrossRef CAS PubMed.
- D. Rooklin, C. Wang, J. Katigbak, P. S. Arora and Y. Zhang, J. Chem. Inf. Model., 2015, 55, 1585–1599 CrossRef CAS PubMed.
- F. Kiefer, K. Arnold, M. Künzli, L. Bordoli and T. Schwede, Nucleic Acids Res., 2008, 37, D387–D392 CrossRef PubMed.
- W. L. Jorgensen, Science, 2004, 303, 1813–1818 CrossRef CAS PubMed.
- T. J. Dolinsky, P. Czodrowski, H. Li, J. E. Nielsen, J. H. Jensen, G. Klebe and N. A. Baker, Nucleic Acids Res., 2007, 35, W522–W525 CrossRef PubMed.
- D. Case, V. Babin, J. Berryman, R. Betz, Q. Cai, D. Cerutti, T. Cheatham III, T. Darden, R. Duke and H. Gohlke, Amber 14, University of California, San Francisco, 2014 Search PubMed.
- J. A. Maier, C. Martinez, K. Kasavajhala, L. Wickstrom, K. E. Hauser and C. Simmerling, J. Chem. Theory Comput., 2015, 11, 3696–3713 CrossRef CAS PubMed.
- W. L. Jorgensen, J. Chandrasekhar, J. D. Madura, R. W. Impey and M. L. Klein, J. Chem. Phys., 1983, 79, 926–935 CrossRef CAS.
- C. I. Bayly, P. Cieplak, W. Cornell and P. A. Kollman, J. Chem. Phys., 1993, 97, 10269–10280 CrossRef CAS.
- M. J. Frisch, G. W. Trucks, H. B. Schlegel, G. E. Scuseria, M. A. Robb, J. R. Cheeseman, G. Scalmani, V. Barone, B. Mennucci, G. A. Petersson, H. Nakatsuji, M. Caricato, X. Li, H. P. Hratchian, A. F. Izmaylov, J. Bloino, G. Zheng, J. L. Sonnenberg, M. Hada, M. Ehara, K. Toyota, R. Fukuda, J. Hasegawa, M. Ishida, T. Nakajima, Y. Honda, O. Kitao, H. Nakai, T. Vreven, J. A. Montgomery, J. E. Peralta, F. Ogliaro, M. Bearpark, J. J. Heyd, E. Brothers, K. N. Kudin, V. N. Staroverov, R. Kobayashi, J. Normand, K. Raghavachari, A. Rendell, J. C. Burant, S. S. Iyengar, J. Tomasi, M. Cossi, N. Rega, J. M. Millam, M. Klene, J. E. Knox, J. B. Cross, V. Bakken, C. Adamo, J. Jaramillo, R. Gomperts, R. E. Stratmann, O. Yazyev, A. J. Austin, R. Cammi, C. Pomelli, J. W. Ochterski, R. L. Martin, K. Morokuma, V. G. Zakrzewski, G. A. Voth, P. Salvador, J. J. Dannenberg, S. Dapprich, A. D. Daniels, Ö. Farkas, J. B. Foresman, J. V. Ortiz, J. Cioslowski and D. J. Fox, Gaussian 09, Revision D.01, Gaussian Inc., Wallingford, CT, 2009 Search PubMed.
- T. G. Coleman, H. C. Mesick and R. L. Darby, Ann. Biomed. Eng., 1977, 5, 322–328 CrossRef CAS PubMed.
- D. Hamelberg, J. Mongan and J. A. McCammon, J. Chem. Phys., 2004, 120, 11919–11929 CrossRef CAS PubMed.
- D. Hamelberg, C. A. de Oliveira and J. A. McCammon, J. Chem. Phys., 2007, 127, 155102 CrossRef PubMed.
- D. R. Roe and T. E. Cheatham, J. Chem. Theory Comput., 2013, 9, 3084–3095 CrossRef CAS PubMed.
- B. J. Grant, A. P. C. Rodrigues, K. M. ElSawy, J. A. McCammon and L. S. D. Caves, Bioinformatics, 2006, 22, 2695–2696 CrossRef CAS PubMed.
- D. Studio, Release 4.5, Accelrys Software Inc., 2016 Search PubMed.
- E. F. Pettersen, T. D. Goddard, C. C. Huang, G. S. Couch, D. M. Greenblatt, E. C. Meng and T. E. Ferrin, J. Comput. Chem., 2004, 25, 1605–1612 CrossRef CAS PubMed.
- J. D. Hunter, Comput. Sci. Eng., 2007, 9, 90–95 Search PubMed.
- A. E. Stacy, P. J. Jansson and D. R. Richardson, Mol. Pharmacol., 2013, 84, 655–669 CrossRef CAS PubMed.
- Z. Shi, A. K. Tiwari, S. Shukla, R. W. Robey, S. Singh, I.-W. Kim, S. E. Bates, X.-X. Peng, I. Abraham and S. V. Ambudkar, Cancer Res., 2011, 10, 3820 Search PubMed.
- J. J. Chen, Y. L. Sun, A. K. Tiwari, Z. J. Xiao, K. Sodani, D. H. Yang, S. G. Vispute, W. Q. Jiang, S. D. Chen and Z. S. Chen, Cancer Sci., 2012, 103, 1531–1537 CrossRef CAS PubMed.
- Y. Gao, T. Zhang, H. Terai, S. B. Ficarro, N. Kwiatkowski, M.-F. Hao, B. Sharma, C. L. Christensen, E. Chipumuro, K.-k. Wong, J. A. Marto, P. S. Hammerman, N. S. Gray and R. E. George, Cell Chem. Biol., 2018, 25, 135–142 CrossRef CAS PubMed.
- E. Yuriev, M. Agostino and P. A. Ramsland, J. Mol. Recognit., 2011, 24, 149–164 CrossRef CAS PubMed.
- E. Yuriev and P. A. Ramsland, J. Mol. Recognit., 2013, 26, 215–239 CrossRef CAS PubMed.
- D. C. Rees, E. Johnson and O. Lewinson, Nat. Rev. Mol. Cell Biol., 2009, 10, 218 CrossRef CAS PubMed.
- J. A. Coleman and E. Gouaux, Nat. Rev. Mol. Cell Biol., 2018, 25, 170–175 CAS.
Footnote |
| † Electronic supplementary information (ESI) available: Additional simulated and computational results involved in this study. See DOI: 10.1039/c8ra09789e |
| This journal is © The Royal Society of Chemistry 2019 |

