 Open Access Article
A microwave-activated coal fly ash catalyst for the oxidative elimination of organic pollutants in a Fenton-like process†
Nannan Wang *ab,
Han Xua and
Shuo Li*c
aDepartment of Environmental Engineering, Beijing Institute of Petrochemical Technology, Beijing 102617, PR China. E-mail: wnn_flying@163.com
bBeijing Key Laboratory of Pipeline Critical Technology and Equipment for Deepwater Oil & Gas Development, Beijing 102617, PR China
cCollege of Chemistry and Chemical Engineering, Qiqihar University, Qiqihar, 161006, PR China. E-mail: shuo_105@163.com
First published on 8th March 2019
Abstract
Raw coal fly ash was first activated by microwave irradiation to promote its catalytic potential and then used as a Fenton-like catalyst to treat polyacrylamide-contaminated wastewater. The optimal activation conditions of the raw coal fly ash (microwave power = 700 W, irradiation time = 10 min, mixing speed = 120 rpm, and raw coal fly ash loading = 20 g L−1) were determined by the orthogonal test. The significance of each effective parameter follows the order: raw coal fly ash loading > microwave power > irradiation time > mixing speed. Microwave irradiation can change the surface morphology and remarkably increase the specific surface area and pore volume. More than 75% of the TOC in the polyacrylamide-contaminated wastewater can be removed under the optimized treatment conditions ([H2O2] = 12 mg L−1, catalyst loading = 10 g L−1, [polyacrylamide] = 200 mg L−1, T = 313 K). The kinetic study shows that the variation in the catalyst loading and the polyacrylamide concentration can change the degradation path of the polyacrylamide, whereas the variation in the H2O2 dosage can accelerate the degradation of polyacrylamide. The Fenton-like process studied herein has a wider optimal pH range (2–5) than that of the classic Fenton process (3). The catalyst has weak catalytic capacity but better catalytic persistence than that of Fe2+. During the five runs of the catalyst, some heavy metallic and toxic elements (Fe, Al, Ti, Cr, Mn, etc.) can be detected but under the limits of the GB8978-1996 standard. Leaching can weaken the catalytic capacity (i.e., stability) of the catalyst. The catalytic process is caused by the synergism of multiple metals and consists of heterogeneous and homogeneous processes.
Introduction
The Fenton process, as a wastewater treatment process, is well known because of the generation of ˙OH (2.8 V of redox potential versus the normal hydrogen electrode) via the reaction (1)1| Fe2+ + H2O2 → Fe3+ + OH− + ˙OH | (1) |
However, the optimal pH (approx. 3)2 and the generation of sludge containing the Fe element3 limit the application of the Fenton process.
Exploring a new catalyst to replace Fe2+ is a widely recognized solution to remove this limitation.4 Some catalysts have been synthesized such as Z-scheme Fe2O3-doped Cu2O, Fe3+–Al2O3, CoFe2O4 powder, Pd–Fe3O4, CoMxFe2−xO4, Fe–Ti pillared bentonite, Fe73.5Si13.5B9Cu1Nb3, and Fe–Mn-sepiolite.5–11 All these catalysts can effectively catalyze the above reaction. It is valuable to notice that these catalysts have an identical feature, i.e., they contain the Fe element and some auxiliary metallic elements such as Cu, Al, Co, Pd, Mn, Ti, and/or Nb. However, the preparation cost of these catalysts is high and the source of raw materials is limited. Thus, exploring a cheaper catalyst is encouraged.
Coal fly ash (CFA), as a well-known environmental pollutant, could be an appropriate alternative because of its distinctive features: (1) contains Fe element and other elements that are always doped on the synthesized Fenton-like catalyst; (2) can cause serious environmental pollution and exploring new methods to reuse it are urgent; (3) exists widely, easy to purchase, and its price is low. In the scientific research history of CFA, it has been studied in some research fields such as soil improvement, metal extraction, and preparation of zeolite/adsorbent.12–15 Relatively speaking, the use of a Fenton-like catalyst after an appropriate activation to treat organic wastewater has not attracted enough attention until now. CFA has been reported to absorb electromagnetic waves because of the existence of ferromagnetic material and other metallic oxides.16 However, this property was never noticed in the preparation of Fenton-like catalysts based on CFA.
Microwave (MW) is a wavelength band (300 MHz to 300 GHz) of the electromagnetic spectrum. It has distinctive thermal and non-thermal effects.2 As for the thermal effect, MW can penetrate into (or pierce through) some materials (such as metallic oxides) and heat materials throughout their volume simultaneously. This heating mode exhibits a distinction compared with the traditional heating. As for the non-thermal effect, MW can excite the reactant molecules to the higher vibrational and rotational energy levels. MW has been used widely in chemical reactions depending on the ability of accelerating the reaction rate, reducing the activation energy, and strengthening the vibration of chemical bonds.17
In recent years, polyacrylamide (PAM) has been used widely in the enhanced oil recovery process as it can increase the bulk viscosity and improve the oil–water mobility ratio.18 However, the generated polymer-flooding wastewater (PFW) has caused serious production pressure and environmental issues in China. The PAM in the PFW can enhance the stability of the oil–water emulsion, which makes it difficult to treat the PFW by conventional methods.19 Nowadays, part of the PFW is being injected back into the stratum and the rest is discharged directly into natural water and/or soil, thus causing water and soil pollution. Therefore, the removal of PAM from PFW is a critical step in the effective treatment of PFW before efflux.
In this work, raw CFA (CFAR) was chosen as the raw material of a Fenton-like catalyst, synthetic PAM wastewater was chosen as the target pollutant, and a Fenton-like process catalyzed by MW-activated CFA (denoted by CFAMW) was chosen to treat the PAM wastewater. Firstly, the activation condition of the CFAR was optimized and the CFAMW was characterized by SEM, BET, XRD, XRF, and FTIR. After that, the treatment conditions of the PAM wastewater were optimized and the degradation kinetics of PAM was analyzed. Subsequently, the features of the Fenton-like process (optimal pH range, leachability, and stability of CFAMW) were investigated and discussed. Finally, the catalytic mechanism of CFAMW was proposed. This work gives a new activation method for CFAR and provides an idea on how to minimize the pollution from CFA and PFW.
Materials and methods
Chemical reagents
PAM (analytical grade, molecular weight = 3.0 × 10⁶) and H2O2 were purchased from Sigma-Aldrich, while HCl and NaOH were purchased from Honeywell. H2O2 was stored in the dark at 277 K. All chemical reagents were prepared using 18 MΩ cm Milli-Q water (MQ). All used glassware were soaked in an alcohol solution for at least 24 h and washed with MQ before use.The CFAR was obtained from a coal-fired power plant in China. The electromagnetic parameters of the CFAR are shown in Table 1. It was washed by MQ before the experiments to remove the impurities and dried at 378 K.
| Frequency/GHz | ε′ | ε′′ | tan![[thin space (1/6-em)]](https://www.rsc.org/images/entities/char_2009.gif) δe δe |
μ′ | μ′′ | tan![[thin space (1/6-em)]](https://www.rsc.org/images/entities/char_2009.gif) δm δm |
|---|---|---|---|---|---|---|
a ε′ and ε′′ are the real part and imaginary part of complex permittivity, respectively; tan![[thin space (1/6-em)]](https://www.rsc.org/images/entities/char_2009.gif) δe = ε′′/ε′ is the dielectric loss tangent; μ′ and μ′′ are the real part and imaginary part of complex permeability, respectively; tan δe = ε′′/ε′ is the dielectric loss tangent; μ′ and μ′′ are the real part and imaginary part of complex permeability, respectively; tan![[thin space (1/6-em)]](https://www.rsc.org/images/entities/char_2009.gif) δm = μ′′/μ′ is the magnetic loss tangent. δm = μ′′/μ′ is the magnetic loss tangent. |
||||||
| 1 | 2.42 | 0.13 | 0.054 | 0.96 | 0.15 | 0.156 |
| 2 | 2.42 | 0.11 | 0.045 | 0.98 | 0.11 | 0.112 |
| 2.45 | 2.41 | 0.08 | 0.033 | 0.99 | 0.08 | 0.081 |
| 3 | 2.40 | 0.05 | 0.021 | 1.01 | 0.08 | 0.079 |
| 4 | 2.43 | 0.05 | 0.021 | 1.01 | 0.07 | 0.069 |
Preparation of CFAMW
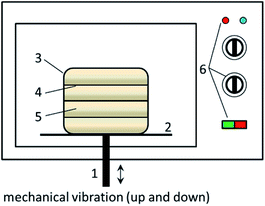
The MW activation process of CFAR was conducted in a retrofitted MW oven (EM-202MS1, SANYO, Japan, Fig. 1). A certain amount of CFAR was tiled on the multi-layer plate in the preparation chamber. The MW and the vibratory rod were switched on simultaneously and the activation process was started. The vibration of the chamber can force the CFAR to disperse in the whole space of the preparation chamber and to receive adequate MW irradiation. After the activation, the prepared CFA catalyst (i.e., CFAMW) was stored in a drying basin.Experimental process
In the treatment of the PAM wastewater, a certain amount of CFAMW and 300 mL PAM solution (200 mg L−1) with pre-determined pH were added into a beaker (500 mL) successively. The mixture was mixed by mechanical agitation. The degradation of PAM commenced immediately after adding the H2O2 solution.All experiments were conducted at a constant temperature controlled by a water bath (±1 K). At every determined time interval, the mixture was sampled and every sample was pretreated by adding NaOH solution and MnO2 solid as soon as possible, before filtration. This can stop the generation of ˙OH and decompose the residual H2O2. All the pretreated samples were filtered by vacuum filtration, and all the filtrates were analyzed to determine the TOC and concentration of the leached metallic ions.
In the study of the stability of CFAMW, the separated CFAMW from the treated PAM wastewater was washed by MQ water first and then dried at 378 K until the weight did not change any more. The CFAMW was used repeatedly under the identical experimental conditions of the first run.
Analytical methods
The TOC in the PAM wastewater was measured by a Rosemount Analytical Dohrmann DC-190 ASM TOC analyzer. The removal rate of TOC was calculated by eqn (2).| Removal rate (%) = ((c0 − c)/c0) × 100 | (2) |
The utilization rate (UR, L mg−1) of H2O2 was calculated by eqn (3):
| URn−m = (φm − φn)/([H2O2]m) − [H2O2]n) | (3) |
The life span of ˙OH in aqueous solution is always very short and it is, therefore, difficult to determine the specific concentration of ˙OH directly. Thus, a terephthalic acid fluorescence probing technique was applied in this work. Terephthalic acid can capture ˙OH effectively and generate 2-hydroxyterephtalic acid. The fluorescence intensity of 2-hydroxyterephtalic acid is in proportion to the amount of ˙OH. Terephthalic acid solution was prepared using MQ water according to the literature.20
Characterization methods
The surface morphology of CFAMW and CFAR was observed by scanning electron microscopy (SEM, S4800, Hitachi). The specific surface area and the features of the pores of CFAMW and CFAR were determined by Brunauer–Emmett–Teller automated analyzer (BET, ASAP 2420, Micromeritics). The crystal structure of CFAMW and CFAR was determined by X-ray diffraction (XRD, D/max-rB, Rigaku Corporation). The chemical composition of CFAMW and CFAR was analyzed quantitatively by X-ray fluorescence spectrometry (XRF, ARLADVANT XP+, Thermo electron corporation). The Fourier transform infrared spectrum of CFAMW was measured by FTIR spectrometer (FTIR-650). The concentration of metallic elements in the wastewater was measured by flame atomic absorption spectrometry (PinAAcle 900T, PerkinElmer). The electromagnetic property of CFAR was measured by Vector Network Analyzers (HP8722ES).Results and discussion
Optimization of activation condition
The electromagnetic property of CFAR is given in Table 1, from which it can be seen that both of the imaginary parts (ε′′ and μ′′) of the complex permittivity and complex permeability are affected by the variation of MW frequency. They always decrease with the increase of frequency. However, the real parts (ε′ and μ′) of the complex permittivity and complex permeability exhibit insensitivity to the variation of MW frequency. Therefore, the dielectric loss tangent (tan![[thin space (1/6-em)]](https://www.rsc.org/images/entities/char_2009.gif) δe) and magnetic loss tangent (tan
δe) and magnetic loss tangent (tan![[thin space (1/6-em)]](https://www.rsc.org/images/entities/char_2009.gif) δm) have the same variation trend with the two imaginary parts. As both of the tan
δm) have the same variation trend with the two imaginary parts. As both of the tan![[thin space (1/6-em)]](https://www.rsc.org/images/entities/char_2009.gif) δe and tan
δe and tan![[thin space (1/6-em)]](https://www.rsc.org/images/entities/char_2009.gif) δm are greater than 1.0 × 10⁻² within the range of 1–4 GHz, the CFAR shows absorbability of MW by means of dielectric loss and magnetic loss.
δm are greater than 1.0 × 10⁻² within the range of 1–4 GHz, the CFAR shows absorbability of MW by means of dielectric loss and magnetic loss.
In this section, the activation condition of CFAR by MW irradiation (2.45 GHz) was optimized based on the removal rate of TOC in the PAM wastewater. The experiment was arranged according to the orthogonal test (L25(54)) and the optimum experimental conditions were obtained by the analysis of the average value (Iij, eqn (4)) and the extremum (RE,i, eqn (5)) of the TOC removal rate,21
 | (4) |
| RE,i = Iij,max − Iij,min | (5) |
As shown in Table S1,† taking the factor 1 (power of MW) for example, the I14 (40.2) has the highest value, while I13 (26.0) has the lowest one. Therefore, it can be inferred that 700 W (j = 4) of MW power is the optimal value. The same is applicable for each of the other factors (irradiation time, mixing speed, loading of CFAR). Thus, the optimal experimental conditions are: power of MW = 700 W, irradiation time = 10 min, mixing speed = 120 rpm, and loading of CFAR = 20 g L−1.
The order of the significance of the four factors can be determined by the comparison of extrema (RE). As shown in Table S1,† the loading of CFAR has the most pronounced effect on the removal rate of TOC because of the highest RE (27.3), while mixing speed has the weakest effect (9.9). The effect of the power of MW and irradiation time occupy the second and third places, respectively. Therefore, the order of significance is: loading of CFAR > power of MW > irradiation time > mixing speed.
Actually, the above order is in accordance with the property of MW. For a given mixing speed, the MW irradiation can penetrate into the substrate and cause the simultaneous heating of a whole block of material. Therefore, the effect of mixing speed is relatively weaker. For a given irradiation time, the hot-spot effect of the MW irradiation can be produced quickly. Thus, the activation of CFAR occurs and finishes in a short time. This determines that the irradiation time is relatively less significant as well. As for the power of the MW and the loading of CFAR, the power of MW can determine the instantaneous temperature of the hot-spot, while more loading of CFAR will disperse the MW energy, thus causing the decrease of instantaneous temperature of the hot-spot. Therefore, they have an important effect compared with the irradiation time and mixing speed.
Characteristics of CFAMW and CFAR
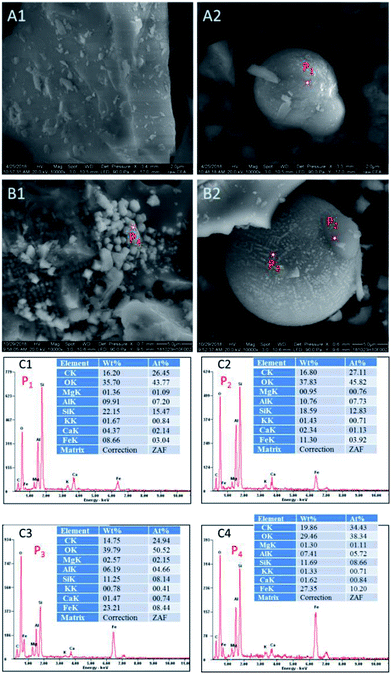 | ||
| Fig. 2 SEM images and EDX spectra of CFAMW and CFAR (A1 and A2: SEM of CFAR; B1 and B2: SEM of CFAMW; C1, C2, C3, and C4: EDX spectra of P1, P2, P3, and P4). | ||
The ratio of the components of the elements on the smooth surface and the spherical particles were measured and compared. As shown in Fig. 2C1–C4, the smooth surface (P1 and P2) of CFAR and CFAMW can have the similar ratio of elements, while the main catalytic component (i.e., Fe element) is higher in CFAMW (P2) than that in CFAR (P1). The components in the spherical particles (P3 and P4) exhibit remarkable difference. The Fe element on the surface of the spherical particles is much higher than that on the smooth surface, while the Ca element is relatively low. Thus, it can be inferred that the active sites on the surface of the CFAMW are higher than those on CFAR, which is beneficial for the improvement of the catalytic capacity.
| Catalyst | Specific surface area (m2 g−1) | Pore volume (cm3 g−1) | Average pore diameter (nm) |
|---|---|---|---|
| CFAMW | 32.19 | 0.079 | 4.79 |
| CFAR | 17.68 | 0.058 | 5.76 |
In essence, it is not difficult to understand this result. The actual temperature on the surface of CFA during the activation process is no more than 573 K, which is much lower than that in the circulating fluidized bed boiler and is not enough to change the crystalline phase. In addition, the variation of the components of the metallic elements will never occur under the MW irradiation. The fluctuation of data is caused by the measurement error.
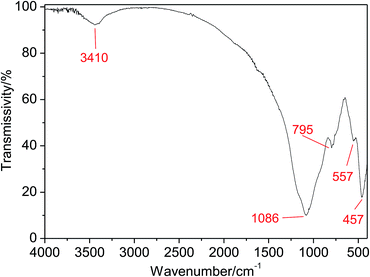
It is valuable to notice the stretching vibrations of ˙OH inferred from the peak at 3410 cm−1, which is critical to the catalytic activity of CFAMW due to the formation of ![[triple bond, length as m-dash]](https://www.rsc.org/images/entities/char_e002.gif) Fe–OH (see Fig. 7).
Fe–OH (see Fig. 7).
Experimental parameters in the treatment of PAM wastewater
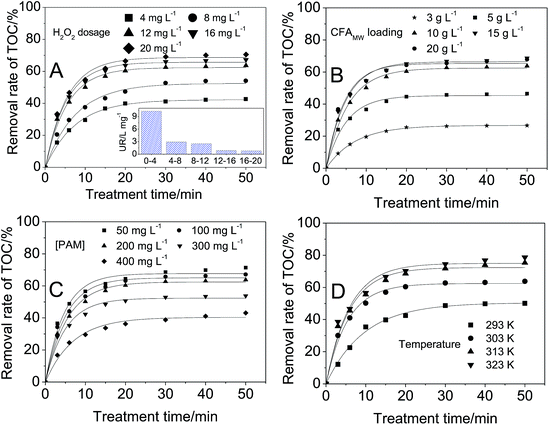
The optimization of the treatment conditions is a critical step in studying the CFAMW catalyzed Fenton-like process. In this work, H2O2 dosage, CFAMW loading, TOC in the PAM wastewater, and the treatment temperature were studied and optimized, respectively.The data in Fig. 4A shows the effect of H2O2 dosage on the TOC removal rate. The removal rate of TOC always increases with the increase of the H2O2 dosage. However, it is important to notice that the increase of H2O2 dosage from 12 to 20 mg L−1 only results in a small growth in the TOC removal rate (from 63.8% to 70.6%) at 50 min. The UR of H2O2 in the inset of Fig. 4A shows that more loading of H2O2 can cause the rapid decrease of the UR of H2O2. When the loading of H2O2 is 4 mg L−1, the UR is 10.3 L mg−1, while more loading of H2O2 (8 mg L−1) results in the decrease of UR from 10.3 L mg−1 to 2.9 L mg−1. Considering the balance of the removal rate of TOC with the UR of H2O2, the optimal dosage of H2O2 was determined to be 12 mg L−1.
The side reaction occurring in Fenton-like process is responsible for the decline of the UR of H2O2. As shown in reaction (6), the excessive loading of H2O2 can hinder the reaction between PAM and ˙OH by the mutual consumption of ˙OH with H2O2.
| H2O2 + ˙OH → HO2˙ + H2O | (6) |
The data in Fig. 4B shows the effect of CFAMW loading on the TOC removal rate. Similar to the effect of H2O2 dosage, with the increase of CFAMW loading, more TOC can be eliminated but it encounters a bottleneck when the CFAMW loading reaches 10 g L−1. More CFAMW loading causes the rapid consumption of H2O2 and the rapid generation of ˙OH. Reaction (7) becomes more and more significant with the increase of ˙OH concentration, i.e., the internal consumption of ˙OH becomes more severe.
| ˙OH + ˙OH → H2O2 | (7) |
The data in Fig. 4C shows the effect of PAM concentration on the TOC removal rate. It can be seen that the increase in PAM concentration has less effect in the range of 50–200 mg L−1, while the effect become substantial when the PAM concentration increases beyond 200 mg L−1. This result can be caused by two reasons. Firstly, the ˙OH can degrade only a fixed amount of PAM, thus more PAM can decrease its removal rate. Secondly, more PAM implies an increase in the viscosity of the wastewater, thus the diffusion of the catalyst H2O2 and ˙OH is limited seriously even if adequately mixed.
The data in Fig. 4D shows the effect of the wastewater temperature, from which it can be seen that higher temperature encourages in the direction of increasing removal rate of TOC. The removal rate increases from 50.1% to 78.7% at 50 min when the temperature rises from 293 K to 323 K. In this work, 313 K was the optimal value as higher temperature cannot significantly increase the removal rate of TOC.
Kinetic study
The frequently-used pseudo-first order kinetic model is25| −d[TOCR]/dt = kap·[TOC]R | (8) |
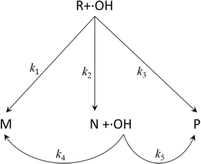
However, eqn (8) does not consider the degradation process of PAM and the properties of the degradation products. In reality, the degradation products of organics (including PAM) can always be divided into three kinds, i.e., inorganic matter (H2O, CO2, etc.), degradable organic matter (intermediates), and non-degradable organic matter.26 In this section, the generation of the three kinds of products was considered (see eqn (9)) and the corresponding detailed degradation kinetic (DDK) model was derived.
 | (9) |
In the DDK model, the initial organic pollutant (R, i.e., PAM) can be degraded by ˙OH via three paths, i.e., being degraded to non-degradable organic matters (M, k1), being degraded to intermediates (N, k2), and being degraded to inorganic matter (P, k3). Moreover, N can be degraded further by ˙OH to M and P, corresponding to the kinetic constants k4 and k5, respectively.
Assuming that the five degradation processes follow the pseudo-first kinetics, the DDK model can be described as:
| −d[TOCR]/dt = (k1 + k2 + k3)·[TOC]R | (10) |
| −d[TOCN]/dt = (k4 + k5)·[TOC]N − k2·[TOC]R | (11) |
| −d[TOCM]/dt = −k1·[TOC]R − k4·[TOC]N | (12) |
The TOC of the PAM wastewater can be formulated by the integration of eqn (10)–(12):
 | (13) |
As there is no other chemical substance in the initial PAM wastewater, the initial TOC of M and N is zero. Thus, eqn (13) can be further simplified to eqn (14).
 | (14) |
The five kinetic parameters in eqn (14) can be obtained by the use of Matlab, based on the multi-variable least-squares method.2
The fitting results of k1, k2, k3, k4, and k5 under different H2O2 dosage, CFAMW dosage, and PAM concentration are shown in Table 3, from which it can be seen that the regression coefficient (R2) is always higher than 0.998, thus indicating that the experimental data can follow the DDK model well.
| H2O2 dosage (mg L−1) | CFAMW loading (g L−1) | PAM concentration (mg L−1) | Kinetic constant of the DDK model (min−1) | R2 | ||||
|---|---|---|---|---|---|---|---|---|
| k1 | k2 | k3 | k4 | k5 | ||||
| 4 | 3 | 50 | 0.0891 | 0.0536 | 0.0636 | 0 | 0.0556 | 0.9986 |
| 12 | 3 | 50 | 0.0904 | 0.0603 | 0.0661 | 0 | 0.0613 | 0.9989 |
| 20 | 3 | 50 | 0.1072 | 0.0650 | 0.0704 | 0 | 0.0665 | 0.9991 |
| 20 | 10 | 50 | 0.0879 | 0.0626 | 0.0799 | 0 | 0.0701 | 0.9981 |
| 20 | 20 | 50 | 0.0753 | 0.0601 | 0.0856 | 0 | 0.0755 | 0.9992 |
| 20 | 20 | 200 | 0.0719 | 0.0644 | 0.0799 | 0 | 0.0638 | 0.9987 |
| 20 | 20 | 400 | 0.0678 | 0.0685 | 0.0728 | 0 | 0.0609 | 0.9996 |
With the increase of the H2O2 dosage from 4 to 20 mg L−1, the apparent kinetic constant k1, k2, k3, and k5 in the DDK model always increase from 0.0891, 0.0536, 0.0636, and 0.0556 min−1 to 0.1072, 0.0650, 0.0704, and 0.0665 min−1, respectively. The increase of the above four kinetic constants confirms that PAM can be removed more rapidly due to the generation of more ˙OH during the treatment time, while whether the degradation path can be changed cannot be inferred from this result. With the increase of CFAMW loading from 3 to 20 g L−1, k1 and k2 decrease while k3 and k5 increase, thus revealing that the primary degradation pathway of PAM shifts towards the direct formation of inorganic matter due to the attack of more ˙OH in a short time under the catalysis by more CFAMW. With the increase of PAM concentration from 50 to 400 mg L−1, k1, k2, k3, and k5 change as well, revealing that the degradation rate is also dependent on the PAM concentration. The increase of k2 (from 0.0601 to 0.0685 min−1) and the decrease of k1, k3, and k5 implied that the primary degradation pathway of PAM is more towards the formation of intermediates (N), i.e., more PAM is not degraded completely. The value of k4 is always kept at zero, showing that the degradation path of N to M was not manifested.
Features of CFAMW catalyzed Fenton-like process
As shown in Fig. 5, when pH varies in the range of 2–5, the removal rate of TOC varies in a small range (64.6–70.5%) at 50 min. Raising the pH further causes a remarkable decrease of the removal rate of TOC, revealing that the optimal range of pH is 2–5. This range is not very wide but has shown progress compared with that (pH = 3) of the classic Fenton process.
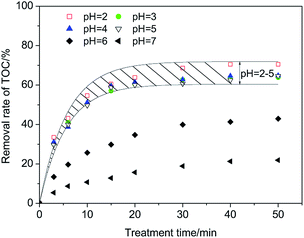 | ||
| Fig. 5 Optimal range of pH in the CFAMW catalyzed Fenton-like process (H2O2 dosage = 12 mg L−1, CFAMW loading = 10 g L−1, [PAM] = 200 mg L−1, T = 313 K). | ||
The difference in the pH range could be caused by the different properties of the catalysts. The performance of Fe2+ in the Fenton process is affected significantly by pH. A pH higher than 3 can cause the oxidation of Fe2+ and precipitation in the form of Fe(OH)3, resulting in the deactivation of Fe2+. Relatively speaking, the effect of pH on the surface of CFAMW is weaker. The active sites on the surface of CFAMW always contain Fe2O3, which have been oxidized to +3. The catalytic process of the active sites is different from Fe2+ and the OH− has a relatively weak effect on the catalytic mechanism.
| Fe3+ + H2O2 → Fe2+ + HO2˙ + H+ | (15) |
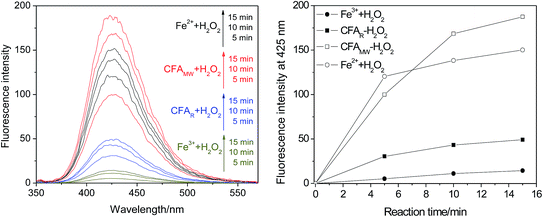
When focussing attention on the Fe2+–H2O2 and CFAMW–H2O2 systems, it is interesting that the amount of ˙OH generated in the Fe2+–H2O2 system is more in the prophase of the reaction (at 5 min) but lesser in the later stage of the reaction (at 10 and 15 min) (see Fig. 6). This result indicates the different advantages reflected by the Fe2+–H2O2 system and the CFAMW-system. As for the Fe2+–H2O2 system, Fe2+ can have a better catalytic capacity than CFAMW. This is the primary reason that more ˙OH can be generated before 5 min. However, as the reaction proceeds, Fe2+ gets oxidized to Fe3+ rapidly but Fe3+ cannot be reduced to Fe2+ in time. Thus, the amount of ˙OH generated reaches a platform with a gentle slope. As for the CFAMW–H2O2 system, CFAMW can have a better catalytic persistence than Fe2+, resulting in the amount of ˙OH generated that catches up with and exceeds that of the Fe2+–H2O2 system at the later stage.
The importance of ˙OH was compared with other free radicals (i.e., ˙HO2/˙O2−) in the CFAMW–H2O2 system. n-Butanol and benzoquinone were applied to scavenge ˙OH and ˙HO2/˙O2−, respectively.29 Under the optimal treatment conditions of the wastewater (75.3% of TOC removal rate), the removal rate of TOC (17.6%) has a remarkable decline in the presence of n-butanol, while 64.1% of TOC can still be removed in the presence of benzoquinone, revealing the ˙OH play a primary role in the CFAMW–H2O2 system, while ˙HO2/˙O2− play the auxiliary role.
| Metallic element | Fe | Al | Ti | Cr | Mn | Ni | Cu | Nb | Ca |
|---|---|---|---|---|---|---|---|---|---|
| 1st run | 0.557 | 0.202 | 0.058 | 0.032 | 0.094 | 0.011 | 0.019 | 0.006 | 0.157 |
| 3rd run | 0.461 | 0.158 | 0.037 | 0.031 | 0.075 | 0.085 | 0.011 | 0.005 | 0.112 |
| 5th run | 0.409 | 0.126 | 0.021 | 0.023 | 0.068 | 0.059 | 0.007 | — | 0.067 |
While the test of the leachability can indicate the possibility of use of CFAMW in the industry from the perspective of environmental protection, the test of stability indicates the economic feasibility. As shown in Fig. S1,† it can be observed that the removal rate of TOC always decreases with the increase in run time (from 63.8% to 52.8%), revealing the loss of the catalytic capacity of CFAMW. This could be caused by the dissolution and loss of the active metallic elements.
This decline of catalytic capacity is common in these studies. As shown in Table S3,† all listed catalysts cannot be used continuously but have a limited run time. The comparison of these catalysts should be conducted on different aspects. The preparation condition of a catalyst is a significantly effective parameter, and a simple and cheap preparation method can decrease the cost of wastewater treatment remarkably. This is the advantage of CFAMW because it was prepared by a single step physical method, i.e., MW irradiation, while other catalysts were prepared by multi-step processes where calcination and chemical reagents were always used. As for the stability and the minimum treatment efficiency, they can mutually affect the efficiency of the catalyst. The catalyst may be reused more times when the minimum treatment efficiency is not limited strictly, whereas it needs to be replaced frequently in a harsher working condition (see Table S3†). Thus, it is more appropriate to compare the stability of different catalysts in identical conditions.
Proposed catalytic mechanism of CFAMW
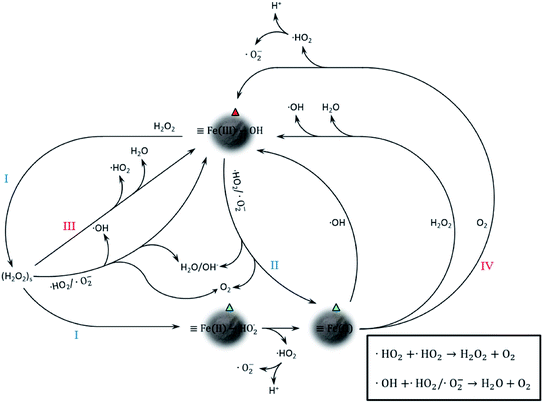
The catalytic mechanism associated with Fe element is shown in Fig. 7. It can be seen that the trivalent Fe on the surface of CFAMW (![[triple bond, length as m-dash]](https://www.rsc.org/images/entities/char_e002.gif) Fe(III)–OH) can be reduced to divalent Fe (
Fe(III)–OH) can be reduced to divalent Fe (![[triple bond, length as m-dash]](https://www.rsc.org/images/entities/char_e002.gif) Fe(II)) through two paths, namely, on reacting with H2O2 (path I) and reacting with ˙HO2/˙O2− (path II). Among the two paths, path I is the main one as H2O2 has an external source (artificial input), while the generation of ˙HO2/˙O2− is accompanied by the consumption of
Fe(II)) through two paths, namely, on reacting with H2O2 (path I) and reacting with ˙HO2/˙O2− (path II). Among the two paths, path I is the main one as H2O2 has an external source (artificial input), while the generation of ˙HO2/˙O2− is accompanied by the consumption of ![[triple bond, length as m-dash]](https://www.rsc.org/images/entities/char_e002.gif) Fe(II) and (H2O2)s (path III and IV).
Fe(II) and (H2O2)s (path III and IV).
Despite the mechanism in Fig. 7 that gives a detailed catalytic path, it is only associated with Fe catalysis and could only be a part of the complicated mechanism in the CFAMW-catalyzed Fenton-like process. Some metallic elements existing in CFAMW (besides Fe) have been reported as additives in the Fe-base Fenton-like catalysis, such as Mn, Ni, Co, Cu, Nb, and V.30–35 Thus, the adjunct catalysis from these elements must be considered. In reality, these metallic elements have two adjunct catalytic paths, i.e., (I) promoting the generation of active species that have oxidation capacity, and (II) promoting the transfer of electron.
As for the generation of the active species, beside the Fe element, the above listed metallic elements can generate ˙OH via the Haber–Weiss path as well.36 Taking the V element for instance, the catalytic process is shown in eqn (16)–(18).
| V(IV) + O2 → V(V) + O2− | (16) |
| O2− + O2− + 2H+ → H2O2 + O2 | (17) |
| H2O2 + V(IV) → OH− + ˙OH + V(V) | (18) |
As for the transfer of electron, different metallic oxides can affect each other by the oxidation–reduction reactions. This can promote the recycling of Bn+x/Bn (n ≥ 1, x ≥ 1), which is critical for the Fenton-like process.
According to the statement above, the heterogeneous catalytic mechanism of CFAMW is actually very complicated because of the mutual effect of the different metallic elements. The detailed mechanism still needs more profound study.
Finally, it has to be noted that the mechanism stated above is based on the surface catalysis, where H2O2 must spread to the surface of CFAMW first before the catalysis by the active sites. However, according to the results in the section “Investigation of ˙OH in different oxidation systems”, the catalysis by the dissolved metallic elements should be considered as well. Thus, the catalysis by CFAMW is a multi-metal catalytic and two-phase process.
Conclusions
MW irradiation can activate the catalytic potential of the CFAR effectively.(I) The most significant factor in the activation process is the CFAR loading, while the importance of the MW power, irradiation time, and mixing speed decline in this sequence. During the MW irradiation, the surface morphology of the CFAR can be changed, and the specific surface area and the pore volume of CFAR can be increased significantly.
(II) In the treatment of the PAM wastewater by CFAMW-catalyzed Fenton-like process, more than 75% of the TOC can be eliminated under the optimal conditions ([H2O2] = 12 mg L−1, CFAMW loading = 10 g L−1, [PAM] = 200 mg L−1, T = 313 K). The variation in the CFAMW loading and PAM concentration can change the degradation path of PAM, while the increase in the H2O2 dosage can only accelerate the degradation of PAM.
(III) The CFAMW can widen the optimal pH range of the classic Fenton process from 3 to 2–5. Moreover, the CFAMW has better catalytic persistence than that of Fe2+ but less catalytic capacity. The leaching of heavy metallic/toxic elements is lower than the limits of the GB8978-1996 standard but it still weakens the stability of CFAMW. The anti-leaching study directed for CFAMW could be promising from the standpoint of industrial application.
(IV) The Fe(III)–OH on the surface of CFAMW contributes to the primary heterogeneous catalytic capacity, while other metallic elements play a role by accelerating the generation of ˙OH and the redox reaction of Fe(III)/Fe(II). The homogeneous catalysis caused by the leached metallic elements cannot be overlooked as well.
Conflicts of interest
There are no conflicts to declare.Acknowledgements
This work was supported by the National Natural Science Foundation of China (grant number 51808039); Science and Technology Projects of Beijing Municipal Education Commission (grant number KM201910017008); National Innovation and Entrepreneurship Training Program for students (grant number 18010282001/005).References
- J. Anotal, N. Wasukran and N. Boonrattanakij, Chem. Eng. J., 2018, 352, 247–254 CrossRef.
- N. N. Wang, T. Zheng, J. P. Jiang and P. Wang, Chem. Eng. J., 2015, 260, 386–392 CrossRef CAS.
- W. Leal, L. A. Lourenco, H. D. Brandao, A. da Silva, S. M. A. G. U. de Souza and A. A. U. de Souza, J. Hazard. Mater., 2018, 359, 96–103 CrossRef PubMed.
- L. Clarizia, D. Russo, I. Di Somma, R. Marotta and R. Andreozzi, Appl. Catal., B, 2017, 209, 358–371 CrossRef CAS.
- J. Zhang, S. Q. Wu, W. J. Bi, X. F. Zhao and G. D. Liu, Mater. Lett., 2019, 234, 13–16 CrossRef CAS.
- C. di Luca, P. Massa, J. M. Grau, S. G. Marchetti, R. Fenoglio and P. Haure, Appl. Catal., B, 2018, 237, 110–1123 CrossRef.
- T. P. H. Ngo and T. K. Le, J. Sol-Gel Sci. Technol., 2018, 88, 211–219 CrossRef CAS.
- Y. Y. Zhou, X. C. Liu, Y. Q. Zhao, S. Luo, L. L. Wang, Y. Yang, M. A. Oturan and Y. Mu, J. Catal., 2018, 365, 184–194 CrossRef CAS.
- C. Y. Su, W. G. Li, X. Z. Liu, X. F. Huang and X. D. Yu, Front. Environ. Sci. Eng., 2016, 10, 37–45 CrossRef CAS.
- S. Jauhar and S. Singhal, Ceram. Int., 2014, 40, 11845–11855 CrossRef CAS.
- J. Gao, L. Wu, S. J. Liang, S. L. Zhang, P. Liu and X. Z. Fu, Chin. J. Catal., 2010, 31, 317–321 CAS.
- A. A. S. Tigue, R. A. J. Malenab, J. R. Dungca, D. E. C. Yu and M. A. B Promentilla, Minerals, 2018, 8, 411 CrossRef.
- N. N. Wang, L. L. Hao, J. Q. Chen, Q. Zhao and H. Xu, Environ. Sci. Pollut. Res., 2018, 25, 12481–12490 CrossRef CAS PubMed.
- S. B. Yang, G. L. Song, Y. J. Na and Z. Yang, Appl. Therm. Eng., 2018, 141, 29–41 CrossRef CAS.
- O. Z. Ozdemir and S. Piskin, Waste Biomass Valorization, 2019, 10, 143–154 CrossRef.
- Y. B. Huang, J. S. Qian and J. Y. Zhang, J. Build. Mater., 2010, 13, 291–294 CAS.
- S. Deng, P. Wang, G. S. Zhang and Y. Dou, J. Hazard. Mater., 2016, 307, 64–72 CrossRef CAS PubMed.
- G. C. Liu, L. Li, L. P. Qiu, S. L. Yu, P. Liu, Y. B. Zhu, J. Hu, Z. Y. Liu, D. S. Zhao and H. J. Yang, J. Membr. Sci., 2018, 545, 348–357 CrossRef CAS.
- T. Zheng, J. Water Reuse Desalin., 2017, 7, 378–386 CrossRef.
- J. G. Yu, W. G. Wang, B. Cheng and B. L. Su, J. Phys. Chem. C, 2009, 113, 6743–6750 CrossRef CAS.
- R. H. G. Ranil, H. M. L. Niran, M. Plazas, R. M. Fonseka, H. H. Fonseka, S. Vilanova, I. Andujar, P. Gramazio, A. Fita and J. Prohens, Sci. Hortic., 2015, 193, 174–181 CrossRef.
- S. Sivalingam and S. Sen, Appl. Surf. Sci., 2018, 455, 903–910 CrossRef CAS.
- R. Kaur and D. Goyal, J. Mater. Cycles Waste Manage., 2016, 18, 186–200 CrossRef CAS.
- M. E. Kalaw, A. Culaba, H. Hinode, W. Kurniawan, S. Gallardo and M. A. Promentilla, Materials, 2016, 9, 580 CrossRef PubMed.
- L. M. Hu, G. S. Zhang, M. Liu, Q. Wang and P. Wang, Chem. Eng. J., 2018, 338, 300–310 CrossRef CAS.
- J. A. Giroto, A. C. S. C. Teixeira, C. A. O. Nascimento and R. Guardani, Chem. Eng. Process., 2008, 47, 2361–2369 CrossRef CAS.
- S. Li, G. S. Zhang, P. Wang, H. S. Zheng and Y. J. Zheng, Chem. Eng. J., 2016, 294, 371–379 CrossRef CAS.
- J. H. Ramirez, F. M. Duarte, F. G. Martins, C. A. Costa and L. M. Madeira, Chem. Eng. J., 2009, 148, 394–404 CrossRef CAS.
- H. Liwei, W. Liguo, R. Sébastien and Z. Hui, J. Hazard. Mater., 2016, 302, 458–467 CrossRef PubMed.
- Q. Wang, X. F. Wang and B. Tian, Water Sci. Technol., 2018, 77, 2772–2780 CAS.
- Y. J. Yao, H. Chen, C. Lian, F. Y. Wei, D. W. Zhang, G. D. Wu, B. J. Chen and S. B. Wang, J. Hazard. Mater., 2016, 314, 129–139 CrossRef CAS PubMed.
- Y. C. Wang, S. Shia, C. Wang and S. Fanga, Environ. Prot. Eng., 2018, 44, 131–145 Search PubMed.
- C. M. Zheng, C. W. Yang, X. Z. Cheng, S. C. Xu, Z. P. Fan, G. H. Wang, S. B. Wang, X. F. Guan and X. H. Sun, Sep. Purif. Technol., 2017, 189, 357–365 CrossRef CAS.
- Z. Jia, S. X. Liang, W. C. Zhang, W. M. Wang, C. Yang and L. C. Zhang, J. Taiwan Inst. Chem. Eng., 2017, 71, 128–136 CrossRef CAS.
- Y. Y. Zhang, J. H. Deng, C. He, S. S. Huang, S. H. Tian and Y. Xiong, Environ. Technol., 2010, 31, 145–154 CrossRef CAS PubMed.
- Z. J. Song, B. Wang, J. Yu, C. Ma, T. Chen, W. Yang, S. Liu and L. S. Sun, Chem. Eng. J., 2018, 354, 517–524 CrossRef CAS.
Footnote |
| † Electronic supplementary information (ESI) available. See DOI: 10.1039/c9ra00875f |
| This journal is © The Royal Society of Chemistry 2019 |

