 Open Access Article
Platinum free thermally curable siloxanes for optoelectronic application – synthesis and properties†
Nils Steinbrück,
Svenja Pohl and
Guido Kickelbick *
*
Saarland University, Inorganic Solid State Chemistry, Campus Building C41, 66123 Saarbrücken, Germany. E-mail: guido.kickelbick@uni-saarland.de
First published on 17th January 2019
Abstract
Polysiloxanes for applications in the area of optical devices are usually based on two-component platinum catalysed cross-linked materials. Here we report the synthesis and properties of a novel one-component siloxane that can be thermally cured showing similar tailorable properties like commercially available encapsulation systems without using a noble metal catalyst. The pre-curing material is formed by an acid catalysed condensation reaction of trialkoxysilanes (TAS), dialkoxysilanes (DAS) and alkoxy-terminated polysiloxanes. NMR analysis of the formed polymeric compounds reveal that the materials are partially cross-linked gels. The obtained compounds can be thermally cured and consolidated at temperatures between 160 and 200 °C. Depending on the composition a tuneable hardness in between 50–90 Shore A, refractive indices of 1.494–1.505, as well as high temperature stabilities up to 443 °C were obtained. The high thermal- and photostability, the high transparency, as well as the tailorable refractive index makes these materials to ideal systems for optoelectronic applications. Investigations under increased temperatures and high-density illumination reveal that the material can withstand conditions, which are typical for high-performance light emitting diodes (LED).
Introduction
The developments in optoelectronic research lead to an increasing interest in new packaging materials suitable for high-performance applications. For instance light emitting diode (LED) curable encapsulations require excellent processability and have to reveal high stability under various conditions to ensure steady optical efficiencies and lifetimes.1–8 The thermal stability required in this context is defined as a resistance against discolouration and changes in transparency caused by the temperatures prevailed at the LED parts which are usually around 120–150 °C.9,10 Beside thermal aging, light initiated photo degradation can occur caused by the constant exposure to high light radiation densities with wavelength between 200–500 nm.10–12 The two most common used packaging materials for optoelectronic applications are two-component polysiloxane elastomers, thermally curable by platinum catalysed hydrosilylation (Scheme 1), or irradiation curable epoxy systems.7,13–17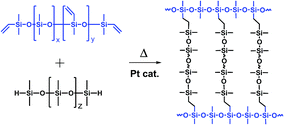 | ||
| Scheme 1 Example of a platinum catalysed hydrosilylation cross-linking reaction of a two-component polydimethylsiloxane resin containing Si–vinyl and Si–H reactive pendant and end groups. | ||
The commercially used two-component polysiloxanes are suitable for many different applications and meet all the important requirements for conventional LEDs with inorganic converters. However, new applications like rare earth reduced LEDs containing converters based on organic dyes have additional requirements. The lifetime of the components in these organic converters often depends on oxygen permeability and the composition of the matrix material.18,19 Platinum traces and reactive hydride groups can potentially interact with the organic dyes and result in a reduced performance of the device. From an ecological and economical point of view, non-recyclable noble metal compounds should be avoided in modern materials. Epoxy based polysiloxanes are a known alternative but a heat- or light-initiated change in properties, like a colouration often occurs.5,20,21 Thiol-en curable polysiloxanes are also potential alternatives.22–24 But sulphur containing systems are not suitable for devices with silvered parts used in common LED technology, due to the formation of silver sulphides colouring the encapsulation.25 Other alternative materials like hybrid sol–gel glasses are often hard and rigid in the consolidated state.26 For applications that require a high flexibility at high temperatures these materials are also not suitable. Variations in the coefficients of thermal expansion of the lead frames, chips, wires, and other device components demand a high elasticity of the packaging material, especially under working conditions. This is one reason why silicone elastomers are currently the most often used encapsulation materials in LEDs.27,28
The development of new platinum free curable polysiloxanes with a high degree of elasticity but also suitable properties for optoelectronic applications was the main goal of our studies. For this reason, new materials were produced by an acid catalysed condensation reaction of different trialkoxysilanes (TAS), dialkoxysilanes (DAS), and alkoxy-terminated polysiloxanes. Heat treatment of the obtained partially cross-linked gel precursor leads to a curing process, which consolidates the material by further condensation reactions of the alkoxysilane groups. The viscosity of the liquid precursor as well as its refractive index can be tailored by its composition, which also influences the properties of the consolidated materials (CM), such as hardness and elasticity.29 Finally we investigated the properties of the resulting materials with respect to applications as packaging materials for optoelectronic devices.
Experimental
Materials
Dimethyldimethoxysilane (97%), methyltrimethoxysilane (97%), phenyltrimethoxysilane (97%) and methoxy terminated polydimethylsiloxane (5-12 cst.) were all purchased from ABCR (Germany). 1,4-Diazabicyclo[2.2.2]octane (98%) was purchased from Alfa Aesar (Germany). Hydrochloric acid was provided from Bernd Kraft GmbH (Germany) and potassium hydroxide (85%) from Grüssing GmbH Analytica (Germany). All chemicals were used as received (Scheme 2). The hydrochloric acid was diluted to pH = 2.5 with demineralised water. Potassium hydroxide was dissolved in methanol (0.11 mol l−1). The purity of all precursors and the averaged chain length of the methoxy-terminated polydimethylsiloxane were characterised by 1H and 29Si NMR spectroscopy (see ESI Fig. ESI1–8†).Instrumentation
Fourier transformed infrared spectra (FTIR) were recorded in total reflectance mode on a Vertex 70 spectrometer (Bruker Corporation, USA) from 4500–400 cm−1 with a resolution of 4 cm−1 increment and 10 scans averaged. UV-VIS transmission measurements were performed on a Lambda 750 instrument (Perkin Elmer Inc., USA) equipped with a 100 mm integration sphere from 700–350 nm with a 2 nm increment and 0.2 s integration time. NMR spectra were recorded on an Avance III 300 MHz spectrometer and an Avance III HD 400 MHz spectrometer (Bruker Corporation, USA) with 300.13/400.13 MHz for 1H NMR spectra and 59.63/79.49 MHz for 29Si NMR spectra. All NMR samples were prepared in methanol-d4 (MeOD4) or chloroform-d (CDCl3). CP-MAS NMR spectra were recorded on an Avance III HD – Ascend 400WB spectrometer (Bruker Corporation, USA) with 13 KHz rotation, 100.65 MHz for 13C and 79.53 MHz for 29Si NMR spectra. The absolute value of viscosity was determined applying a MCR-301 rheometer with a CTD-450 convection heating system (Anton Paar GmbH, Austria) in oscillatory mode with a plate–plate geometry using a 25 mm PP25 measuring plate, an amplitude of 5%, a frequency of 1 Hz and a normal force value of 0. The refractive index was measured using an AR4 Abbé refractometer with a PT31 Peltier thermostat (A. Krüss Optronic GmbH, Germany) at 20 °C and 590 nm LED illumination. Thermogravimetric measurements were carried out applying a TG209 F1 Libra thermo-microbalance (Netzsch-Gerätebau GmbH, Germany) at a heating rate of 10 K min−1 to 250/800 °C with a gas flow of N2/O2 of 20 ml min−1 each. Differential scanning calorimetry was performed with a Netzsch DSC 204 F1 Phoenix calorimeter in aluminium crucibles with pierced lids under nitrogen (100 ml min−1) applying a heating rate of 5 K min−1 from −40 to 400 °C. An Axioskop 50 transmitted light/fluorescence microscope (Carl Zeiss Microscopy GmbH, Germany) with an AxioCam MRc (1388 × 1040 pixel) was used for the visualization of sub millimetre structures. A quadruple film applicator Model-360 (Erichsen GmbH & Co. KG, Germany) was applied to produce 13 × 0.12 mm polymer films on glass object slides (VWR International GmbH, Germany) for transmission measurements. The thickness of the samples was determined applying a FMD12TB precision dial gauge (Käfer Messuhrenfabrik GmbH & Co. KG, Germany) with an accuracy of 1 μm. Hardness measurements were performed using a Sauter HBA-100 Shore-A durometer (Sauter GmbH, Germany). A self-fabricated fibre coupled 450 nm wavelength illumination system with 710 mW LEDs (6 × LDW5SN) was applied as irradiation source for photostability experiments.Preparation
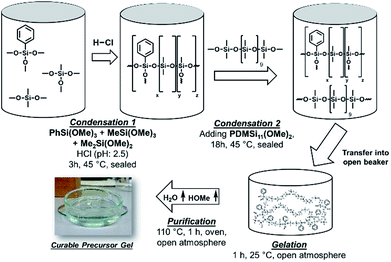
A certain amount of phenyltrimethoxysilane [PhSi(OMe)3], methyltrimethoxysilane [MeSi(OMe)3], dimethyldimethoxysilane [Me2Si(OMe)2], and hydrochloric acid (1.5× n[alkoxysilanes]) were stirred in a sealed vial (45 °C, 3 h, 320 rpm). Methoxy terminated polydimethylsiloxane [PDMSi11-(MeO)2] (0.7% of n[alkoxysilanes]) was added under further stirring (45 °C, 18 h, 320 rpm). The mixture was transferred into a beaker (100 ml) and stirred until gelation occurred (25 °C, 0.5–1 h, 150 rpm). Gelation was detected by homogenous distributed remaining gas bubbles and significant increase of viscosity. The beaker was transferred into a compartment drier to interrupt the gelation by removing water, hydrochloric acid, and methanol (110 °C, 1 h). The observed transparent gels were isolated and cooled to room temperature (Fig. 1). The concentrations used in the synthesis of the different samples are presented in Table 1.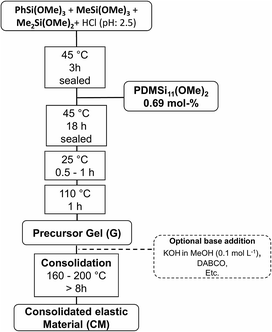 | ||
| Fig. 1 Schematic procedure for the synthesis of a platinum free, thermally curable polysiloxane based material. | ||
| Sample | n[PhSi(OMe)3], mmol | n[MeSi(OMe)3], mmol | n[Me2Si(OMe)2], mmol | n[PDMSi11-(MeO)2], mmol | Ph[calc.]/Ph[1H NMR]a, % | TASb, % | DASb, % | PDMSb, % |
|---|---|---|---|---|---|---|---|---|
| a Percentage of phenyl groups regarding to the total number of alkyl and aryl groups Ph[calc.]: calculated from the weighted portions; Ph[1H NMR]: calculated from the integration of 1H NMR signals (NMR spectra see ESI).b Mole percentage of the summed amount of substance of trialkoxysilanes (TAS), dialkoxysilanes (DAS), and polydimethylsiloxanes (PDMS), respectively. | ||||||||
| 1 | 25.23 | 20.02 | 3.23 | 0.35 | 42.5/42.5 | 92.68 | 6.61 | 0.71 |
| 2 | 25.27 | 17.71 | 6.31 | 0.36 | 39.9/39.9 | 86.58 | 12.72 | 0.70 |
| 3 | 25.23 | 13.24 | 12.59 | 0.35 | 35.4/34.9 | 74.84 | 24.48 | 0.68 |
| 4 | 25.21 | 11.33 | 15.69 | 0.35 | 33.4/33.1 | 69.50 | 29.84 | 0.66 |
| 5 | 25.06 | 8.81 | 18.78 | 0.35 | 31.7/31.3 | 63.90 | 35.44 | 0.66 |
| 6 | 25.21 | 7.69 | 20.44 | 0.37 | 31.0/30.3 | 61.28 | 38.07 | 0.65 |
| 7 | 25.23 | 6.61 | 21.89 | 0.35 | 30.3/29.9 | 58.87 | 40.48 | 0.64 |
| 8 | 25.21 | 4.35 | 25.10 | 0.35 | 28.8/28.8 | 53.73 | 45.63 | 0.63 |
Curing procedure
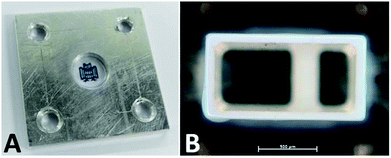
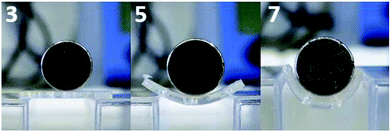
The material was consolidated by heating in a mould or cavity (150–200 °C, 8–72 h). The consolidation time was depending on the materials' composition, the sample thickness, and the consolidation temperature. The consolidation process was terminated when the sample was not sticky anymore at the surface. Addition of small amounts of base (1–20 mmol g−1) to the gel resulted in reduced consolidation times and temperatures (≤60 min). The consolidated materials were crack-free and depending on the chemical composition flexible and elastic (Fig. 2A). The unconsolidated gels were either cast into PTFE (30 × 10 × 1 mm) or aluminium moulds (8 × 2 mm), or films were prepared on glass slides (13 × 0.12 mm) for the mechanical or optical measurements. Samples 1 and 2 were heated for a better processability (110 °C). The prepared samples were consolidated in a compartment drier (160 or 200 °C, 72 h). The observed transparent materials (CM) were cooled to room temperature and isolated. To demonstrate the processability of the precursor polysiloxanes a polyphtalamide LED lead frame (1.4 × 0.7 × 4.0 mm) was cast with samples 4 and 6 by hand. The filled lead frames were heat-treated to cure the polymers (160 °C, 20 h) (Fig. 2B). Further images of the cast lead frames are presented in the ESI.†Base catalysis
Exemplarily one sample was studied to investigate the effect of base catalysis on the curing behaviour. To study this effect potassium hydroxide (0.093 g, 1.65 mmol) was dissolved in methanol (14.949 ml, 0.369 mol, 0.11 mol l−1). Different amounts of this solution (0.0, 1.0 and 2.5 μl) were added and mixed to a portion of a 60 day aged sample 4 (0.2 g) each. The change of viscosity was measured isothermal at 110 °C with the given parameters.Heat and photostability experiments
Long-time stability of the cured polymers was tested after the main curing procedure by heat and irradiation exposure experiments to simulate the operation conditions in high performance LED applications. The sample films on glass substrate were heat treated for 1177 h at 200 °C. After the heat treatment the transmission of the samples was determined. For photostability experiments the aluminium mould cast and cured samples were radiated on a self-prepared fibre coupled 450 nm wavelength illumination system with 710 mW LEDs (6 × LDW5SN) for 692 h. The transmission of the samples was determined at different times during the experiment.Results and discussion
Platinum free cross-linked polyphenylmethylsiloxanes with tailorable properties for optoelectronic applications were synthesised by an acid catalysed hydrolysis and condensation reaction from alkoxysilanes. In the first reaction step trialkoxysilane (TAS) and dialkoxysilane (DAS) monomers were added to diluted hydrochloric acid, hydrolysed and condensed forming oligomer and polymer chains as well as partially cross-linked structures (Fig. 3). After three hours of reaction a methoxy-terminated oligodimethylsiloxane (PDMSi11(OMe)2) was added, which should lead to an additional but less closed-meshed cross-linking of the network (Scheme 3). After further stirring, the reaction was stopped by heating the mixture to 110 °C, which removes the excess of formed methanol and water. The resulting compounds were transparent polymer gels. Phenyltrimethoxysilane [PhSi(OMe)3] was applied as a precursor to increase the refractive index.7 The amounts of PhSi(OMe)3 and methoxy-terminated oligomer [PDMSi11-(MeO)2] were kept constant in the reaction mixture. The quantity of trimethoxysilane [MeSi(OMe)3] was stepwise substituted by dimethyldimethoxysilane [Me2Si(OMe)2]. This exchange of trifunctional T unit monomers by difunctional D units leads to a less cross-linked structure. At the same time, the percentage of phenyl- compared to methyl-groups decreases, which causes a simultaneous decrease of the refractive index.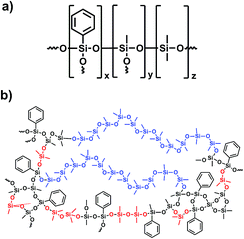 | ||
| Scheme 3 Schematic formula (a) and structure of a consolidated sample (b). TAS (black), DAS (red) and PDMS (blue) are highlighted in the given colours. | ||
The isolated polymers were cured without any further catalytic activation by simple heat treatment of the gels at temperatures above 150 °C remaining water and methanol were removed and a further network forming process was started. In this step, the previous gel-like materials formed solid but elastic cross-linked polymers (Scheme 3b).
Eight gel compositions were synthesised containing different ratios of MeSi(OMe)3 to Me2Si(OMe)2 (Table 1). Addition of small amounts of base to the gels before curing reduces the consolidation time and temperature due to the pH dependency of the condensation reaction.30–33 The unconsolidated gels are also subject to an ageing process, in which the viscosity of the gels increases with storage time at room temperature.
NMR studies of the condensation behaviour
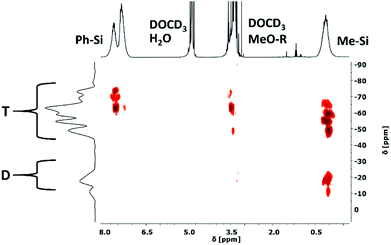
Two-dimensional 29Si–1H HMBC NMR spectroscopy was used to follow the condensation reaction of the different monomers exemplarily for the syntheses of four samples (Fig. 5). Samples 1, 2 and 3 with a stepwise increasing amount of DAS and sample 8 with the highest amount of DAS were chosen. We did not observe any significant differences in the data of samples 3 and 8, therefore no further samples were studied. Small samples were withdrawn from the reaction mixture after 3 h of hydrolysis (before adding PDMSi11-(MeO)2) and after the completed synthesis. Due to the high concentration of the different molecules (hydrolysed and non-hydrolysed, monomers, oligomers, polymers, rings, etc.) the 29Si NMR chemical shifts are very broad which results in a poor resolution of the spectra. Therefore, a range is given for the measured chemical shifts of the different functional groups. The recorded spectra are part of the ESI.† The spectra of sample 1, 2, 3 and 8 show all possible signals of the trifunctional T units except T0 (Table 2). Therefore it can be concluded that all phenyltrimethoxysilane [PhSi(OMe)3], and methyltrimethoxysilane [MeSi(OMe)3] monomers reacted at least with one additional molecule or are part of a linear or cross-linked structure. Furthermore, it appears that all T signal couple with the methoxy groups except T3. Hence, not all methoxy groups of the trialkoxysilanes were hydrolysed before reacting with other molecules. The signals caused by difunctional D units of [Me2Si(OMe)2] show a different behaviour. In sample 1 and 2 with the lowest concentration of Me2Si(OMe)2 no D0 signals of unreacted dialkoxysilane monomers are detected (Fig. 4), which means that all monomers reacted at least once with a second molecule or are part of a linear or cross-linked structure. This argument is supported by the detected D1 and D2 signals. Additionally the D1 signals can be separated in D01 and D11. The indexed number gives the amount of hydroxyl groups attached to the molecule. A D01 signal is caused by a monomer with no hydroxyl group; a D11 signal is caused by a monomer with one hydroxyl group. In the spectra of sample 3 and 8 with an intermediate and high concentration of Me2Si(OMe)2 the D1 signals of end groups and D2 signals of linear or cross-linked units are observed. D0 signals are also detectable in both samples, which belong to the unreacted monomers. We can conclude from these observations that the reactions of the DAS monomers seem to be not completed in the first three hours of stirring. Examining the condensation behaviour of the precursors, we can conclude that TAS reacts with each other and with the DAS forming linear and cross-linked structures. By increasing the DAS concentration, the number of unreacted DAS monomers increases, while no unreacted TAS can be detected in any measured sample. Our synthetic procedure resembles literature known procedures in which the resulting materials are solid, hard, and rigid. However in these studies TAS is condensed first for several hours before DAS is added dropwise.26,34–37 This leads to highly cross-linked structures, mainly consisting of regions with full condensed T3-T3 units with D2, T2 and D1 groups connecting the edges of this regions.38 In our studies the addition of DAS directly to the condensation reaction of TAS units leads to a less cross-linked and flexible structure with T1, T2 and T3 units. After completion of the reaction the D0 signals are not detectable anymore but D1 end groups. All measured NMR spectra are part of the ESI (Fig. ESI7–28).†| 29Si [PhSi(OR)3−x] | 1H [PhSi(OMe)3−x] | 1H [PhSi(OMe)3−x] | Functional Group | Sample 1 | Sample 2 | Sample 3 | Sample 8 |
|---|---|---|---|---|---|---|---|
| a Corresponding atoms are highlighted; di- or trifunctional groups are classified. Detected cross peaks are assigned with a “+”, not detected cross peaks are assigned with a “−”. | |||||||
| −78…−80 | 7.82…7.4 | — | T3 | + | + | + | + |
| −71…−74 | 7.82…7.4 | 3.65…3.28 | T2 | + | + | + | + |
| −66…−69 | 7.82…7.4 | 3.65…3.28 | T2 | + | + | + | + |
| −59…64 | 7.82…7.4 | 3.65…3.28 | T1 | + | + | + | + |
| 29Si [MeSi(OR)3−x] | 1H [MeSi(OMe)3−x] | 1H [MeSi(OMe)3−x] | Functional group | Sample 1 | Sample 2 | Sample 3 | Sample 8 |
|---|---|---|---|---|---|---|---|
| −62…−68 | 0.36…−0.26 | — | T3 | + | + | + | + |
| −56…−60 | 0.36…−0.26 | 3.65…3.28 | T2 | + | + | + | + |
| −52…−56 | 0.36…−0.26 | 3.65…3.28 | T2 | + | + | + | + |
| −44…−50 | 0.36…−0.26 | 3.65…3.28 | T1 | + | + | + | + |
| 29Si [Me2Si(OR)2−x] | 1H [Me2Si(OMe)2−x] | 1H [Me2Si(OMe)2−x] | Functional group | Sample 1 | Sample 2 | Sample 3 | Sample 8 |
|---|---|---|---|---|---|---|---|
| −18…−22 | 0.36…−0.26 | — | D2 | + | + | + | + |
| −15…−18 | 0.36…−0.26 | — | D2 | + | + | + | + |
| −9.5…−12 | 0.36…−0.26 | — | D11 | + | + | − | − |
| −9.5…−12 | 0.36…−0.26 | 3.65…3.28 | D01 | − | − | + | + |
| 2…−5 | 0.36…−0.26 | 3.65…3.28 | D0 | − | − | + | + |
FTIR spectroscopy of the unconsolidated gels
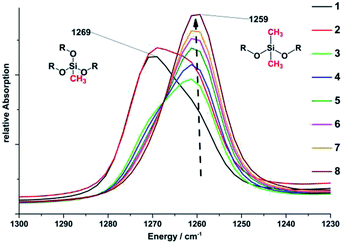
Directly after removing methanol and water at 110 °C for 1 h the freshly prepared gels were cooled to room temperature and characterised by FTIR spectroscopy. All samples show the expected vibration bands of phenylmethylpolysiloxane networks indicated by the very broad ν(Si–O) vibration bands at 1052, 1016, 806 cm−1 and the vibration bands of the methyl and phenyl side groups at 1259, 1269 [δ(C–H[Si–CH3])]; 1130 δ(Si–C)AR, 726 cm−1 [ρ(C–H[Si–(CH3)2])], and 694 cm−1 [ν(Si–C)] (Fig. ESI29†).35 All other vibration bands at 3380 ν(O–H), 2840 [ν(C–H[O–CH3])], and 846 [δ(Si–O–CH3)] are caused by the pendant and terminal methoxy groups as well as unreacted monomers, methanol, or water (Fig. 6). The vibration δ(C–H[Si–CH3]) bands at 1259 and 1269 cm−1 prove the stepwise substitution of methyltrimethoxysilane [MeSi(OMe)3] by dimethyldimethoxysilane [Me2Si(OMe)2] from sample 1 to 8. The vibration band at 1259 cm−1 is caused by the CH3 groups of the MeSi(OR)3 (R = Si, Me, H) units. The vibration band at 1269 cm−1 belongs to the CH3 groups of the Me2Si(OR)2 (R = Si, Me, H) units (Fig. 5). As a result of the substitution the intensity of the band at 1269 cm−1 decreases while the intensity of the band at 1259 cm−1 increases.HCl was used as a catalyst in the hydrolysis and condensation reactions for the preparation of the precursor polysiloxanes. Residues of HCl can be harmful for materials in optoelectronic devices. Therefore, we investigated the presence of HCl after the synthesis of the precursor polymers and were not able to detect any HCl after the heating step in the polysiloxane synthesis by TG-FTIR experiments.
Viscosity of unconsolidated gels
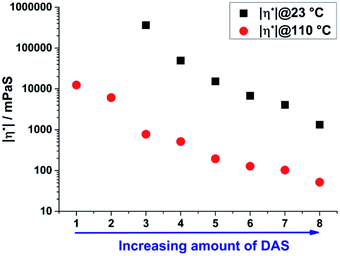
The absolute value of viscosity was determined at 23 and 110 °C directly after the synthesis of the unconsolidated materials using a rheometer in oscillatory mode with a plate–plate geometry to determine the temperature dependent processing range for the materials. Due to the stepwise substitution of TAS by DAS units from sample 1 to 8 a simultaneous decrease of cross-linking respectively of viscosity is expected.16 The viscosity of sample 1 and 2 was too high for a determination at room temperature. An increase in temperature to 110 °C results in a significant decrease of the absolute value of viscosity of the samples from 1 to 8 (Fig. 6). As expected, a decrease of TAS/DAS ratio leads to a decrease of viscosity from 362![[thin space (1/6-em)]](https://www.rsc.org/images/entities/char_2009.gif) 079 to 1324 mPa s. This trend was also reported in literature for vinylphenylpolysiloxane (22
079 to 1324 mPa s. This trend was also reported in literature for vinylphenylpolysiloxane (22![[thin space (1/6-em)]](https://www.rsc.org/images/entities/char_2009.gif) 658 to 3928 mPa s).16 Comparable non vinyl containing but also curable sol–gel based materials are solid and cannot be processed at room temperature but also soften at higher temperatures.26,34–38 Generally viscosities of 10
658 to 3928 mPa s).16 Comparable non vinyl containing but also curable sol–gel based materials are solid and cannot be processed at room temperature but also soften at higher temperatures.26,34–38 Generally viscosities of 10![[thin space (1/6-em)]](https://www.rsc.org/images/entities/char_2009.gif) 000–300
000–300![[thin space (1/6-em)]](https://www.rsc.org/images/entities/char_2009.gif) 000 mPa s respectively 3000–15
000 mPa s respectively 3000–15![[thin space (1/6-em)]](https://www.rsc.org/images/entities/char_2009.gif) 000 mPa s are required for the manufacturing of optoelectronic devices by moulding or dispensing processes.27,28
000 mPa s are required for the manufacturing of optoelectronic devices by moulding or dispensing processes.27,28
Ageing experiment
All prepared samples show an increasing absolute value of viscosity with long storage times at room temperature. This ageing process is caused by the loss of excess of reaction products like water and methanol and by further condensation reactions induced by Si–OMe and Si–OH groups.30,32 The ageing of the gels was studied exemplarily on sample 4 by measuring the absolute value of viscosity isothermally at 30 °C for 260 h. Subsequently the sample was heated to 110 °C to evaluate the processability and to 200 °C to evaluate the curing process after the ageing. The absolute value of viscosity of sample 4 increases during the heat treatment at 30 °C from 32![[thin space (1/6-em)]](https://www.rsc.org/images/entities/char_2009.gif) 000 to 142
000 to 142![[thin space (1/6-em)]](https://www.rsc.org/images/entities/char_2009.gif) 800 mPa s (Fig. ESI32†). A fast increase of viscosity was observed in the first 20 h, afterwards there is only a slow but steady increase up to 260 h. The sample is still liquid and gel like after the ageing. Heating the sample to 110 °C results in a strong decrease of the absolute value of viscosity from 142
800 mPa s (Fig. ESI32†). A fast increase of viscosity was observed in the first 20 h, afterwards there is only a slow but steady increase up to 260 h. The sample is still liquid and gel like after the ageing. Heating the sample to 110 °C results in a strong decrease of the absolute value of viscosity from 142![[thin space (1/6-em)]](https://www.rsc.org/images/entities/char_2009.gif) 800 to 270 mPa s (Fig. ESI33†), which confirms that the processability of the gel is not influenced by the ageing experiment.
800 to 270 mPa s (Fig. ESI33†), which confirms that the processability of the gel is not influenced by the ageing experiment.
Refractive index of unconsolidated gels
Polymeric encapsulation materials in optoelectronic devices require a defined and preferably high refractive index.27,28Especially in applications in which light is uncoupled from a device like LEDs a high refractive index is mandatory to prevent total internal reflection phenomena.8 Commercially used high refractive index (HRI) polysiloxanes often contain aromatic side groups to increase the refractive index. Low index polydimethylsiloxane based systems (LRI) usually reveal an RI of 1.40 while polyphenylmethylsiloxanes show a value of 1.54 (Table 3).7,39,40
| nd20 (LED encapsulant) | Reference |
|---|---|
| a All materials reported in literature are polysiloxane based and were thermally cured applying a platinum catalysed hydrosilylation reaction. The value of S3 was determined in unconsolidated state. | |
| 1.505 | This work (S3) |
| 1.53 | 41 |
| 1.40 | 41 |
| 1.41 | 42 |
| 1.53 | 42 |
| 1.5402 | 16 |
| 1.5597 | 9 |
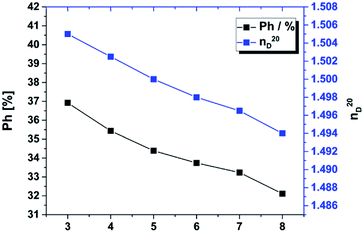
In our materials we used a similar approach. The percentage of phenyl groups decreases from sample 3 to 8 from 37 to 32% (Fig. 7), which decreases the refractive index from 1.505 to 1.494. Based on the gradual substitution of MeSi(OMe)3 by Me2Si(OMe)2 the overall concentration of phenyl groups, which also influences the refractive index.16 The refractive index of sample 1 and 2 could not be determined by Abbé refractometry due to its very high viscosity at 20 °C. By extrapolation we expect the RI of these materials to be in the range of 1.508–1.510.
Curing behaviour investigated by 29Si and 13C CP-MAS NMR and TG-FTIR
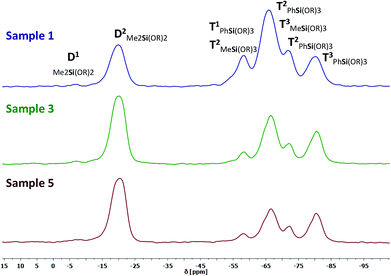
CP-MAS NMR spectroscopy was applied for further characterization of the consolidated materials. The amount of DAS increases from the consolidated samples 1, 3, and 5. We were not able to prepare CP-MAS NMR samples with a higher amount of DAS (sample 6–8) because these compounds were too elastic for grinding. The main objective of this study are the changes in D or T signals caused by the consolidation process. A completely cross-linked structure would be distinguished by T3 and D2 signals only. 29Si and 13C NMR spectra of three samples with different compositions were measured. In the 29Si NMR spectra we detected eight signals for individual Si groups (Table 4). The Me2Si(OSi)(OMe) end groups generate a very weak, barely assignable signal in the D1 range from −5 to −12 ppm (Fig. 8). A second very strong signal can be assigned in the D2 range of −15 to −25 ppm. It indicates a nearly complete linkage of DAS monomers to Me2Si(OSi)2 chain parts or side products like cyclosiloxanes.43 The more high field shifted T signals at −52 to −85 ppm show a splitting in T1, T2 and T3 of the PhSi(OR)3 and MeSi(OR)3 groups. The presence of the different T1 and T2 signals shows that the material is not completely cross-linked. Comparable results were obtained for the inorganic–organic hybrid glasses obtained by the so-called melting gel approach.38 Due to the fact that the very broad chemical shifts of the [PhSi(OR)3−x] and [MeSi(OR)3−x] units were superimposed a quantitative determination was not expedient. The T2 chemical shifts of [PhSi(OR)3−x] are located in the region of −66…−69 ppm. The T3 chemical shift of [MeSi(OR)3−x] are located at −62…−68 ppm. There is no indication for a reasonable separation of the peak areas. Therefore a degree of condensation cannot be calculated accurately. A correlation between the samples composition and the cross-linking degree is given by the systematically decrease of viscosity and hardness and by the increase glass transition temperatures shown in a following chapter.| δ 29Si/ppm [Me2Si(OR)2−x] | δ 29Si/ppm [PhSi(OR)3−x] | δ 29Si/ppm [MeSi(OR)3−x] | |
|---|---|---|---|
| D1 | −5…−12 | — | — |
| D2 | −15…−25 | — | — |
| T1 | — | −59…64 | — |
| Ta2 | — | −66…−69 | −52…−56 |
| Tb2 | — | −71…−74 | — |
| T3 | — | −78…−85 | −62…−68 |
The 13C CP-MAS NMR spectra are in good agreement with the 29Si results showing a not entirely cross-linked structure (Fig. ESI34†). The expected chemical shifts of the carbon atoms at 120 to 140 ppm (Si–Ph), 51 to 47 ppm (–O–CH3), 2 to −2 (–(O)2–Si–(CH3)2) and −2.5 to −8.5 (–(O)3–Si–CH3) of the structure were detected. The chemical shift of –O–CH3 is caused by D1, T1, and T2 units and indicates the not complete hydrolysis of the methoxy groups in these units during the reaction. Related materials described in literature reveal a significant loss of DAS monomers or side products caused by the curing procedure shown by quantitative analysis of the 13C MAS NMR data.38
In the condensation process six and eight membered cyclosiloxanes can be formed and can evaporate at elevated temperatures.38 Because these ring forming reactions are independent of the compositions used, we studied the evaporation gases of the precursor gel of sample 5 exemplarily by TG-FTIR coupling methods. Isothermal heating at 250 °C for 4 h revealed a significant mass loss immediately after raising the temperature (Fig. ESI36†). Additionally, sample 15 was heated to 100 °C and the evaporated gases were directly transferred into a solvent (CDCl3) for further NMR investigations.
The slope of the TG mass curve decreases and approximates a constant value. After 306 minutes at 250 °C the overall mass loss of the sample was 10%. In the IR spectra of the evolved gases the first absorption bands appear at 1350–1600 cm−1 [δ(O–H[H2O])], which indicates the loss of water and at 1268 [δ(C–H[Si–(CH3)])] and 1083, 1033, 808 cm−1 [ν(Si–O–Si)], which indicates the loss of siloxane units at temperatures ≥74 °C (Fig. 9). At 220 °C new vibration bands at 1066, 1033 and 1000 cm2 [ν(C–O)] appear caused by the loss of methanol, which is one reaction product of the condensation reactions. The methanol and DAS signal intensities decrease during the isothermal treatment and disappear completely afterwards. The water signal intensity increases steadily.
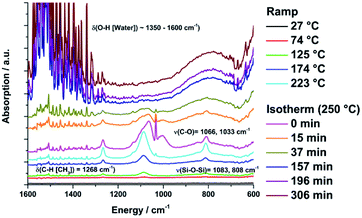 | ||
| Fig. 9 FTIR spectra of the evaporated gasses from sample 5 during the isothermal thermogravimetric measurement at 250 °C for 250 min. | ||
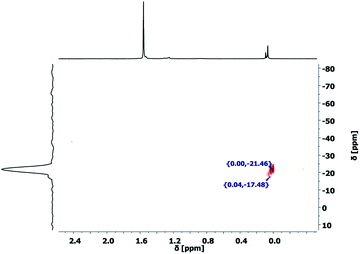
These results show the presence of DAS units in the evaporated gases as well as a significant mass loss of the precursor gel in the first hours of curing. The collected evaporation gases, which were transferred into a NMR solvent were measured with 29Si–1H 2D HMBC NMR experiment (Fig. 10). The 1H NMR spectrum shows three main chemical shifts at 1.53 ppm, caused by water, and 0.09, 0.08 and 0.07 ppm caused by CH3 units at a silicon atom. The only detectable cross peaks with the CH3 units are observed between −17 and −22 ppm can be assigned to D2 structural motifs of (Me2SiO)x molecules.44 This observation proofs the presence of small, fully condensed, and volatile dimethylcyclosiloxanes in the precursor gel and explains the former reported loss of DAS units.38 The formation of these side products during the polycondensation reaction cannot be prevented as long as Me2Si(OMe)2 monomers are involved in the reaction.
These cyclosiloxanes can be formed by DAS monomers and the methoxy-terminated polydimethylsiloxanes during the condensation reactions.30,31 However, the mass loss in the final materials based on formed dimethylcyclosiloxanes is low compared to the mass loss of the excess of water. The properties of the cured material are not influenced by these side products.
Hardness of the consolidated materials
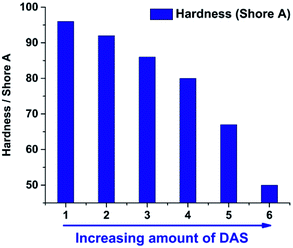
After the liquid gels were cast and consolidated in PTFE moulds the hardness was measured at room temperature with a Shore A durometer. For this purpose the specimen were stacked to get the minimum of thickness required (6 mm). The substitution of MeSi(OMe)3 by Me2Si(OMe)2 enables a tuneable hardness of the consolidated materials. Similar to the viscosity of the unconsolidated gels the hardness can be correlated with the TAS/DAS ratio (Fig. 11). Sample 7 and 8 were too soft for hardness determination. The increase of Me2Si(OMe)2 leads to longer and less cross-linked polymer chains, which directly correlates with the consolidated materials' hardness (Fig. 12).26,45Differential scanning calorimetry
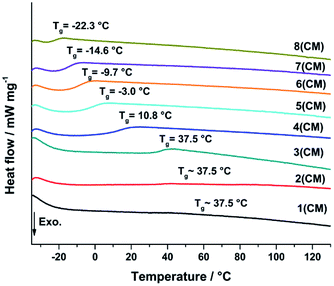
Differential scanning calorimetry (DSC) was used to determine the glass transition temperature (Tg) of the cured samples to verify systematic changes in the cross-linking behaviour (Fig. 14). The Tg is directly correlated to the cross-linking of the silica network and indicated by a inflection in the DSC curve of a sample.46 An increase of Tg indicates an increase of cross-linking between the silicon atoms. The DSC was measured from −40 to 400 °C with 5 K min−1 under N2 atmosphere (100 ml min−1).The DSC curves of samples 3–8 show a consistent decrease of the Tg caused by a decrease of cross-linking as already expected from the hardness measurements (Fig. 13). The substitution of Me2Si(OMe)2 by MeSi(OMe)3 leads to less cross-linked polymer chains and a softer more flexible material resulting in the decrease of Tg.26,35,46,47 The signal intensity of sample 1 and 2 is very weak, which makes the Tg determination less accurate (ESI37†). The Tg of sample 1–3 seems to be equal and not influenced by a further increase of TAS. The degree of cross-linking seems to be constant and maximized.
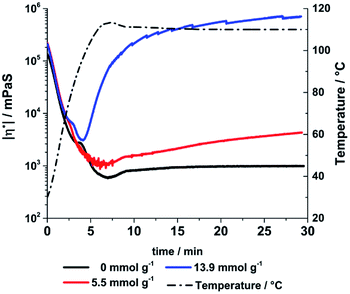 | ||
| Fig. 14 Absolute amounts of viscosity of the aged sample 4 after adding different amounts of KOH measured with oscillation rheometry (5 K min−1 ramp, 110 °C). | ||
Base catalysed consolidation
The thermal consolidation of the liquid polymers is a time consuming process dependent of the thickness of the cast sample and the consolidation temperature. Even at high temperatures up to 200 °C a sufficient consolidation state is only reached after 72 h indicated by the loss of stickiness on the samples surface. Addition of acids or bases to the liquid precursor polymers can catalyse the cross-linking reactions.30 Using a base leads to the deprotonation of hydroxy groups in the main structure which can attack other silicon atoms undergoing a SN2 type reaction. The reaction rate is increased for lowered electron density silicon atoms (ED: Si–O–Si < Si–OH < Si–OR). This catalytic effect was studied by adding small amounts of KOH to one sample exemplarily. For a qualitative demonstration the change in viscosity a 60 days aged sample 4 was determined at 110 °C after adding different amounts of KOH.During the initial heating step all samples showed a decrease of viscosity (Fig. 14). The KOH treated samples showed a significant increase of viscosity at 110 °C, while the viscosity of KOH free sample kept nearly constant. The increase can be directly correlated with the amount of KOH added to the samples. A higher KOH concentration leads to more deprotonated hydroxyl species and increases the reaction and condensation rate respectively. Therefore, the consolidation time and temperature can be tailored by adjusting the amount of added base and it leads to an exemplary reduction of consolidation time from around 72 h to 30 minutes. The consolidation temperature program must be optimised for each composition to avoid bubble formation due to methanol or water evaporation. If the material hardens too fast small gas bubbles remain in the final material. A pre-treatment under reduced pressure before casting is suggested to remove solvent traces or gases. By using small amounts of a weaker base like DABCO (pKb = 5.2) bubble formation can prevented as well.
Transmission, heat and light treatment
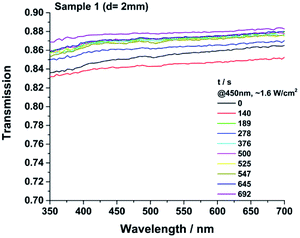
For a comparable transmission measurement all samples have to be smooth, without any inclusions or bubbles and homogeneous in thickness. For this reason, a polymer film of the gel (G) was prepared with a film applicator (13 × 0.12 mm) on glass slides for each sample. The as prepared samples were consolidated in a compartment drier (200 °C, 72 h). Shrinkage occurs, caused by the consolidation process indicated by the thickness change from liquid (0.12 mm) to solid thickness (see ESI†). The actual film thickness was determined at three different spots for each consolidated sample before measuring UV/VIS.All samples show transmission values of >0.98 between 350 and 730 nm immediately after the consolidation procedure (Fig. 16). An additional heat treatment for 1170 h at 200 °C was performed to investigate changes in transparency (Fig. ESI39†). After the heat treatment, no significant change in colour or UV/VIS spectra were detected for samples 3–8. The more cross-linked and very hard materials 1 and 2 were pealed off from the glass slides after the heat treatment. No yellowing of the material was detected. Optical grade epoxy resins and commercial available HRI silicones show a much higher loss of transparency even at 120 °C.8 Non-commercial, literature known platinum catalysed curable polysiloxanes also can show a decrease of transparency causing a discoloration due to a high temperature or light treatment.9,21 Under working conditions of a LED the local temperature at the light emitting parts of a LED for example can reach up to 150 °C and the irradiance can reach values >500 mW mm−2 usually at 450 nm. Therefore a high temperature- and photostability of the packaging materials is required.1–6 The samples 1, 3 and 8 were additionally cast in aluminium moulds (d = 2 mm) to test the irradiation stability at 450 nm as well. After 690 h of irradiation small but unsystematic changes in transparency were detected for the tested samples (Fig. 15). The spectra of sample 3 and 8 are shown in the ESI (Fig. ESI38).† The lower value of transparency of the irradiated samples compared to the heat-treated ones is caused by the higher sample thickness of 2 mm and the slightly structured and unpolished surface of the samples. All measured samples show unsystematic changes. The transparency of sample 1 and 3 increases slightly.
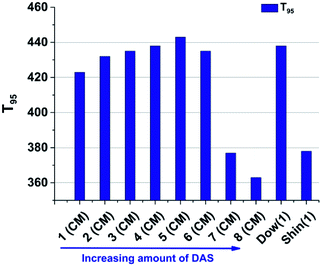 | ||
| Fig. 16 T95 value of sample 1–8. It is >360 °C for all samples, which makes it suitable for high power applications with high temperature working conditions. | ||
Changes in transparency of sample 8 show no trend. The highest decrease in transparency detected is about 0.04. Compared to the reported decrease of transparency of 0.05 for a commercially HRI silicone and over 0.25 for an epoxy resin due to a 480 h UV light treatment the here reported materials show a high photostability.
Thermogravimetric studies
For a further characterization of the heat stability the consolidated materials were heated up to 800 °C with 10 K min−1 and under N2/O2 with a gas flow of 20 ml min−1 to investigate the degradation behaviour respectively (Fig. ESI35†). To evaluate the degradation behaviour of the samples the temperature at which 5% of mass is lost is defined as T95 value.For a comparison of the obtained stabilities, two cured reference encapsulation materials were also measured. The platinum curable silicone resin ShinEtsu KJR9022E [Shin(1)], which is a low refractive index (LRI) polydimethylsiloxane (PDMS), and Dow Corning OE6630 [Dow(1)], which is a high refractive index (HRI) polymethylphenylsiloxane (PMPS). Their components were mixed as specified by the respective manufacturer [Dow(1): 4/1; Shin(1): 10/1] and cured for 4 h at 150 °C.
Generally the T95 of all samples is larger than 360 °C (Fig. 16). No degradation is caused by temperatures lower than 200 °C. This indicates a very high thermal stability for the materials. The reference materials show large differences in their thermal stability. The T95 value of Dow(1) is 438 °C and 378 °C for Shin(1). In general more branched, platinum cured polysiloxane shows higher T95 values compared to less cross-linked or linear systems.48,49 The same result is shown for the reference polymers, where the Dow(1) system is harder (Shore A ∼ 90) and more cross-linked compared to the Shin(1) polymer (Shore A = 42). Also the hybrid glasses show a decrease in degradation temperature caused by a decrease of TAS units, which leads to an decrease of crosslinking and stiffer polymers.47 In our case, the hardness of the material decreases from sample 1 to 8 but the degradation temperature increases at the same time from sample 1 to 5. Sample 6–8 show a decrease of T95. Grassie and others have shown that the degradation reaction of methyl and phenyl containing polysiloxanes depend on the type of the terminal group. Terminal hydroxyl groups can initiate a back-biting process liberating benzene and cyclosiloxanes.50,51 Impurities like water and acid can also influence the rate of degradation.50,52 One possible reason for the increase of degradation temperature from sample 1 to 8 is the increased lability of phenyl groups adjacent to cross-linking T3 units in branched polymer chains.51 By substitution of TAS by DAS units the possibility of phenyl groups next to a T3 unit is reduced. In platinum curable polysiloxane systems this is not a common structural motif. The cross-linking is based on C–C single bonds formed by the hydrosilylation reaction. The decrease from sample 6 to 8 can be explained by the higher concentration of D1 end groups and higher mobility of polymer chains leading to a higher appearance of a back biting degradation mechanism.
Conclusion
A series of platinum free curable polysiloxane based materials were synthesised by an acid catalysed condensation reaction of phenyltrimethoxysilane, methyltrimethoxysilane, dimethyldimethoxysilane, and an alkoxy-terminated polysiloxane. The material properties could be controlled substituting the amount of methyltrimethoxysilane by dimethyldimethoxysilane, which was proven by NMR and FTIR spectroscopy measurements. Two-dimensional 29Si–1H HMBC NMR spectroscopy (2D NMR) was used to characterise the first three hours of condensation reaction. An increasing amount of dimethyldimethoxysilane leads to unreacted monomers in the reaction solution. Therefore, it seems that a reaction of DAS with TAS monomers is more preferred then a dimerization of the DAS monomers. A direct relation between the substitution and a decrease of viscosity was found as well as a correlation between the corresponding decrease of percentage of phenyl groups and a decrease of refractive indices. Due to its gel state the viscosity was low enough for a processing at room temperature for most of the samples. The viscosity of the samples increases slightly due to long time storage verified by rheology. Similar to the precursor's viscosity the hardness of the samples after the curing procedure decreases when methyltrimethoxysilane is substituted by dimethyldimethoxysilane. The consolidated materials show no cracks, bubbles or changes in transparency due to the curing procedure. 29Si and 13C CP-MAS NMR spectroscopy revealed the presence of T2 and T1 signals in the 29Si spectra and the presence of methoxy group signals in the 13C spectra. This indicates an incomplete cross-linked structure. The glass transition temperature of the consolidated samples decreases with the amount of DAS, which verifies the correlated decrease of cross-linking. The loss of DAS units during the consolidation was investigated by TG-FTIR and 29Si–1H 2D HMBC NMR spectroscopy. The presence of volatile dimethylcyclosiloxanes in the precursor gels was proven and mainly responsible for the reported DAS loss. The main mass loss of >10% during the consolidation was caused by the loss of water and methanol.Conflicts of interest
There are no conflicts to declare.Acknowledgements
This research has been funded by the Federal Ministry of Education and Research (BMBF, Germany) in the project ORCA – Organic and rare earth reduced conversion materials for LED-based lightning (project number 03XP0050D). We would like to thank Dr Michael Zimmer for the CP-MAS NMR measurements, Dr Patrick Wenderoth and Dennis Meier for experimental, and Silvia Beetz for technical support.References
- M. Meneghini, L.-R. Trevisanello, G. Meneghesso and E. Zanoni, IEEE Trans. Device Mater. Reliab., 2008, 8, 323–331 CAS.
- S. I. I. Chan, W. S. S. Hong, K. T. T. Kim, Y. G. G. Yoon, J. H. H. Han and J. S. S. Jang, Microelectron. Reliab., 2011, 51, 1806–1809 CrossRef.
- C. W. Hsu, C. C. M. Ma, C. S. Tan, H. T. Li, S. C. Huang, T. M. Lee and H. Tai, Mater. Chem. Phys., 2012, 134, 789–796 CrossRef CAS.
- C. Hang, J. Fei, Y. Tian, W. Zhang, C. Wang, S. Zhao and J. Caers, Proc. - 2013 14th Int. Conf. Electron. Packag. Technol., ICEPT, 2013, vol. 2013, pp. 1126–1129 Search PubMed.
- T. Li, J. Zhang, H. Wang, Z. Hu and Y. Yu, ACS Appl. Mater. Interfaces, 2013, 5, 8968–8981 CrossRef CAS PubMed.
- J. Kim, S. Yang, S. Kwak and Y. Choi, J. Mater. Chem., 2012, 22, 7954–7960 RSC.
- X. Yang, Q. Shao, L. Yang, X. Zhu, X. Hua, Q. Zheng, G. Song and G. Lai, J. Appl. Polym. Sci., 2013, 127, 1717–1724 CrossRef CAS.
- Y. H. Lin, J. P. You, Y. C. Lin, N. T. Tran and F. G. Shi, IEEE Trans. Compon. Packag. Technol., 2010, 33, 761–766 CAS.
- J. S. Kim, S. Yang and B. S. Bae, Chem. Mater., 2010, 22, 3549–3555 CrossRef CAS.
- M. H. Chang, D. Das, P. V. Varde and M. Pecht, Microelectron. Reliab., 2012, 52, 762–782 CrossRef.
- J. Y. Bae, Y. H. Kim, H. Y. Kim, Y. B. Kim, J. Jin and B. S. Bae, ACS Appl. Mater. Interfaces, 2015, 7, 1035–1039 CrossRef CAS PubMed.
- N. Narendran, Y. Gu, J. P. Freyssinier, H. Yu and L. Deng, J. Cryst. Growth, 2004, 268, 449–456 CrossRef CAS.
- Z. Ren and S. Yan, Prog. Mater. Sci., 2016, 83, 383–416 CrossRef CAS.
- I. A. Lei, D. F. Lai, T. M. Don, W. C. Chen, Y. Y. Yu and W. Y. Chiu, Mater. Chem. Phys., 2014, 144, 41–48 CrossRef CAS.
- J. Y. Bae, Y. Kim, H. Kim, Y. Kim, J. Jin and B. S. Bae, ACS Appl. Mater. Interfaces, 2015, 7, 1035–1039 CrossRef CAS PubMed.
- J. Chen, Z. Fu, H. Huang, X. Zeng and Z. Chen, RSC Adv., 2016, 6, 71924–71933 RSC.
- M. Zhao, Y. Feng, G. Li, Y. Li, Y. Wang, Y. Han, X. Sun and X. Tan, Polym. Adv. Technol., 2014, 25, 927–933 CrossRef CAS.
- N. Steinbrück, M. Könemann and G. Kickelbick, RSC Adv., 2018, 8, 18128–18138 RSC.
- M. Könemann, S. Ivanovici, H. S. Mangold, G. Kickelbick and N. Steinbrück, EP18151250.0, 2018.
- Y. Yang, G. Xian, H. Li and L. Sui, Polym. Degrad. Stab., 2015, 118, 111–119 CrossRef CAS.
- R. Wen, J. Huo, J. Lv, Z. Liu and Y. Yu, J. Mater. Sci.: Mater. Electron., 2017, 28, 1–14 CrossRef.
- Y. Gan, X. Jiang and J. Yin, J. Mater. Chem. C, 2014, 2, 5533 RSC.
- S. D. Bhagat, J. Chatterjee, B. Chen and a E. Stiegman, Macromolecules, 2012, 45, 1174–1181 CrossRef CAS.
- Y. Zuo, Z. Gou, J. Cao, X. Li and S. Feng, RSC Adv., 2016, 6, 45193–45201 RSC.
- G. Mura, G. Cassanelli, F. Fantini and M. Vanzi, Microelectron. Reliab., 2008, 48, 1208–1211 CrossRef CAS.
- L. C. Klein and A. Jitianu, J. Sol-Gel Sci. Technol., 2011, 59, 424–431 CrossRef CAS.
- Wacker Chemie AG, Silicone Solutions for High-Performance LEDs - Brochure 6875, 2013 Search PubMed.
- Wacker Chemie AG, Silicone Solutions for High-Performance LEDs - Brochure 6875, 2017 Search PubMed.
- T. Higashihara and M. Ueda, Macromolecules, 2015, 48, 1915–1929 CrossRef CAS.
- U. Schubert, The Sol-Gel Handbook: Synthesis, Characterization, and Applications, Wiley-VCH, 2015, vol. 1 Search PubMed.
- B. Arkles, J. R. Steinmetz, J. Zazyczny and P. Mehta, Silanes and Other Coupling Agents: Factors contributing to the stability of alkoxysilanes in aqueous solutions, 1992 Search PubMed.
- C. J. Brinker and G. W. Scherer, J. Non-Cryst. Solids, 1985, 70, 301–322 CrossRef CAS.
- C. J. Brinker, J. Non-Cryst. Solids, 1988, 100, 31–50 CrossRef CAS.
- A. Jitianu, G. Amatucci and L. C. Klein, J. Am. Ceram. Soc., 2009, 92, 36–40 CrossRef CAS.
- A. Jitianu, G. Gonzalez and L. C. Klein, J. Am. Ceram. Soc., 2015, 98, 3673–3679 CrossRef CAS.
- A. Jitianu, J. Doyle, G. Amatucci and L. C. Klein, J. Sol-Gel Sci. Technol., 2010, 53, 272–279 CrossRef CAS.
- L. C. Klein, S. Kallontzi, L. Fabris, A. Jitianu, C. Ryan, M. Aparicio, L. Lei and J. P. Singer, J. Sol-Gel Sci. Technol. DOI:10.1007/s10971-018-4599-9.
- A. Jitianu, S. Cadars, F. Zhang, G. Rodriguez, Q. Picard, M. Aparicio, J. Mosa and L. C. Klein, Dalton Trans., 2017, 46, 3729–3741 RSC.
- D. Corning, OE6630, http://www.dowcorning.com.
- ShinEtsu, KJR9022, http://www.shinetsu-encap-mat.jp/e/.
- Dow Corning Corporation, LED Packaging - Advanced silicone technology for LED applications, http://www.ellsworth.com/globalassets/literature-library/manufacturer/dow-corning/dow-corning-brochure-silicone-technology-for-led-packaging.pdf Search PubMed.
- Shin-Etsu Chemical Co. Ltd., Encapsulation materials for optical devices, http://www.shinetsu-encap-mat.jp/e/product/k_l/lds/ Search PubMed.
- S. Yoshiyuki, O. Seigo, K. Kazuyuki and K. Chuzo, J. Non-Cryst. Solids, 1992, 139, 25–34 CrossRef.
- Z. Zhang, B. P. Gorman, H. Dong, R. A. Orozco-Teran, D. W. Mueller and R. F. Reidy, J. Sol-Gel Sci. Technol., 2003, 28, 159–165 CrossRef CAS.
- J. Kunz and M. Studer, Kunstst. Int., 2006, 6, 1–3 Search PubMed.
- L. C. Klein, B. McClarren and A. Jitianu, Adv. Mater. Res., 2014, 783–786, 1432–1437 Search PubMed.
- A. Jitianu, K. Lammers, G. A. Arbuckle-Kiel and L. C. Klein, J. Therm. Anal. Calorim., 2012, 107, 1039–1045 CrossRef CAS.
- W. Zhou, H. Yang, X. Guo and J. Lu, Polym. Degrad. Stab., 2006, 91, 1471–1476 CrossRef CAS.
- X. Zhan, H. Liu, J. Zhang, J. Cheng and X. Lin, Ind. Eng. Chem. Res., 2014, 53, 4254–4262 CrossRef CAS.
- N. Grassie and I. G. Macfarlane, Eur. Polym. J., 1978, 14, 875–884 CrossRef CAS.
- N. Grassie, I. G. Macfarlane and K. F. Francey, Eur. Polym. J., 1979, 15, 415–422 CrossRef CAS.
- S. A. Visser, C. E. Hewitt and T. D. Binga, J. Polym. Sci., Part B: Polym. Phys., 1996, 34, 1679–1689 CrossRef CAS.
Footnote |
| † Electronic supplementary information (ESI) available: Including NMR and FTIR data and a LED packaging demonstration section. See DOI: 10.1039/c8ra09801h |
| This journal is © The Royal Society of Chemistry 2019 |


