 Open Access Article
Creative Commons Attribution 3.0 Unported Licence
MoS2 nanosheet mediated ZnO–g-C3N4 nanocomposite as a peroxidase mimic: catalytic activity and application in the colorimetric determination of Hg(II)†
A. Anand Babu Christusa,
P. Panneerselvam *b,
A. Ravikumarb,
M. Marieeswaranb and
S. Sivanesan
 c
c
aDepartment of Chemistry, SRM Institute of Science and Technology, Ramapuram campus, Ramapuram-600 089, Tamil Nadu, India
bDepartment of Chemistry, SRM Institute of Science and Technology, Kattankulathur-603 203, Tamil Nadu, India. E-mail: panneerselvam.pe@ktr.srmuniv.ac.in; panneerchem82@gmail.com
cDepartment of Applied Science and Technology, Anna University, A. C. Tech Campus, Chennai-600 025, India
First published on 1st February 2019
Abstract
A novel colorimetric sensing platform using the peroxidase mimicking activity of ternary MoS2-loaded ZnO–g-C3N4 nanocomposites (ZnO–g-C3N4/MoS2) has been developed for the determination of Hg(II) ions over co-existing metal ions. The nanocomposite was prepared using an exfoliation process, and the product was further characterized using SEM, TEM, XRD and FTIR analysis. The ZnO–g-C3N4/MoS2 possesses excellent intrinsic catalytic activity to induce the oxidation of 3,3′,5,5′-tetramethylbenzidine (TMB) in aqueous solution in the presence of H2O2 to generate deep blue coloured cation radicals (TMB+) which can be viewed with the naked eye and produce absorbance at a wavelength of 652 nm. The addition of a well known bioradical scavenger, glutathione (GSH), to the solution hinders the generation of cation radicals and turns the solution colourless. The introduction of Hg(II) to this solution brings the blue colour back into it, due to the strong affinity of the thiol in the GSH. Based on this mechanism, we have developed a simple and rapid colorimetric sensor for the highly sensitive and selective detection of Hg(II) ions in aqueous solution with a low detection limit of 1.9 nM. Furthermore, the prepared colorimetric sensor was effectively applied for the quantification analysis of real water samples.
1. Introduction
Extensive industrial growth and modern agricultural practices in recent centuries have led to the contamination of natural ecosystems with various heavy metal ions. Among these, mercury is one of the most toxic heavy metal ions and is present in both elemental and organometallic complex forms in the natural aquatic environment.1–4 This water soluble, non-biodegradable divalent mercuric ion causes a wide range of adverse effects to the major organs and systems of the human body such as the brain, kidney, liver, skeletal, immune, nervous and cardiovascular systems.5–9 According to the World Health Organization (WHO), the guideline value of inorganic mercury in drinking water is 30 nM and the permissible level of Hg(II) in natural water bodies was fixed as 10 nM by the United States Environmental Protection Agency (EPA).10 Since serious health problems arise from mercury contaminated water, the research community has shown a significant interest in developing a novel and sensitive analytical tool to detect this potential pollutant below the permissible level given by the EPA.In the past few decades, the detection of mercury in natural water has gained considerable attention, and diverse conventional methods have been employed to detect trace levels of mercury in the aquatic environment such as atomic absorption spectroscopy (AAS), atomic fluorescence spectroscopy (AFS), inductively coupled plasma mass spectrometry (ICP-MS) and inductively coupled plasma atomic emission spectrometry (ICP-AES).11–15 However, all these methods have their own pros and cons; these methods need expensive instruments, complicated pretreatment methods, and highly skilful technicians and it is impossible to do on-site field detection and they are incapable of achieving the necessary detection limit due to the interference of other counter metal ions. To overcome these difficulties and make the detection process more simple and convenient, we need a novel method which is facile, low cost, easy to operate and highly sensitive with portable facilities for the in situ detection of Hg(II) in aqueous solutions. To fulfil all these requirements, a colorimetric method is the one of the best when compared with all other detection methods. By means of the colorimetric sensor, we can rapidly detect the potential pollutant Hg(II) with a marked colour change that can be visualized by the naked eye.16–21
Recently, much research has been done on the synthesis of novel nanocomposite materials that have enzyme mimicking catalytic activity, similar to that of natural enzymes such as catalyzes, oxidase, peroxidase, etc.22 These enzyme mimicking nanocomposite materials play a major role in the colorimetric sensing of heavy metals in aqueous solution, due to their intrinsic catalytic activity, high stability, ease of operation, and cost-effectiveness.23,24 Recently, it was shown that unanticipated peroxidase-like activity was exhibited by various inorganic nanoparticles (NPs) such as CeO2 NPs,25 Co3O4 NPs,26 Au NPs,27 MoS2 nanosheets28 and carbon-based nanomaterials like graphene oxide (GO),29 carbon nanotubes,30 carbon dots,31 carbon nitride32 etc. Moreover, a number of hybrid nanocomposites were fabricated using metal nanomaterials and other matrixes such as GO–Fe3O4 (ref. 33), Pt–MoO3 (ref. 34) and Fe3O4@SiO2@Au@mSiO2 (ref. 35) and the intrinsic peroxidase mimicking activity was explored. It is an extremely challenging job to design a metal nanocomposite with excellent peroxidase like activity. ZnO shows exceptional catalytic properties and these can be further increased with suitable coupling to g-C3N4 nanosheets due to their large surface area and additional active sites on their edges. This hybridized nanocomposite further coupled with a suitable co-catalyst like MoS2 can accelerate the electron transfer at the interface of ZnO and g-C3N4. The hybridized nanocomposite produced by ZnO embedded in co-stacked g-C3N4/MoS2 nanosheets acts as a superior catalyst in peroxidase mimicking activity of the colorimetric detection.
In this study, we have designed a novel switch “off–on” colorimetric sensing system with ternary nanocomposite ZnO–g-C3N4/MoS2, tetramethyl benzidine (TMB), glutathione (GSH), hydrogen peroxide and sodium acetate buffer to detect Hg(II) in an aqueous solution. The sensor turns “on” when the colour of the solution turns blue with the formation of TMB cation radicals due to the oxidation of TMB by ZnO–g-C3N4/MoS2 in the presence of hydrogen peroxide. When GSH is added into the solution, the blue colour disappears and the sensor turns “off”. This was due to the strong radical restoration ability of GSH. When Hg(II) is introduced into the colorimetric system, GSH/ZnO–g-C3N4/MoS2/TMB, the sensor is switched “on” and the blue colour is regained in the solution due to the strong affinity of Hg(II) with thiolated GSH. Based on this sensing strategy, we have newly employed a highly sensitive and selective colorimetric sensor for the detection of Hg(II) in aqueous solutions. The above sensing strategy was successfully applied to real water samples, the promising results of the analysis proved that this can be applied to environmental applications.
2. Experimental section
2.1. Materials and methods
All the reagents and chemicals were purchased as analytical grade and can be used without any further purification. Zinc acetate dihydrate (Zn (Ac)2·2H2O), melamine, sodium molybdate, thiourea, Triton-X, sodium bicarbonate (NaHCO3), hydrogen peroxide (H2O2), sodium acetate, acetic acid, glutathione, and 3,3′,5,5-tetramethylbenzidine (TMB) were purchased from Alfa Aesar (India).The following metallic salts CdCl2, FeCl2, FeCl3, MgCl2, ZnCl2, Pb(NO3)2, MnO2, NaCl, KCl, Cr(NO3)3, CaCO3, PO43−, and SO22− were used to prepare stock solutions for the selectivity study and were bought from Sigma-Aldrich (India). Milli-Q water was used for the preparation of all the solutions in our studies. Organic solvents were purchased from Siscon Research Laboratories Pvt. Ltd (India).
The morphology and structure of the synthesized samples were analyzed using a field emission scanning electron microscope (FE-SEM), FEI Quanta FEG200, and transmission electron microscopy (TEM) analysis was measured using a JEOL/JEM 2100. For sample preparation, the powders were dispersed in ethanol, and a drop solution was dropped onto a 200 mesh carbon-coated TEM grid. X-Ray diffraction (XRD) was carried out using a PAN analytical X’pert powder Diffractometer using Cu-Kα radiation (λ = 0.15405 Å). Fourier transform infrared (FT-IR) spectra were recorded using a Nicolet 400 Fourier transform infrared spectrometer (Madison, WI), a Shimadzu, UV-2600 spectrophotometer was used for the measurement of UV visible spectra and a PHS-3C digital pH meter was used to check the pH values of the solutions.
2.2. Synthesis of g-C3N4 and MoS2
Bulk g-C3N4 was prepared based on a previously reported method.36 In this method, the melamine was heated at 550 °C in a muffle furnace for 4 h. The obtained yellow solid was allowed to cool at room temperature and then well ground in a mortar to get a fine powder of g-C3N4. Then it was washed with water, followed by ethanol and finally dried.MoS2 was prepared according to an earlier reported procedure.37 In this method, 30 ml of aqueous sodium molybdate (6 mmol) and another 30 ml of thiourea (25 mmol) were prepared separately and both solutions were mixed together and sonicated for 30 min. The mixed solution was kept under magnetic stirring for 30 minutes and then transferred into a 100 ml Teflon-lined stainless steel autoclave and heated at 220 °C for 20 hours. After heating it was allowed to cool to room temperature. The obtained solid product was washed with distilled water followed by ethanol and dried at 60 °C for 10 h.
2.3. Exfoliation of MoS2 and g-C3N4
The MoS2 and g-C3N4 nanosheets were prepared by exfoliation of the bulk MoS2 and g-C3N4. MoS2 nanosheets were prepared by dispersing 50 mg of bulk MoS2 in 50 ml of mixed solvent (50![[thin space (1/6-em)]](https://www.rsc.org/images/entities/char_2009.gif) :
:![[thin space (1/6-em)]](https://www.rsc.org/images/entities/char_2009.gif) 50 of ethanol
50 of ethanol![[thin space (1/6-em)]](https://www.rsc.org/images/entities/char_2009.gif) :
:![[thin space (1/6-em)]](https://www.rsc.org/images/entities/char_2009.gif) water) and sonicated for 3 h in an ice bath to control the temperature. Then the mixture was centrifuged to remove the heavier particles and the supernatant solution was dried to get the nanosheets. The same exfoliation method was followed for the preparation of g-C3N4 nanosheets.
water) and sonicated for 3 h in an ice bath to control the temperature. Then the mixture was centrifuged to remove the heavier particles and the supernatant solution was dried to get the nanosheets. The same exfoliation method was followed for the preparation of g-C3N4 nanosheets.
2.4. Preparation of ZnO–g-C3N4/MoS2
Ternary nanocomposite ZnO–g-C3N4/MoS2 was prepared based on the wetness impregnation method. At first, 10 ml of Triton-X 100 (0.32 mmol L−1) was added into 100 ml of NaHCO3 (0.1 mol L−1) in a beaker and allowed to stir in a magnetic stirrer. In this solution, 100 ml of zinc acetate solution (0.1 mol L−1) was added in drops. After 60 minutes 0.6 mg of g-C3N4 nanosheets and 0.6 mg of MoS2 nanosheets were added successively. The mixture was continuously stirred for 12 h, and then heated to evaporate the solvent at 70 °C. The obtained powder was dried at 60 °C for 3 h in a hot air oven and then calcined at 200 °C for 3 h.2.5. Determination of mercury ions in aqueous solution
Mercury ions in aqueous solutions were detected using the colorimetric method at room temperature. In this method, different concentrations of Hg(II) were added separately into solutions containing GSH (100 μL) and sodium acetate buffer (pH = 3.5). The mixture was incubated at room temperature for 15 min. In this solution, 1 ml of 0.1 mM TMB and 500 μL of 0.008 mg ml−1 of ZnO–g-C3N4/MoS2 was added and the final volume of the solutions were made up to 2 ml and incubated for another 10 minutes. Finally, the absorption spectra were measured at 652 nm for all samples with a UV-Vis spectrometer.3. Result and discussion
3.1. Characterization
The surface morphology of the synthesized ternary nanocomposite investigated using Field Emission Scanning Electron Microscopy (FESEM), as shown in (Fig. 1a), inferred that thin layers of g-C3N4 and MoS2 nanosheets were stacked over ZnO. Transmission electron microscopy (TEM) analysis, shown in (Fig. 1b), confirmed that the stacked g-C3N4 and MoS2 nanosheets provide more interfacial contact with ZnO between g-C3N4 and MoS2 nanosheets. The presence of elements such as Zn, O, C, N, Mo, and S present in the ternary nanocomposite was confirmed using EDS and EDS mapping analysis (Fig. S1 and S2†). The XRD patterns of pure materials like MoS2, g-C3N4, ZnO and the composite ZnO–g-C3N4/MoS2 are shown in Fig. 1c. A single tiny diffraction peak at 2θ = 13.9 represents the MoS2, the diffraction peak observed at 2θ = 27.2° is the characteristic peak of pure g-C3N4. The diffraction peaks of pure ZnO with 2θ = 31.2°, 34.8°, 36.8°, 47.6°, 56.7°, 63.4°, 67.8° and 68.1° were matched with the standard data (JPCDS-36-1451). The diffraction pattern of the ZnO–g-C3N4/MoS2 hybrid composite was similar to that of ZnO. However, there were small diffraction peaks observed at 2θ = 13.8° and 27.2° assigned to the characteristic peaks of MoS2, g-C3N4 respectively. From the XRD patterns, it was clear that stacking a few layers of MoS2 and g-C3N4 on ZnO will not affect the structure of ZnO. Fourier transform infrared (FTIR) spectra (Fig. 1d) were recorded for ZnO, MoS2, g-C3N4, and the ZnO–g-C3N4/MoS2 ternary nanocomposite in the range of 500–3750 cm−1. The peak observed at 558 cm−1 corresponds to the bending vibrations of Zn–O. The peaks observed at 810 cm−1 for g-C3N4 and ZnO–g-C3N4/MoS2 correspond to the s-triazine ring of g-C3N4 and the strong interaction between ZnO and g-C3N4 in the case of ZnO–g-C3N4/MoS2. The peak observed at 1243 cm−1 for ZnO–g-C3N4/MoS2 is assigned to aromatic C–N stretching. The broad band recorded in the range of 3000–3500 cm−1 is assigned to the hydroxyl group of H2O. From the FTIR spectral analysis it was confirmed that the obtained ternary nanocomposite was ZnO–g-C3N4/MoS2.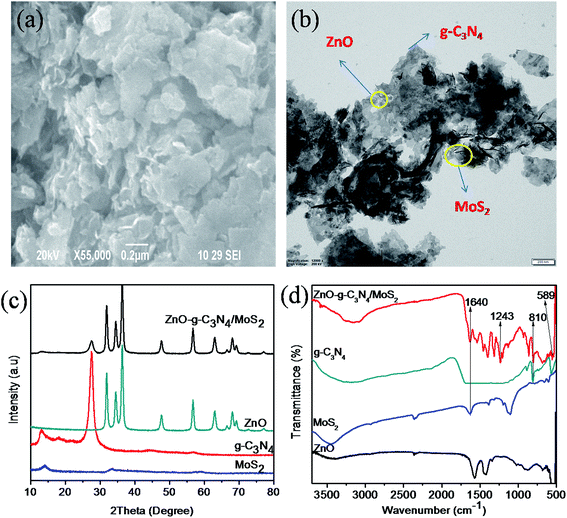 | ||
| Fig. 1 SEM image (a) and TEM image (b) of ZnO–g-C3N4/MoS2, XRD patterns (c) and FT-IR spectra (d) of MoS2, g-C3N4, ZnO and ZnO–g-C3N4/MoS2. | ||
3.2. Peroxidase-like activity of ZnO–g-C3N4/MoS2 nanocomposites
A study was made to determine the peroxidase mimicking catalytic activity of ZnO–g-C3N4/MoS2 nanocomposites using TMB as a peroxidase substrate. The UV-Vis absorption spectrum shown in Fig. 2a indicates that with TMB in the presence of H2O2, the ZnO did not show any characteristic absorption, and for g-C3N4 and MoS2 it shows a moderate absorption at 652 nm. However, for ZnO–g-C3N4/MoS2 a strong absorption peak was observed at 652 nm. These results confirm that the ZnO–g-C3N4/MoS2 nanocomposite possesses good catalytic activity for the oxidation of TMB molecules in the presence of H2O2. Fig. 2b shows a photographic image of the sample solutions used for the measurement of the absorption spectra.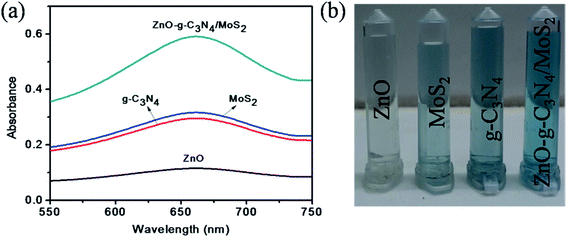 | ||
| Fig. 2 (a) UV-Visible absorption spectra of ZnO, MoS2, g-C3N4, and ZnO–g-C3N4/MoS2 in the presence of TMB, sodium acetate buffer and H2O2 and (b) photographic picture of the test samples. | ||
3.3. Sensing mechanism of the Hg(II)
The scheme in Fig. 3 represents the peroxidase mimicking mechanism of the ZnO–g-C3N4/MoS2-based colorimetric assay for the detection of Hg(II) ions in aqueous solution. The ZnO–g-C3N4/MoS2 composite was designed by embedding ZnO nanospheres on the co-stacked g-C3N4/MoS2 nanosheets. The ZnO nanospheres coupled with g-C3N4/MoS2 nanosheets possess excellent catalytic activity for the oxidation of TMB into its radical cation (TMB+) to produce a deep blue colour in presence of H2O2 solution. The addition of GSH faded the solution colour due to its strong cation restoration properties. When Hg(II) was introduced into the same solution, a strong complex formed between Hg(II) and the thiol group of GSH, which brought the deep blue colour back into the solution. The interaction between GSH and Hg(II) in our mechanism was confirmed with the FT-IR spectra shown Fig. S3.† While comparing the GSH spectrum with that of GSH–Hg, the thiol peak which appeared at 2480 cm−1 in the GSH spectrum disappeared in GSH–Hg spectrum, with the addition of a sharp narrow peak appearing at 1629 cm−1 due to Hg–S interactions.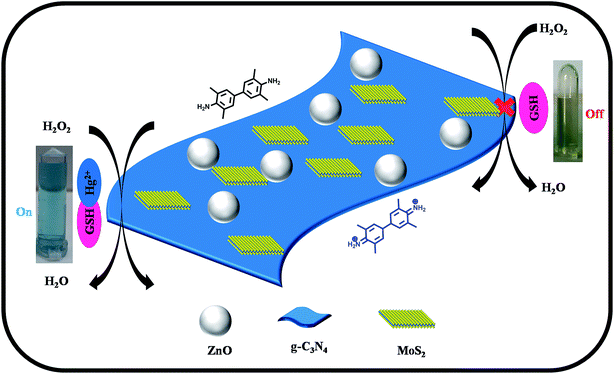 | ||
| Fig. 3 Schematic diagram for the colorimetric detection of Hg(II) ions based on the ZnO–g-C3N4/MoS2 ternary nanocomposite. | ||
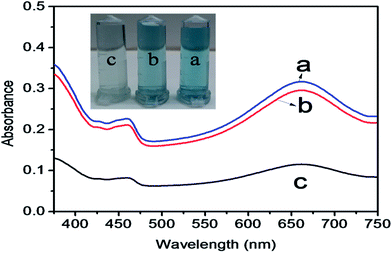
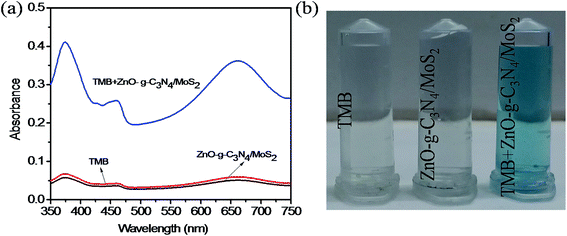
The mechanism of colorimetric sensing of Hg(II) in aqueous solution was investigated with three systems (a, b, c), (a) TMB + ZnO–g-C3N4/MoS2 + GSH + Hg2+, (b) TMB + ZnO–g-C3N4/MoS2 and (c) TMB + ZnO–g-C3N4/MoS2 + GSH. The change in the colour of the systems was visually detected and observed in the UV-Vis absorption spectra at 652 nm. Fig. 4 shows that the absorption peak observed at 652 nm for (a) and (b) and the change in colour of the solution into blue was due to the strong affinity of GSH with Hg(II) in system (a) and the catalytic oxidation of TMB by the substrate nano composite ZnO–g-C3N4/MoS2 in system (b). System (c) does not show any characteristic peak at 652 nm, and the solution appears colourless due to the strong cation restoration ability of GSH by its thiol functionality. The inserted photograph picture in Fig. 4 represents the analytical samples (a, b, c). Further absorption spectra were taken for solutions containing TMB and ZnO–g-C3N4/MoS2 and a mixed solution of TMB + ZnO–g-C3N4/MoS2, as shown in Fig. 5. It was observed that an absorption peak occurs at 652 nM only in the case of the solution containing both TMB and ZnO–g-C3N4/MoS2. No absorption peaks were obtained when the solution contains TMB and ZnO–g-C3N4/MoS2 alone. From the absorption spectra, it was clear that oxidation takes place only when the solution contains both TMB and ZnO–g-C3N4/MoS2. The ZnO–g-C3N4/MoS2 nanocomposite in the presence H2O2 in the solution catalyzed the TMB into its radical ions (TMB+). The photographic picture (Fig. 5b) shows the analytical samples taken for the absorption spectra.
3.4. Optimization of experimental conditions
The colorimetric sensing performance of the synthesized nanocomposite was studied under different reaction conditions such as changes in time, temperature, solution pH and concentration of TMB. Fig. 6a shows that the absorbance increases rapidly as the reaction time increases from 0 to 10 minutes. After 10 minutes there was no change in absorbance noticed because, in the initial stage, the availability of TMB is more in the solution, so the absorbance drastically increases due to oxidation, after 10 minutes most of the TMB molecules were oxidized into TMB+. The effect of reaction temperature is indicated in Fig. 6b, the absorbance value decreases as temperature increases from 30 °C to 50 °C due to the instability of H2O2 at higher temperature. The relative activity of the nanocomposite at different pH values is shown in Fig. 6c. The relative activity increased as the pH of the solution increases from 1 to 3.5 and then decreases due to the instability of H2O2 at higher pH. The relative activity of the ternary nanocomposite increases as the concentration of TMB increases from 10–50 μM (Fig. 6d) and then remains constant. This is may be due to unavailability of oxidant for the oxidation of the TMB in the solution. Based on these results, it was decided to optimize the reaction parameters such as time, temperature, pH and TMB concentration as 10 min, 30 °C, 3.5 and 50 μM, respectively.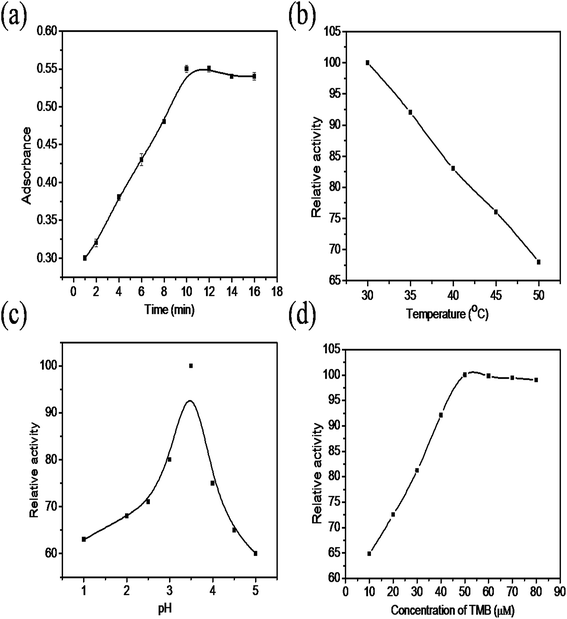 | ||
| Fig. 6 The effect of the (a) incubation time (b) temperature, (c) pH, and (d) concentration of the TMB. | ||
3.5. Colorimetric detection of Hg(II)
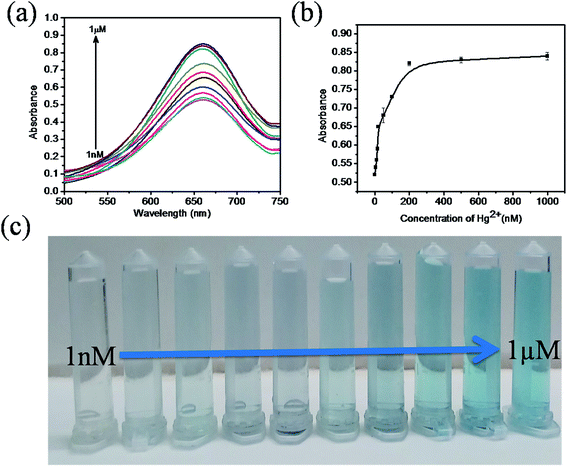
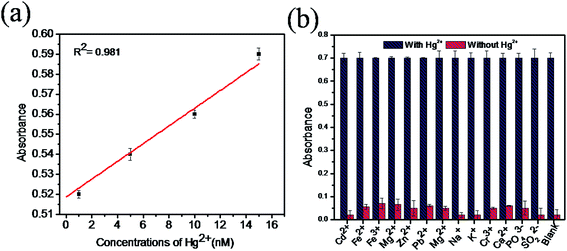
The sensitivity of Hg(II) in aqueous solutions was investigated using the colorimetric method under optimized conditions with different concentrations of Hg(II) in the range of 0 to 1 μM. Fig. 7a clearly reveals that the absorbance value of the sensing system in the UV spectra at 652 nm gradually increases as the concentration of Hg(II) increases from 0 to 1 μM. As the concentration of Hg(II) in the solution increases, the affinity between Hg(II) and GSH increases. This retards the cation restoration properties of the GSH and increases the catalytic oxidation of TMB into TMB radical ions and intensifies the blue colour in the solution. Fig. 7b indicates the relationship between the absorbance intensity and concentration of Hg(II) and Fig. 7c shows the photographic picture of Hg(II) ion solutions with the concentration range 1 nM to 1 μM. A good linear correlation coefficient (R2 = 0.981) exists between the absorbance intensity and concentration of Hg(II) in the range of 1–15 nM, as shown in Fig. 8a, and the limit of detection of Hg(II), calculated using the 3σ method, was 1.9 nM. Comparisons of the detection limit values of various nanomaterial based colorimetric sensors with our sensor are listed in Table 1.| Materials | Detection limit | Real samples | Reference |
|---|---|---|---|
| ZnO–g-C3N4/MoS2 | 1.9 nM | Tap/well/pond water | Present work |
| MnO2 | 0.8 μM | Pool/river water | 23 |
| Graphene–gold nanocomposite | 16 nM | Tap/well/river water | 38 |
| CoS-p-rGO | 14.23 nM | Tap/well/pond/river water | 39 |
| Silver nanoparticles | 2.73 nM | Tap/lake/drinking water | 40 |
| Gold NPs | 8 nM | Pond water | 41 |
| Carbon nanodots | 23 nM | River water | 42 |
3.6. Selectivity for Hg2+ of the proposed colorimetric sensing system
The selectivity for Hg(II) of our sensing system was studied with samples containing different metal ions such as Cd2+, Fe2+, Fe3+, Mg2+, Zn2+, Pb2+, Mn2+, Na+, K+, Cr3+, PO43−, SO32− and Pb2+ with Hg(II) (5 μM) and without Hg(II) under optimal conditions. Fig. 8b shows that all the metal ion samples with mercury show good and equal amounts of absorbance, whereas without mercury, very low absorbance was observed. This result confirms that the presence of coexisting metal ions in the solution does not interfere with the absorption of mercury. Therefore, the proposed colorimetric sensing system is highly selective in the determination of mercury in aqueous solutions.3.7. Detection of Hg(II) ions in real samples
Detection of Hg2+ in real water samples was studied using our colorimetric sensing system under optimal conditions with water samples collected from different sources around the SRM Institute of Science and Technology campus such as tap, well, and lake water. The suspended impurities in the water samples were first filtered with a 0.22 micrometer membrane and the pH was adjusted to 3.5 with sodium acetate buffer. Since the environmental samples do not contains Hg2+, different concentrations of Hg(II) were spiked into the water samples and the recovery of mercury ions was measured using standard methods. The analytical results are displayed in Table 2. All the types of sample were measured thrice, and the results confirmed that our proposed sensing method is highly sensitive and selective in the determination of Hg(II) in real water analysis for environmental monitoring.| Samples | Hg2+ added (nM) | Hg2+ found (nM) | Recovery (%) | RSD (%) |
|---|---|---|---|---|
| Tap water | 10 | 9.94 | 99.4 | 0.46 |
| 25 | 24.6 | 98.4 | 0.38 | |
| 50 | 49.6 | 99.2 | 0.64 | |
| Well water | 10 | 9.88 | 98.8 | 0.40 |
| 25 | 24.2 | 96.8 | 0.68 | |
| 50 | 49.7 | 99.4 | 0.52 | |
| Pond water | 10 | 9.93 | 99.3 | 0.38 |
| 25 | 24.4 | 97.6 | 0.49 | |
| 50 | 48.7 | 97.4 | 0.70 |
4. Conclusion
In precis, a novel colorimetric sensing system was developed to detect Hg(II) in aqueous solution using the hybrid ZnO–g-C3N4/MoS2 nanocomposite as a peroxidase mimicking sensor with TMB and H2O2. The colorimetric signals were produced by the generation of a blue colour in the test solution due to the oxidation of TMB, and vanishing of the colour was due to the restoration of TMB+ by GSH and the regeneration of the blue colour was due to complex formation between Hg(II) and GSH. The sensing mechanism was favored in acidic media with a detection limit value of 1.9 nM, with a linear relationship of R2 = 0.981. This colorimetric assay was successfully applied to detect Hg(II) in real water samples. We expect that this strategy may offer a new approach in developing a selective sensor for monitoring Hg(II) in environmental samples.Conflicts of interest
There are no conflicts to declare.References
- T. W. Clarkson, Crit. Rev. Clin. Lab. Sci., 1997, 34, 369–403 CrossRef CAS PubMed.
- L. R. Goldman, M. W. Shannon and C. o. E. Health, Technical Report:, Pediatrics, 2001, 108, 197–205 CrossRef CAS PubMed.
- R. A. Bernhoft, J. Environ. Public Health, 2011, 2012, 1–10 Search PubMed.
- P. Holmes, K. James and L. Levy, Sci. Total Environ., 2009, 408, 171–218 CrossRef CAS PubMed.
- Y. Bhattachajee and A. Chakaborty, ACS Sustainable Chem. Eng., 2014, 2, 2149–2154 CrossRef.
- T. W. Clarkson, L. Magos and G. J. Myers, N. Engl. J. Med., 2003, 349, 1731–1737 CrossRef CAS PubMed.
- R. K. Zalups, Pharmacol. Rev., 2000, 52, 113–144 CAS.
- I. Hoyle and R. D. Handy, Aquat. Toxicol., 2005, 72, 147–159 CrossRef CAS PubMed.
- Z. Sun, D. Guo, L. Zhang, H. Li, B. Yang and S. Yang, J. Mater. Chem. B, 2015, 3, 3201–3210 RSC.
- G. W. Wu, S. B. He, H. P. Peng, H. H. Deng, A. L. Liu, X. H. Lin, X. H. Xia and W. Chen, Anal. Chem., 2014, 86, 10955–10960 CrossRef CAS PubMed.
- M. Ghaedi, M. R. Fathi, A. Shokrollahi and F. Shajarat, Anal. Lett., 2006, 39, 1171–1185 CrossRef CAS.
- S. Yunus, S. Charles, F. Dubois and E. V. Donckt, J. Fluoresc., 2008, 18, 499–506 CrossRef CAS PubMed.
- D. Beauchemin and S. S. Berman, Anal. Chem., 1989, 61, 1857–1862 CrossRef CAS.
- W. Guo, S. Hu, Y. Xiao, H. Zhang and X. Xie, Chemosphere, 2010, 81, 1463–1468 CrossRef CAS PubMed.
- X. Y. Jia, Y. Han, X. L. Liu, T. C. Duan and H. T. Chen, Spectrochim. Acta, Part B, 2011, 66, 88–92 CrossRef.
- A. Sugunan, C. Thanachayanont, J. Dutta and J. G. Hilborn, Sci. Technol. Adv. Mater., 2005, 6, 335–340 CrossRef CAS.
- X. Zhou, J. Nie and B. Du, ACS Appl. Mater. Interfaces, 2017, 9, 20913–20921 CrossRef CAS PubMed.
- Y. Xiong, L. Su, X. He, Z. Duan, Z. Zhang, Z. Chen, W. Xie, D. Zhu and Y. Luo, Sens. Actuators, B, 2017, 253, 384–391 CrossRef CAS.
- E. Priyadarshini and N. Pradhan, Sci. Rep., 2017, 7, 9278 CrossRef CAS PubMed.
- Z. Yan, M. F. Yuen, L. Hu, P. Sun and C. S. Lee, RSC Adv., 2014, 4, 48373–48388 RSC.
- M. Asra, A. Zara and S. M. Raza, Sens. Lett., 2016, 8(14), 800–807 Search PubMed.
- Z. Chen, J. Yin, Y. Zhou, Y. Zhang, L. Song, M. Song, S. Hu and N. Gu, ACS Nano, 2012, 6, 4001–4012 CrossRef CAS PubMed.
- H. Yang, Y. Xiong, P. Zhang, L. Su and F. Ye, Anal. Methods, 2015, 7, 4596–4601 RSC.
- Y. Lin, J. Ren and X. Qu, Acc. Chem. Res., 2014, 47, 1027–1105 Search PubMed.
- R. W. Tarnuzzer, J. Colon, S. Patil and S. Seal, Nano Lett., 2005, 5(12), 2573–2577 CrossRef CAS PubMed.
- J. Mu, Y. Wang, M. Zhao and L. Zhang, Chem. Commun., 2012, 48, 2540–2542 RSC.
- W. Luo, C. Zhu, S. Su, D. Li, Y. He, Q. Huang and C. Fan, ACS Nano, 2010, 4, 7451–7458 CrossRef CAS PubMed.
- T. Lin, L. Zhong, L. Guo, F. Fu and G. Chen, Nanoscale, 2014, 6, 11856–11862 RSC.
- Y. Song, K. Qu, C. Zhao, J. Ren and X. Qu, Adv. Mater., 2010, 22, 2206–2210 CrossRef CAS PubMed.
- Y. Song, X. Wang, C. Zhao, K. Qu, J. Ren and X. Qu, Chem.–Eur. J., 2010, 16, 3617–3621 CrossRef CAS PubMed.
- W. Shi, Q. Wang, Y. Long, Z. Cheng, S. Chen, H. Zheng and Y. Huang, Chem. Commun., 2011, 47, 6695–6697 RSC.
- T. Lin, L. Zhong, J. Wang, L. Guo, H. Wu, Q. Guo, F. Fu and G. Chen, Biosens. Bioelectron., 2014, 59, 89–93 CrossRef CAS PubMed.
- Y.-l. Dong, H.-g. Zhang, Z. U. Rahman, L. Su, X.-j. Chen, J. Hu and X.-g. Chen, Nanoscale, 2012, 4, 3969–3976 RSC.
- Y. Wang, X. Zhang, Z. Luo, X. Huang, C. Tan, H. Li, B. Zheng, B. Li, Y. Huang, J. Yang, Y. Zong, Y. Ying and H. Zhang, Nanoscale, 2014, 6, 12340–12344 RSC.
- Y. Deng, Y. Cai, Z. Sun, J. Liu, C. Liu, J. Wei, W. Li, C. Liu, Y. Wang and D. Zhao, J. Am. Chem. Soc., 2010, 132, 8466–8473 CrossRef CAS PubMed.
- S. Bai, X. Wang, C. Hu, M. Xie, J. Jiang and Y. Xiong, Chem. Commun., 2014, 50, 6094–6097 RSC.
- S.-K. Park, S. H. Yu, S. Woo, J. Ha, J. Shin, Y. E. Sung and Y. Piao, CrystEngComm, 2012, 14, 8323–8325 RSC.
- Z. Yan, H. Xue, K. Berning, Y. W. Lam and C. S. Lee, ACS Appl. Mater. Interfaces, 2014, 6(24), 22761–22768 CrossRef CAS PubMed.
- P. Borthakur, G. Darabdhara, M. R. Das, R. Boukherroub and S. Szunerits, Sens. Actuators, B, 2017, 244, 684–692 CrossRef CAS.
- Y. Bhattacharjee and A. Chakraborty, ACS Sustainable Chem. Eng., 2014, 2(9), 2149–2154 CrossRef CAS.
- Y. Zhou, H. Dong, L. Liu, M. Li, K. Xiao and M. Xu, Sens. Actuators, B, 2014, 196, 106–111 CrossRef CAS.
- Z. Mohammadpour, A. Safavi and M. Shamsipur, Chem. Eng. J., 2014, 255, 1–7 CrossRef CAS.
Footnote |
| † Electronic supplementary information (ESI) available. See DOI: 10.1039/c8ra09814j |
| This journal is © The Royal Society of Chemistry 2019 |

