 Open Access Article
Synthesis, characterization and electrochemical analysis of cysteine modified polymers for corrosion inhibition of mild steel in aqueous 1 M HCl†
Mohammad A. Jafar Mazumder *
*
Chemistry Department, King Fahd University of Petroleum and Minerals, Dhahran 31261, Saudi Arabia. Web: http://faculty.kfupm.edu.sa/CHEM/jafar/E-mail: jafar@kfupm.edu.sa; Fax: +966-13-860-4277; Tel: +966-13-860-7836
First published on 1st February 2019
Abstract
Butler's cyclopolymerization protocol was used to synthesize homo and copolymers of cysteine residues and diallyldimethylammonium chloride (DADMAC) using water as a solvent and excellent yields were obtained. The structural composition of the polymers was determined using nuclear magnetic resonance (NMR) and Fourier-transform infrared (FT-IR) spectroscopies. The thermal stability of the synthesized polymers was determined using thermogravimetric analysis (TGA). The corrosion efficiencies and adsorption characteristics of these polymers on mild steel were evaluated using gravimetric weight loss and potentiodynamic polarization, and electrochemical impedance spectroscopy (EIS). The copolymers of cysteine residues and DADMAC exhibited excellent inhibition efficiencies in arresting mild steel corrosion in 1 M hydrochloric acid (HCl) at 60 °C. The best fitted Langmuir, Temkin and Freundlich adsorption isotherms suggested that the adsorption process occurs through chemisorption and physisorption. The surface morphology of mild steel in the presence or absence of polymers was determined using atomic force microscopy (AFM), scanning electron microscopy (SEM) and energy dispersive X-ray spectroscopy (EDX), and X-ray photoelectron spectroscopy (XPS). This systematic study might provide a way to design new inhibitor compounds that could be beneficial in the field of biomedical science as well as for anti-corrosion applications.
1. Introduction
Corrosion is a process that damages metal because of its chemical reaction with the environment.1–3 Approximately 25% to 30% of the total economic losses in the oil and gas industry are because of the failure of pipes and other plant systems resulting from metallic corrosion.4–6 Mild steel which has a low carbon (C) content (up to 0.3%) has high mechanical properties, and is found to be readily available, cheap and used for many applications in the oil and gas industries.7 Despite its good properties and applications, mild steel is highly susceptible to corrosion. Typically, corrosive acid solutions are widely used in the oil and gas industry for the removal of corrosive dusts, scales, sludges and etching of metal alloys.8,9Corrosion inhibitors are extensively used in the oil and gas industries for the protection of mild steel from corrosion particularly in aggressive acid media. Numerous papers have reported the use of organic10–12 and inorganic compounds13–15 as corrosion inhibitors, and classified them according to their mode of action. Typically, organic and inorganic inhibitors interfere with the anodic or cathodic reactions occurring on the metal surfaces to minimize or eliminate the corrosion process.16 However, most of the organic and inorganic inhibitors were expensive, and posed a dangerous threat to health and the environment.17 This has steered researchers towards the invention of cheap, readily available, nontoxic, most effective and environment friendly corrosion inhibitors that impart maximum efficiency and least impact on nature and mankind.18–20
Amino acids, which are biogenic, naturally occurring molecules, have been used in pharmaceuticals and biological applications for many years.21,22 There are many reports which have been published in which amino acids have been described as an effective corrosion inhibitor in different aggressive media.23,24 Cysteine and methionine have been studied for their corrosion inhibition of mild steel in 1 N sulfuric acid (H2SO4), and were found to be a mixed-type inhibitors.25 Alanine and glycine have also been studied for the prevention of mild steel corrosion in 0.1 M hydrochloric acid (HCl), and their effectivenesses were found to be 80.0% and 78.9%, respectively, at 10 mM.26 Amin et al. tested the corrosion inhibition efficiency of alanine, cysteine and S-methyl cysteine for iron in 1 M HCl, and maximum inhibition efficiencies were reported to be 77.3%, 86.0% and 94.2%, respectively, at 5.0 mM.27 Cysteine which contains a mercapto group in its molecular structure was found to be the most effective compared to the other inhibitors. Barouni et al.28 studied the inhibitive effect of valine, glycine, arginine, lysine and cysteine. This study revealed that cysteine, because of its –SH functionality, provides better inhibition efficiency than the other amino acids tested. The influence of sulfur containing amino acids, particularly methionine, cysteine, and N-acetyl cysteine, on the corrosion behavior of mild steel in a highly concentrated solution of phosphoric acid (H3PO4) in the presence and absence of chloride, fluoride and ferric ions (Cl−, F− and Fe3+) ions were investigated by Morad et al.29 The inhibitive effect of cysteine on copper metal in 0.6 M sodium chloride (NaCl) and 1 M HCl was also investigated by Ismail.30 The synergistic inhibitive effect of cysteine and copper(II) [Cu(II)] ions on iron in 0.5 M H2SO4 was investigated by El-Deab.31 Saifi et al.32 investigated the inhibitive action of cysteine, which promotes the cathodic dissolution of a cupronickel (Cu–30Ni) alloy in aerated 0.5 M H2SO4. Helal and Badawy33 studied the inhibitive action of some amino acids including phenylalanine and cysteine on magnesium–zinc–aluminium (Mg–Zn–Al) alloy in chloride free neutral solutions. The halide and cationic, anionic and non-ionic surfactants have also been added to the amino acid L-cysteine for the improvement of its inhibition efficiency, but no significant improvement of inhibition efficiency was observed.34
In recent years, different polymers have been studied as potential corrosion inhibitors because of their availability, stability, processability, cost effectiveness, large surface area, and multiple anchoring sites in the form of atoms and/or functional groups which can easily form a bond with metal ions and adsorb onto the metal surface.35–37 Poly(vinylpyrrolidone) and polyethylenimine in H3PO4 have been used to study the corrosion efficiency of low carbon steel.38 Poly(diallydimethylammonium chloride) (pDADMAC) together with polyaniline has been successfully applied as a composite corrosion inhibitor for pure iron in 1 M HCl. The maximum inhibition efficiency at a concentration of 150 ppm was reported to be 59.0% for 25.0% pDADMAC containing a polyaniline composite.39 There are huge demands for pDADMAC, excluding its use in other applications, over 35 million pounds of it alone are sold per year for water purification and personal care formulations.40 In view of its performance, efficiency and applicability of pDADMAC and amino acids, it was realized that a polymer having diallylammonium salts with a cysteine residue would keep the integrity of its sulfide motifs, carboxyl groups and unquenched nitrogen (N) valency (i.e., a trivalent N with its lone pair of electrons), which might be useful to protect mild steel from corrosion.
In this paper, the synthesis of homo and copolymers of pDADMAC and cysteine residues, and studies of the inhibitive actions of this new class of synthetic polymers as corrosion inhibitors for mild steel in 1 M HCl are reported. The presence of quaternized as well as pH-responsive N together with oxygen (O) and sulfur (S) as well as multiple anchoring points in a polymer chain has provided an opportunity for the evaluation of their inhibition efficiencies as a potential green corrosion inhibitor in 1 M HCl using different spectroscopic, microscopic and electrochemical techniques.
2. Experimental
2.1 Materials
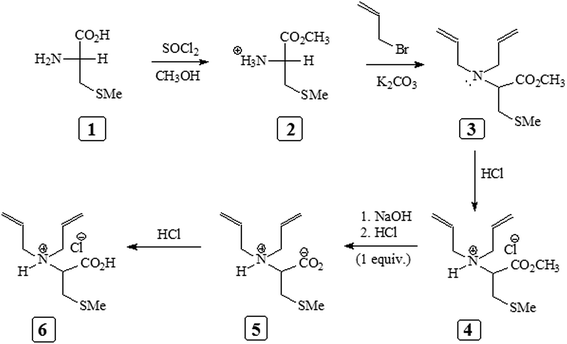
The diallyldimethylammonium chloride (DADMAC) and poly(diallyldimethylammonium chloride) (pDADMAC) (40 wt% solution in water) and 2,2′-azobis(2-methylpropionamidine)dihydrochloride (AMPD) initiator were purchased from Sigma-Aldrich and used as received. The S-methyl-L-cysteine 1 (Scheme 1) was obtained from Fluka Chemie AG and used as received. Thionyl chloride (SOCl2), HCl (37% w/v), methanol (CH3OH), acetone, diethyl ether, acetonitrile and potassium carbonate (K2CO3) were purchased from BDH Chemical Ltd and used as received. Allyl bromide was obtained from Fluka Chemie AG and used without further purification. Water (H2O) was purified and de-ionized using a Milli-Q system from Millipore. All glassware was cleaned using de-ionized water. The detailed procedure for the synthesis of methyl-2-amino-3-methylthiopropanoate hydrochloride (2), N,N-diallyl-L-cysteine methyl ester (3), N,N-diallyl-L-cysteine methyl ester hydrochloride (4), and cysteine residual cationic monomer (6) (Scheme 1) are given in the ESI.†2.2 Characterization
A PerkinElmer 16F PC Fourier-transform-infrared (FT-IR) spectroscope was used to record the IR spectra, and proton nuclear magnetic resonance (1H-NMR) and carbon-13 NMR (13C-NMR) spectra were obtained using a Jeol LA 500 MHz nuclear magnetic resonance (NMR) spectrometer. Elemental analysis was performed using a PerkinElmer 2400 elemental analyzer. An Ubbelohde viscometer with a viscometer constant of 0.005317 mm2 s−2 was used to determine the intrinsic viscosity of the synthesized polymers. A TA Instruments SDT Q600 thermogravimetric analyzer was used to perform the thermogravimetric analysis (TGA) under nitrogen (N2; flow rate of 50 mL min−1) using a matched platinum/platinum–rhodium thermocouple pair, and increasing the temperature from 20–800 °C by 10 °C min−1.2.3 Test solutions
The HCl solution was prepared by diluting the concentrated HCl (37%, reagent grade) to a concentration of 1 M, with distilled, de-ionized water. The polymer compounds 7–9 at the required concentration in ppm were dissolved in 1 M HCl. The 1 M HCl solution containing no polymer compound was used as the blank.2.4 Synthesis
| Entry no. | Monomer (6) (mmol) | DADMAC (mmol) | Solvent (g) (water/conc. HCl) | AMPD (mmol) | Time (h) | Polymer yield (%) | [η]b (dL g−1) |
|---|---|---|---|---|---|---|---|
| a Polymerization reactions were carried out using appropriate concentrations of monomer 6 with/without DADMAC in the presence of 2,2′-azobis(2-methylpropionamidine)dihydrochloride (AMPD) initiator at 60 °C to give polymer 7 and 8 in solvent water/conc. HCl.b Viscosity of 1–0.125% solution of 7, 8 and 9 in 0.1 M NaCl at 30.0 ± 0.1 °C was measured using a Ubbelohde viscometer (K = 0.005317 mm2 s−2).c Poly(diallyldimethylammonium chloride) (pDADMAC) was obtained from Sigma-Aldrich. | |||||||
| 1 | 8 | — | (0.75/0.23) | 11.62 | 40 | (7) 81 | 0.153 |
| 2 | 6 | 6 | (1.06/0.15) | 1.20 | 28 | (8) 65 | 0.189 |
| 3 | — | — | — | — | (9)c— | 0.174 | |
2.5 Mild steel sample
The mild steel coupons (C1010, S&A, WGH) were cut into a rectangular shape with a diameter of 2.5 cm × 2.0 cm and a thickness of 0.1 cm, and then used in the gravimetric weight loss measurements and surface analysis. The mild steel coupons having an approximate stem of 3 cm embedded in Araldite with a thickness of 1 mm and exposed area of 2 cm2 were used in all the electrochemical and impedance measurements. The mild steel samples were mechanically ground with different grades of emery paper (100, 400, 600 and 1500 grit size), followed by degreasing and cleaning with acetone. They were then washed with deionized water, dried in a vacuum oven and stored in a desiccator for further experiments. The percentage chemical compositions of the mild steel samples were as follows: C (0.089), Cr (0.037), Cu (0.005), Fe (99.47), Mn (0.34), Mo (0.007), Ni (0.022), P (0.010) and V (0.005).2.6 Corrosion evaluation methods
 | (1) |
In a temperature controlled bath, the weight loss measurements including three blanks were carried out as a set of experiments. For an example, when the weight loss experiments were performed for various concentrations of polymer 7, three mild steel coupons with initial masses 4.1376, 4.0121 and 3.9505 g with surface areas of 11.42, 11.41 and 10.90 cm2, respectively, were analyzed without the polymer (blank). The blank samples lost masses of 0.3482, 0.3302 and 0.3354 g, respectively, after 6 h immersion in 1 M HCl at 60 °C. Using the formula:
| corrosion rate (CRcorr; mm per year) = 87.6W/(DAT) |
2.6.2.1 OCP versus time. The required time to reach steady open circuit potential (OCP) at the surface of mild steel coupons immersed in different concentrations (1 or 50 ppm) of polymer compounds 7, 8 and 9 for different times (0 to 240 min) in 1 M HCl solution, were measured.
2.6.2.2 Tafel extrapolation. The electrochemical measurements were conducted in a four necked round bottomed flask connected with a three electrode electrochemical cell in which a saturated calomel electrode (SCE), graphite rod and mild steel samples were used as reference electrode, auxiliary electrode and working electrode, respectively. Prior to the measurements, the electrodes were corroded in 1 M HCl containing test solution for 45 min at 60 °C to reach a stable OCP. An Autolab 10A-BST707A potentiostat–galvanostat (Eco Chemie) connected with a computer having NOVA software (version 1.8) recorded the polarization curves with a set cut off current of 10 mA and a potential scan window of ± 250 mV/SCE around the corresponding OCP with a scan rate of 0.5 mV s−1.
The corrosion current densities obtained from the polarization curves were used in eqn (2) to calculate the percentage inhibition efficiency:
 | (2) |
2.6.2.3 Linear polarization resistance (LPR). The LPR data was recorded using the same electrochemical cell and the conditions described in Section 2.6.2.2 (Tafel extrapolation) with a potential scan range of ± 10 mV around Ecorr. The surface coverage (θ) values were calculated from eqn (3) using the polarization resistance obtained in presence
 and absence
  of polymer compounds:
 | (3) |
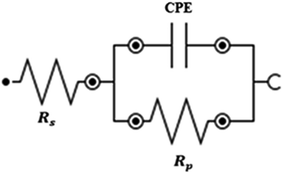
2.6.2.4 Electrochemical impedance spectroscopy (EIS). The electrochemical cell, consisting of three electrodes, which were connected to the computerized potentiostat–galvanostat system described in Section 2.6.2.2 (Tafel extrapolation), was used to measure the electrochemical impedance values in 1 M HCl containing test solution (presence or absence of polymers) at 60 °C. The Nova software (version 1.8) was used to process the Nyquist and Bode plots at the corresponding OCP in a frequency range from 100 kHz to 50 mHz with an amplitude of 10 mV. The most suitable (lowest deviation from the experimental values) electrochemical equivalent circuit was used to fit the data obtained from impedance measurements.
2.7 Surface characterization
3. Results and discussion
3.1 Synthesis of the polymer compounds
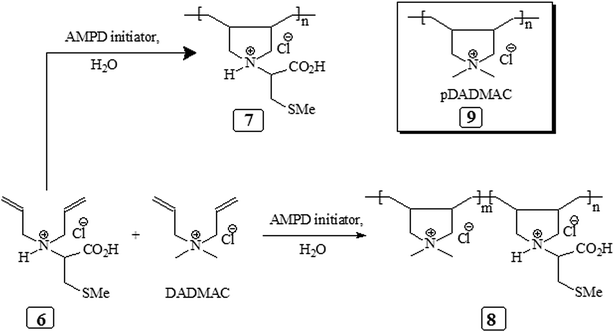
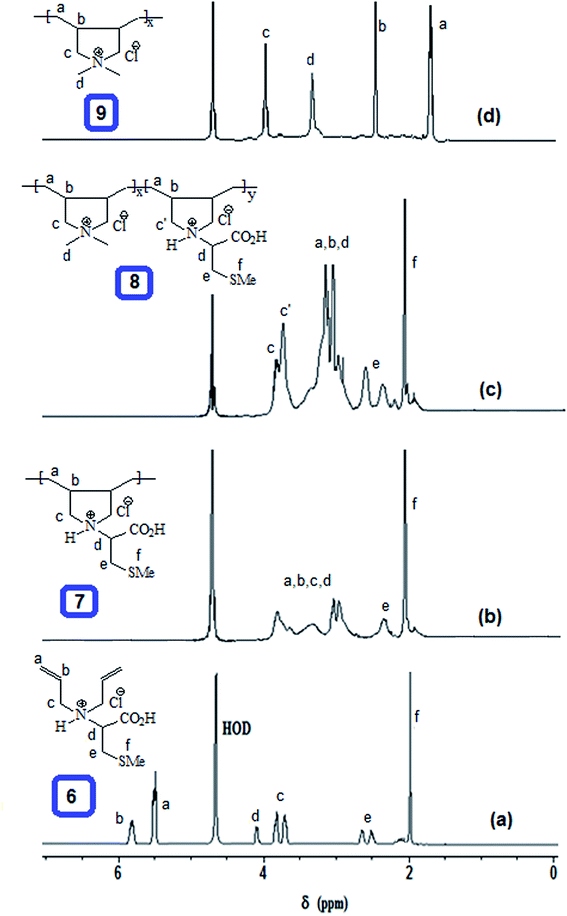
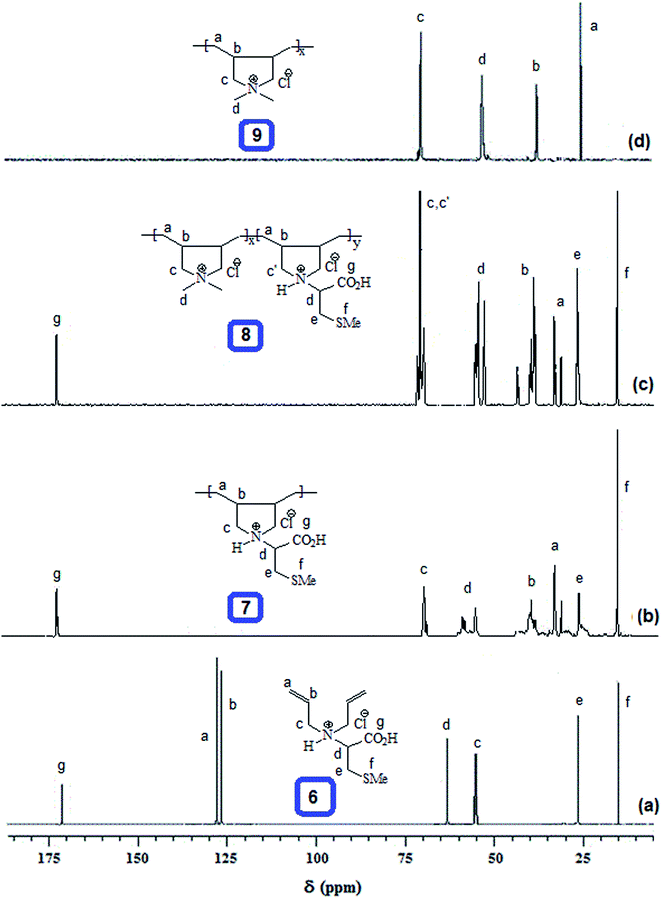
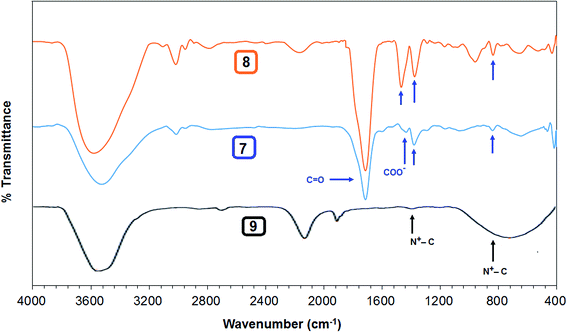
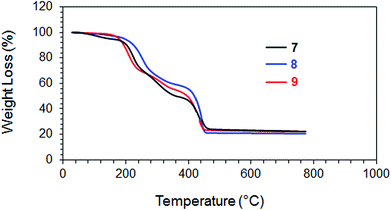
The homo and copolymers of diallylammonium salts and/or their alternate copolymerization with DADMAC were synthesized in water using Butler's cyclopolymerization protocol40,43–45 which is important in the syntheses of industrially significant ionic polymers 7 and 8 in excellent yields (Scheme 2). The pDADMAC is denoted as polymer 9. The structures of the monomers and polymers were characterized using NMR and FT-IR. The 1H-NMR and 13C-NMR spectra of 7, 8 and 9 are shown in Fig. 1 and 2, respectively. The absence of alkene proton or carbon signals in the polymer spectra shows that the monomer has been converted to a polymer. A closer look at the proton spectrum of 7, 8 and 9 in deuterium oxide (D2O) showed the presence of different CH2 signals at 3.68 ppm and 3.80 ppm,46–48 respectively, which were attributed to the presence of a polymer containing DADMAC and cysteine. The 13C signals around 170 ppm48 were attributed to the carbonyl groups in the repeating units of 6, 7 and 8 (Fig. 2). However, no such signal appeared in the repeating unit of 9. The FT-IR spectra (Fig. 3) shows that a sharp stretching vibration around 3450 cm−1 which was attributed to the presence of a non/free hydrogen bonded N–H group.47,48 Similarly, a strong absorption band appeared at 1705 cm−1 for 7 and 8 which was attributed to the presence of a non/free hydrogen bonded C![[double bond, length as m-dash]](https://www.rsc.org/images/entities/char_e001.gif) O stretching vibration of the CO2H group.47,48 This stretching vibration band was absent in polymer 9. The symmetric and antisymmetric stretching band appeared at ≈1400 and ≈1421 cm−1, respectively, and these were thought to be COO− motifs in polymers 7 and 8.49 The C–N stretching and bending peak appeared at ≈1350 and ≈800 cm−1, respectively, and were attributed to the C–N–C motifs present in polymers 7, 8 and 9. All these polymers were readily soluble in water, CH3OH and ethanol. The intrinsic viscosities of the polymers 7, 8 and 9 were obtained from viscosities of 1–0.125% solutions in 0.1 M NaCl at 30 °C using Mark–Huggins viscosity relationship. The intrinsic viscosities [η] of 7, 8 and 9 were determined to be 0.153, 0.189 and 0.174 dL g−1, respectively (Table 1). The relatively low intrinsic viscosity values indicated the low masses of the polymers. The TGA was used to study the degradation/chemical stability of the synthesized polymers. The TGA curves for the polymers 7–9 (dried under vacuum at 55 °C for 12 h) revealed the weight losses at various temperature ranges (Fig. 4). A loss of ≈4–8% up to 190–220 °C accounted for the removal of moisture. An accelerated loss of an additional ≈40% for the polymers in the range ≈360–420 °C may be linked to the removal of different pendant groups. A major weight loss transition was observed at 220–450 °C. A residual weight of ≈20% remained at 800 °C. This variation in weight loss was because of the differences in the structures of the hard segments of the polymers. Overall, all these polymers were found to be stable up to ≈200 °C.
O stretching vibration of the CO2H group.47,48 This stretching vibration band was absent in polymer 9. The symmetric and antisymmetric stretching band appeared at ≈1400 and ≈1421 cm−1, respectively, and these were thought to be COO− motifs in polymers 7 and 8.49 The C–N stretching and bending peak appeared at ≈1350 and ≈800 cm−1, respectively, and were attributed to the C–N–C motifs present in polymers 7, 8 and 9. All these polymers were readily soluble in water, CH3OH and ethanol. The intrinsic viscosities of the polymers 7, 8 and 9 were obtained from viscosities of 1–0.125% solutions in 0.1 M NaCl at 30 °C using Mark–Huggins viscosity relationship. The intrinsic viscosities [η] of 7, 8 and 9 were determined to be 0.153, 0.189 and 0.174 dL g−1, respectively (Table 1). The relatively low intrinsic viscosity values indicated the low masses of the polymers. The TGA was used to study the degradation/chemical stability of the synthesized polymers. The TGA curves for the polymers 7–9 (dried under vacuum at 55 °C for 12 h) revealed the weight losses at various temperature ranges (Fig. 4). A loss of ≈4–8% up to 190–220 °C accounted for the removal of moisture. An accelerated loss of an additional ≈40% for the polymers in the range ≈360–420 °C may be linked to the removal of different pendant groups. A major weight loss transition was observed at 220–450 °C. A residual weight of ≈20% remained at 800 °C. This variation in weight loss was because of the differences in the structures of the hard segments of the polymers. Overall, all these polymers were found to be stable up to ≈200 °C.
3.2 Corrosion evaluation
| Sample | η (%) at concentration of inhibitors (in ppm) | ||||||
|---|---|---|---|---|---|---|---|
| 1.00 | 2.50 | 5.00 | 10.0 | 25.0 | 50.0 | 100 | |
| a Inhibition efficiency, (i.e., η) = surface coverage θ.b Corrosion rate for a set of three blank experiments was found to be 55.8 ± 1.5 mm per year. The blanks repeated on several other occasions gave a CR within 1–3%. | |||||||
| 7 | 43.4 | 51.2 | 60.3 | 71.4 | 82.3 | 85.1 | 87.6 |
| 8 | 64.0 | 69.8 | 76.4 | 82.8 | 94.9 | 99.4 | 99.5 |
| 9 | 31.9 | 45.2 | 54.0 | 65.4 | 77.1 | 81.7 | 82.3 |
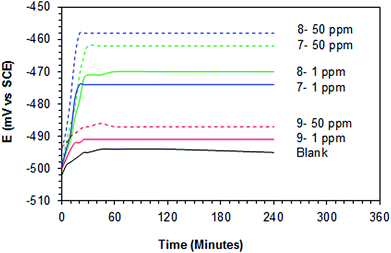 | ||
| Fig. 5 Variation of the OCP of mild steel with time of immersion with different concentrations (1.0 and 50 ppm) of polymers 7–9 in 1 M HCl at 60 °C. | ||
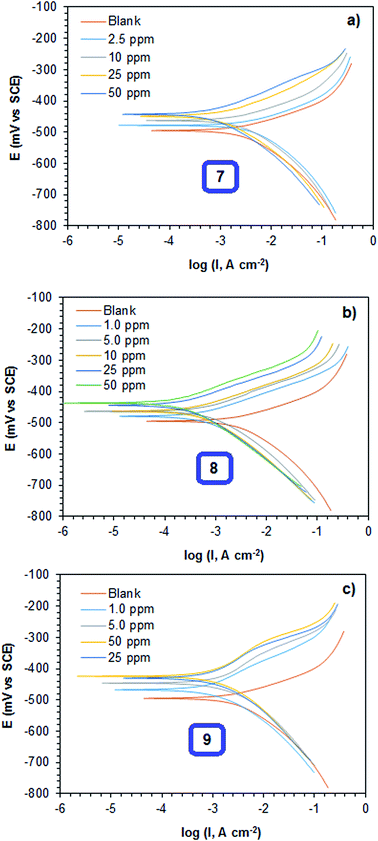 | ||
| Fig. 6 Potentiodynamic polarization curves for mild steel inhibited with different concentrations of (a) 7, (b) 8 and (c) 9 at 60 °C in 1 M HCl. | ||
| Sample | Temp (°C) | ppm (by wt) | Tafel | LPR | |||||
|---|---|---|---|---|---|---|---|---|---|
| Ecorr versus SCE (mV) | βa (mV dec−1) | βc (mV dec−1) | icorr (μA cm−2) | υcorr (mm per year) | η (%)a | θ (%)a | |||
| a Inhibition efficiency, (i.e., η) = surface coverage θ. | |||||||||
| 7 | 60 | 0 | −495 | 73.8 | −169 | 2465 | 28.6 | — | — |
| 1.0 | −486 | 69.3 | −113 | 1484 | 17.2 | 39.8 | 41.2 | ||
| 2.5 | −478 | 57.2 | −114 | 1284 | 14.9 | 47.9 | 49.7 | ||
| 5.0 | −471 | 68.4 | −105 | 1050 | 12.2 | 57.4 | 58.9 | ||
| 10 | −462 | 72.8 | −104 | 749.2 | 8.69 | 69.6 | 69.5 | ||
| 25 | −448 | 88.9 | −116 | 490.7 | 5.69 | 80.1 | 80.5 | ||
| 50 | −442 | 82.1 | −113 | 389.3 | 4.51 | 84.2 | 84.9 | ||
| 8 | 50 | 0 | −483 | 51.2 | −117 | 505 | 5.85 | — | — |
| 1.0 | −476 | 78.3 | −104 | 221 | 2.56 | 56.2 | 56.9 | ||
| 2.5 | −468 | 81.7 | −123 | 179 | 2.08 | 64.5 | 63.3 | ||
| 5.0 | −461 | 74.5 | −125 | 168 | 1.95 | 66.7 | 67.9 | ||
| 10 | −457 | 71.9 | −132 | 136 | 1.58 | 73.1 | 74.2 | ||
| 25 | −453 | 62.8 | −116 | 87.9 | 1.02 | 82.6 | 83.1 | ||
| 60 | 0 | −495 | 73.8 | −169 | 2465 | 28.6 | — | — | |
| 1.0 | −479 | 104 | −119 | 951 | 11.0 | 61.4 | 61.0 | ||
| 2.5 | −471 | 118 | −152 | 781 | 9.06 | 68.3 | 68.9 | ||
| 5.0 | −463 | 126 | −146 | 621 | 7.20 | 74.8 | 75.2 | ||
| 10 | −452 | 107 | −161 | 473 | 5.49 | 80.8 | 81.4 | ||
| 25 | −444 | 113 | −134 | 108 | 1.25 | 95.6 | 95.5 | ||
| 50 | −436 | 89.9 | −119 | 29.6 | 0.43 | 98.8 | 99.1 | ||
| 100 | −431 | 82.6 | −123 | 17.2 | 0.20 | 99.3 | 99.2 | ||
| 70 | 0 | −498 | 60.9 | −102 | 4508 | 52.3 | — | — | |
| 1.0 | −489 | 78.2 | −112 | 2110 | 24.5 | 53.2 | 53.5 | ||
| 2.5 | −481 | 82.9 | −102 | 1812 | 21.0 | 59.8 | 60.1 | ||
| 5.0 | −474 | 79.8 | −118 | 1614 | 18.7 | 64.2 | 64.6 | ||
| 10 | −465 | 89.5 | −126 | 1348 | 15.6 | 70.1 | 69.8 | ||
| 25 | −454 | 69.7 | −104 | 897.1 | 10.4 | 80.1 | 80.2 | ||
| 9 | 60 | 0 | −495 | 73.8 | −169 | 2465 | 28.6 | — | — |
| 1.0 | −467 | 103 | −102 | 1674 | 19.4 | 32.1 | 32.8 | ||
| 2.5 | −454 | 94.3 | −97.4 | 1366 | 15.8 | 44.6 | 44.5 | ||
| 5.0 | −446 | 102 | −114 | 1154 | 13.4 | 53.2 | 53.1 | ||
| 10 | −441 | 98.2 | −111 | 889.9 | 10.3 | 63.9 | 64.4 | ||
| 25 | −430 | 67.9 | −105 | 594.1 | 6.89 | 75.9 | 76.6 | ||
| 50 | −424 | 89.1 | −107 | 470.8 | 5.46 | 80.9 | 81.3 | ||
The corrosion inhibition efficiencies obtained from the Tafel and LPR methods are presented in Table 3. The inhibition efficiencies increased with increasing concentration of the polymers. The copolymer of DADMAC and the amino acid residue of cysteine 8 showed excellent inhibition efficiencies. It was extremely pleasing, that the inhibition efficiency of the copolymer was above the expected inhibition efficiency limit of the starting concentration for acid pickling.51 The inhibition efficiency obtained from the Tafel and LPR methods were in good agreement with the inhibition efficiencies calculated using the weight loss method (Table 2). The inhibitor efficiency of copolymer 8 was explored at different temperatures (50–70 °C). The inhibition efficiency of the copolymer was found to be always higher than that of the individual homopolymer at all concentrations and temperatures. It was also found that the inhibition efficiency increased up to 60 °C with increasing concentration of the copolymers. With a further increase in temperature (70 °C), the inhibition efficiency decreased. This could be because of the desorption of adsorbed copolymer, leading to a larger exposure of the metal to the acid solution, resulting in an increase in corrosion rate.52,53
| Sample | Conc. ppm (by wt) | Rs (Ω cm2) | Rp (Ω cm2) | CPEa (μF cm−2) | n | (Ω cm2) | η (%) |
|---|---|---|---|---|---|---|---|
| a Double layer capacitance (Cdl) and coating capacitance (Cc) are usually modelled with a constant phase element (CPE) in modeling an electrochemical phenomenon. | |||||||
| 7 | 0 | 0.373 | 1.963 | 922 | 0.976 | 1.590 | — |
| 1.0 | 0.368 | 3.054 | 497 | 0.912 | 2.686 | 40.8 | |
| 2.5 | 0.354 | 3.453 | 462 | 0.854 | 3.099 | 48.7 | |
| 5.0 | 0.326 | 4.214 | 403 | 0.827 | 3.888 | 59.1 | |
| 10 | 0.329 | 5.393 | 324 | 0.783 | 5.064 | 68.6 | |
| 25 | 0.311 | 8.067 | 276 | 0.760 | 7.756 | 79.5 | |
| 50 | 0.249 | 9.713 | 249 | 0.711 | 9.464 | 83.2 | |
| 8 | 0 | 0.373 | 1.963 | 922 | 0.976 | 1.590 | — |
| 1.0 | 0.423 | 4.479 | 132 | 0.922 | 4.056 | 60.8 | |
| 2.5 | 0.407 | 5.553 | 106 | 0.901 | 5.146 | 69.1 | |
| 5.0 | 0.365 | 7.046 | 79.8 | 0.876 | 6.681 | 76.2 | |
| 10 | 0.351 | 9.385 | 68.1 | 0.843 | 9.034 | 82.4 | |
| 25 | 0.329 | 34.89 | 57.3 | 0.796 | 34.56 | 95.4 | |
| 50 | 0.204 | 227.3 | 29.4 | 0.769 | 227.1 | 99.3 | |
| 9 | 0 | 0.093 | 1.963 | 922 | 0.976 | 1.590 | — |
| 1.0 | 0.467 | 2.823 | 463 | 0.943 | 2.356 | 32.5 | |
| 2.5 | 0.462 | 3.358 | 416 | 0.899 | 2.896 | 45.1 | |
| 5.0 | 0.435 | 3.907 | 401 | 0.861 | 3.472 | 54.2 | |
| 10 | 0.372 | 4.876 | 357 | 0.817 | 4.504 | 64.7 | |
| 25 | 0.325 | 6.762 | 285 | 0.782 | 6.437 | 75.3 | |
| 50 | 0.268 | 9.101 | 105 | 0.769 | 8.833 | 82.0 | |
The Rs value was calculated from the intersection of the fitted semicircle with the real part (Z′) axis at high frequency. However, the Rp values were obtained from the intersection of the semicircle with the Z′ axis at low frequency, by and other resistances such as the charge transfer resistance and diffusion layer resistance at the surface of working electrode also contributed to this value.54 Eqn (4) was used to calculate the net polarization resistance  :
:
 | (4) |
The  value obtained was later used in eqn (3) to calculate the inhibition efficiencies. The non-ideal capacitance and non-ideal frequency response commonly used in the electrochemical circuit, was expressed by the CPE, and is related to the double layer capacitance (Cdl) using eqn (5):
| Cdl = CPE(ω)n−1 | (5) |
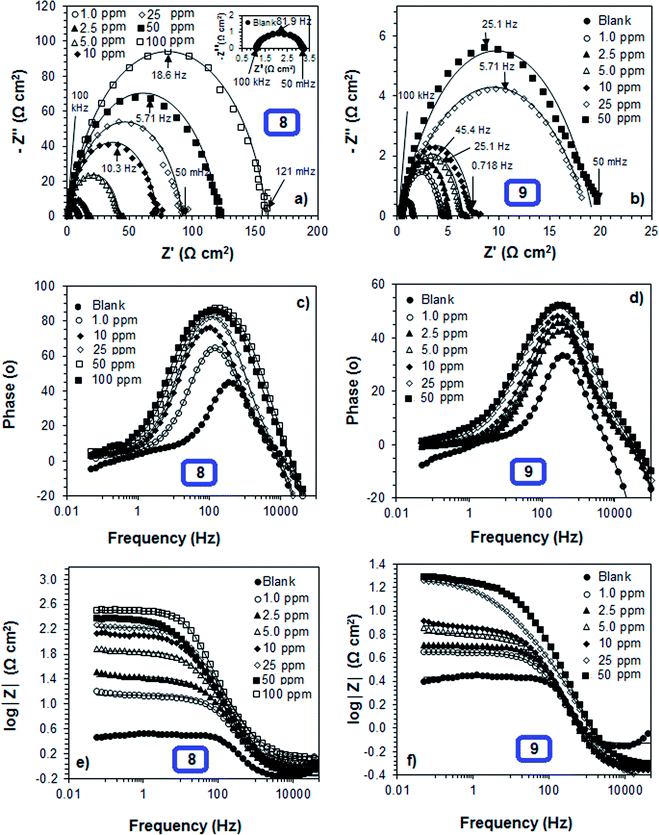
The representative Nyquist and Bode plots of mild steel in the presence or absence of various concentrations of polymer compounds 8 and 9 in 1 M HCl at 60 °C are shown in Fig. 8a–f. The appearance of the single semicircle increases with the increasing concentrations of the polymer compounds, indicating that the acidic dissolution involves a single charge transfer mechanism, and the charge transfer process from mild steel to electrolyte becomes increasingly difficult with the increase in inhibitor concentration. Despite the similar trends of the semicircles observed for the polymer compounds 7–9, all the plots did not confirm perfect semicircles. This deviation from a typical semicircle could be because of the inhomogeneity and roughness of the mild steel surface.55 The single maxima of the Bode phase angle plots (Fig. 8c and d) also supported the single charge transfer mechanism. The phase angle values appeared to be higher than the blank, indicating that the inhibitors adsorbed on the mild steel and electrolyte interfaces have some capacitive characteristics because of the formation of electric double layer.
The normalized EIS results for corrosion of a mild steel obtained from different concentrations of polymers 7–9 in 1 M HCl at 60 °C, and are presented in Table 4. The Nova software (version 1.8) was used to fit the data to obtain the Randles equivalent circuit parameters. The n values were found to be smaller than 1 (Table 4), and decreased with increasing concentration of the polymers, which indicated increased heterogeneity of the mild steel surface. As shown in the results in Table 4, the net polarization resistance increased with increase in the concentration of the polymers indicating the formation of a thin layer film on the mild steel surface. However, CPE values were decreased with increasing polymer concentrations, which might be because of the decrease in local dielectric constant and/or increase in the thickness of the electrical double layer, indicating that the polymer molecules strongly adsorbed onto the metal surface, and eventually lead to an increase in inhibition efficiency.56 The inhibition efficiency values for polymers 7, 8 and 9 at a concentration 50 ppm appeared to be 83.2, 99.3 and 82.0, respectively after 45 min of mild steel immersion at 60 °C. The results obtained from the EIS study were found to have good agreement with the results obtained from the Tafel, LPR, and gravimetric weight loss methods (see previous sections in this paper).
3.3 Adsorption isotherms
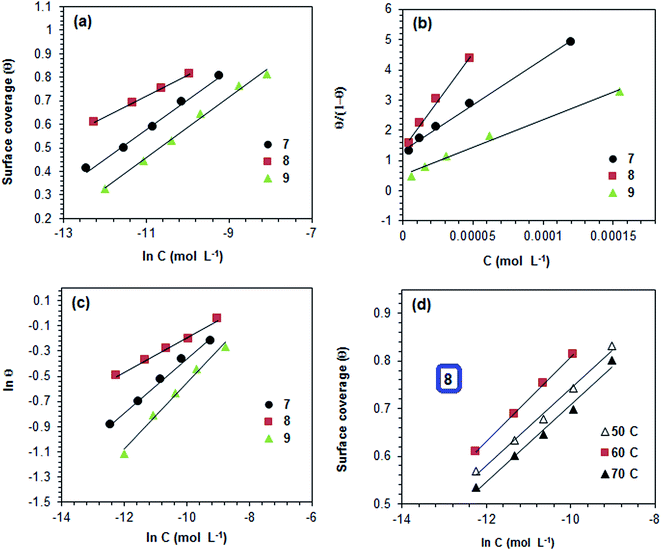
The inhibitive properties of a polymer compound depend on its surface active functionalities, which cause it to adsorb onto the mild steel metal surface. The polymer compounds 7–9 were subjected to gravimetric as well as electrochemical methods to determine the surface coverage (θ), and the data are shown in Tables 2–4. It was noted that fractional inhibition efficiency η and surface coverage θ were usually found to be linear at lower concentrations of an inhibitor molecule. However, the values deviated at higher concentrations, which could be attributed to the change from monolayer surface coverage to a multilayer surface. The inhibition efficiency values obtained using LPR (Table 3) and the corresponding concentrations C were used to fit the commonly used adsorption isotherms (i.e., Freundlich, Langmuir, Frumkin and Temkin isotherms) described elsewhere in the literature.57 The representative adsorption isotherms obtained using the linear least square method are presented in Fig. 9a–d.The synthesized polymer compounds 7–9 were tested for different adsorption isotherms, and the constant values obtained from different adsorption isotherms and their square correlation coefficients (R2) are presented in Table 5. The synthesized polymer molecules 7–9 demonstrated higher R2 values and were found to be the best fit for the Temkin and Freundlich adsorption isotherms, which implied physisorption through an electrostatic interaction between the surface of mild steel and solution interface in which the polymer molecules also contributed to the adsorption process. The higher R2 values of the straight lines also obtained by using the Langmuir isotherm model, indicated the adsorption of inhibition was achieved predominantly by chemisorption.
| Sample | Temp (°C) | Temkina (R2, f) | Langmuirb (R2) | Frumkinc (R2, a) | Freundlichd (R2, n) |
|---|---|---|---|---|---|
| a Temkin: KadsC = efθb Langmuir: θ/(1 − θ) = KadsCc Frumkin: KadsC = {θ/(1 − θ)}e−2aθd Freundlich: θ = KadsCn | |||||
| 7 | 60 | 0.9934, 8.0 | 0.9921 | 0.9507, −0.1 | 0.9948, 0.2 |
| 8 | 50 | 0.9917, 12 | 0.9952 | 0.9573, −0.1 | 0.9986, 0.1 |
| 60 | 0.999, 11 | 0.9912 | 0.9948, −0.1 | 0.9941, 0.1 | |
| 70 | 0.9905, 12 | 0.9949 | 0.9418, −0.1 | 0.9953, 0.1 | |
| 9 | 60 | 0.9981, 7.3 | 0.9890 | 0.9837, −1.5 | 0.9888, 0.3 |
Using eqn (6) and (7), the thermodynamic parameters (adsorption equilibrium constant (Kads), free energy  enthalpy
  and entropy of adsorption
  ) were calculated to further understand the adsorption mechanism:
 | (6) |
| ΔG0 = ΔH0 − TΔS0. | (7) |
The obtained thermodynamic parameters are presented in Table 6.
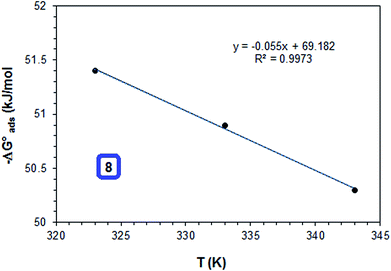
The results in Fig. 10 show that the  and
and  were negative, which suggested that the adsorption process was spontaneous and exothermic. Depending on the magnitude of
  and
and  the mechanism of adsorption can be categorized as physisorption, chemisorption or a mixed mechanism.58–61
As shown in Table 6, the  values for the polymer compounds 7–9 were found to be in the range −38.5 and −51.4 kJ mol−1, and the
  value for polymer compound 8 was found to be −69.2 kJ mol−1. These similar values suggest that the adsorption process for the polymer compounds occurred through a mixed mechanism with predominantly chemisorption. The synthesized polymer compounds with π and non-bonded electrons, were capable of following electrostatic and chemical interaction with the anodic sites by overlapping with the low lying vacant d-orbitals of iron.62,63 Upon adsorption of polymer compound 8 onto the mild steel surface, the calculated
  value was found to be 55 J mol−1 K−1 (Fig. 10, Table 6). This finding suggested that the polymer compound was adsorbed onto the metal surface and displaced the adsorbed water molecules from the surface of the mild steel, and increased the randomness on the solid surface/inhibitor interface.
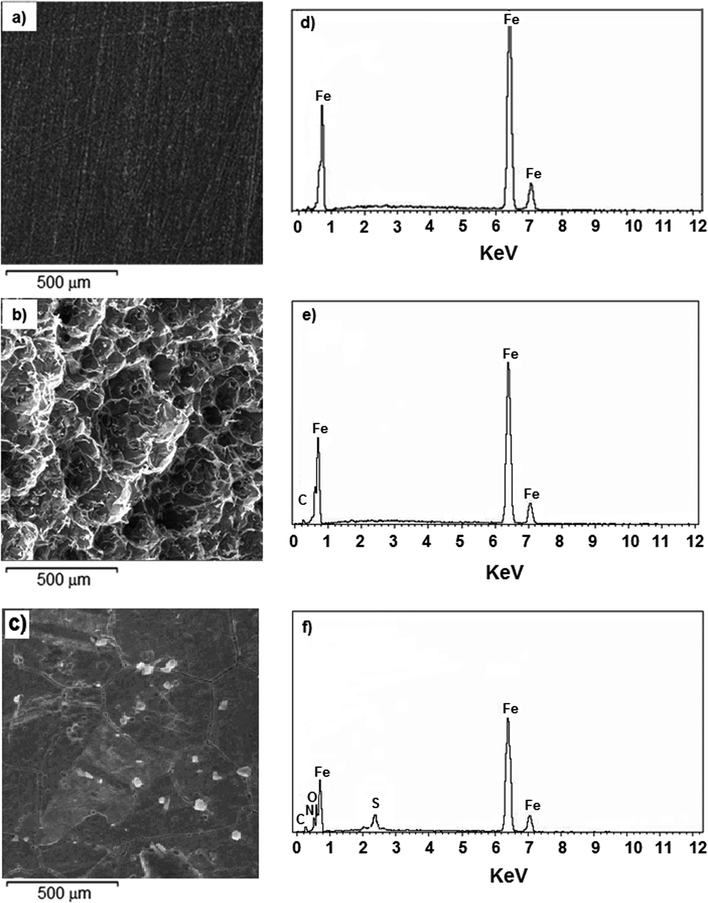
3.4 Surface characterization
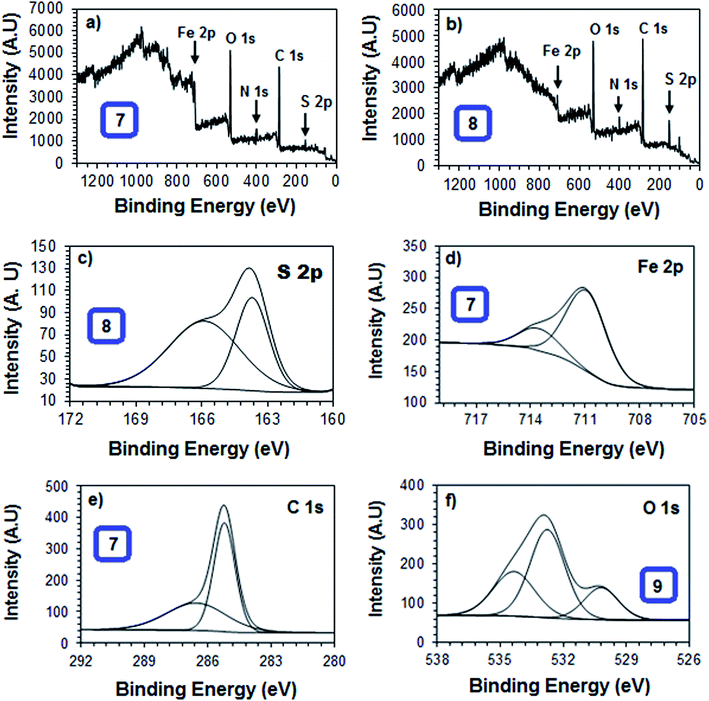
The gravimetric weight loss and various electrochemical methods indicated that the synthesized polymer compounds were able to form a thin film on the mild steel metal surface and this resisted corrosion attack. To better visualize and realize the film forming ability and surface morphologies of the polymeric materials studied, the surface of the mild steel in the presence and absence of the synthesized polymer compounds were explored using AFM, EDX, SEM and XPS.![[double bond, length as m-dash]](https://www.rsc.org/images/entities/char_e001.gif) O at 530.2 and 532.0 eV, respectively, were attributed to the characteristic peak of oxygen indicating the formation of a thin film as a result of partial oxidation, and deposition of the polymer compound onto the metal surface (Fig. 13f).67,68 These individual signals proved that polymer compound 8 formed a thin layer film which covered the mild steel metal surface.
O at 530.2 and 532.0 eV, respectively, were attributed to the characteristic peak of oxygen indicating the formation of a thin film as a result of partial oxidation, and deposition of the polymer compound onto the metal surface (Fig. 13f).67,68 These individual signals proved that polymer compound 8 formed a thin layer film which covered the mild steel metal surface.
| Peak | Approximate binding energy (eV) | Composition (atom%) | ||
|---|---|---|---|---|
| 7 | 8 | 9 | ||
| C 1s | 285.3 | 34.9 | 30.8 | 24.7 |
| C 1s | 286.7 | 24.8 | 32.7 | 37.9 |
| O1s | 530.3 | 3.95 | 10.5 | 5.71 |
| O 1s | 532.8 | 27.1 | 16.0 | |
| O 1s | 533.1 | 19.4 | 9.54 | |
| N 1s | 400.9 | 5.13 | 4.06 | 3.23 |
| Fe 2p | 707.3 | 0.19 | ||
| Fe 2p | 710.6 | 2.15 | 1.89 | 1.42 |
| Fe 2p | 713.9 | 0.69 | 0.41 | 0.78 |
| Cl 2p | 198.5 | 1.35 | 0.76 | |
4. Conclusions
Butler's cyclopolymerization of diallylammonium salts was used to synthesize homo and copolymers 7–9 based on DADMAC and the amino acid residue of cysteine, in excellent yields. The TGA results suggested that the synthesized polymers were stable up to 200 °C. The results of an inhibition efficiency study conducted using a gravimetric method, potentiodynamic polarization, and EIS suggested that the synthesized copolymers containing unquenched nitrogen and sulfur valences performed excellently in 1 M HCl in mitigating mild steel corrosion. The inhibition efficiency increases with increasing concentration of the polymers. The inhibiting performance of copolymer is found to be better than that of the homopolymers. The EIS measurements showed that the net polarization increases and the CPE values were decreased with increasing concentrations of the polymers, indicating that the polymer molecules were adsorbed onto the metal surface. The Temkin, Langmuir and Freundlich adsorption isotherm models and the results of different surface morphology studies obtained using AFM, SEM and XPS suggested that the inhibition process mainly occurred through an adsorption process. This systematic study might provide a way to design a new corrosion inhibitor that could lead to a better understanding of different techniques for the evaluation of corrosion, of corrosion inhibitors and be beneficial for biomedical as well as oil and gas industries.Conflicts of interest
There are no conflicts to declare.Acknowledgements
The author gratefully acknowledge the research facilities provided by King Fahd University of Petroleum and Minerals (KFUPM) and the financial assistance of Saudi Aramco, EXPEC Advanced Research Center, Dhahran, Saudi Arabia through project # (CHEM 2414) and CRPO # 6510847776.References
- C. Volkan, Corrosion Chemistry, John Wiley & sons, New Jersey, 2011 Search PubMed
.
- C. Volkan and B. J. Al-Numan, Corros. Chem., 2012, vol. 68, pp. 84–86 Search PubMed
.
- R. W. Revie and H. H. Uhlig, Corrosion and Corrosion Control, John Wiley & Sons, New Jersey, 2008 Search PubMed
.
- A. Singh, I. Ahamad, D. K. Yadav, V. K. Singh and M. A. Quraishi, Chem. Eng. Commun., 2012, 199, 63–77 CrossRef CAS
.
- W. Durnie, B. Kinsella, R. De Marco and A. Jefferson, J. Electrochem. Soc., 1999, 146, 1751–1756 CrossRef CAS
.
- F. Bentiss, M. Lagrenee and M. Traisnel, Corros. Sci., 2000, 56, 733–742 CrossRef CAS
.
- J. Mosa, N. C. Rosero-Navarro and M. Aparicio, RSC Adv., 2016, 6, 39577–39586 RSC
.
- K. R. Ansari, M. A. Quraishi and A. Singh, Corros. Sci., 2015, 95, 62–70 CrossRef CAS
.
- S. A. Odoemelam and N. O. Eddy, J. Surf. Sci. Technol., 2008, 24, 65–78 CAS
.
- M. Finšgar and J. Jackson, Corros. Sci., 2014, 86, 17–41 CrossRef
.
- G. Gece, Corros. Sci., 2011, 53, 3873–3898 CrossRef CAS
.
- K. R. Ansari, M. A. Quraishi and A. Singh, Corros. Sci., 2014, 79, 5–15 CrossRef CAS
.
- M. Bethencourt, F. J. Botana, J. J. Calvino, M. Marcos and M. A. Rodriguez-Chacon, Corros. Sci., 1998, 40, 1803–1819 CrossRef CAS
.
- B. R. W. Hinton, J. Alloys Compd., 1992, 180, 15–25 CrossRef CAS
.
- S. N. Tiwari and S. Prakash, J. Mater. Sci. Technol., 1998, 14, 467–472 CrossRef CAS
.
- W. Revie and H. H. Uhlig, Corrosion and Corrosion Control: An Introduction to Corrosion Science and Engineering, Wiley-Inter science, NY, USA, 2008 Search PubMed
.
- Y. Tang, X. Yang, W. Yang, Y. Chen and R. Wan, Corros. Sci., 2010, 52, 242–249 CrossRef CAS
.
- A. A. F. Sabirneeza, R. Geethanjali and S. Subhashini, Chem. Eng. Commun., 2015, 202, 232–244 CrossRef
.
- S. H. Zaferani, M. Sharifi, D. Zaarei and M. R. Shishesaz, J. Environ. Chem. Eng., 2013, 1, 652–657 CrossRef
.
- R. Rajalakshmi, A. Prithiba and S. Leelavathi, J. Chem. Acta, 2012, 1, 6–13 Search PubMed
.
- Sustainable Catalysis: Challenges and Practices for the Pharmaceutical and Fine Chemical Industries, ed. P. J. Dunn, K. K. Hii, M. J. Krische and M. T. Williams, Wiley, Weinheim, 2013 Search PubMed
.
- R. A. Sheldon, Green Chem., 2014, 16, 950–963 RSC
.
- C. Verma, L. O. Olasunkanmi, E. E. Ebenso, M. A. Quraishi and I. B. Obot, J. Phys. Chem. C, 2016, 120, 11598–11611 CrossRef CAS
.
- H. Zhao, X. Zhang, L. Ji, H. Hud and Q. Li, Corros. Sci., 2014, 83, 261–271 CrossRef CAS
.
- B. A. Abd-El-Nabey, N. Khalil and A. Mohamed, Surf. Technol., 1985, 24, 383–389 CrossRef CAS
.
- H. Ashassi-Sorkhabia, M. R. Majidib and K. Seyyedi, Appl. Surf. Sci., 2004, 225, 176–185 CrossRef
.
- M. A. Amin, K. F. Khaled, Q. Mohsen and H. A. Arida, Corros. Sci., 2010, 52, 1684–1695 CrossRef CAS
.
- K. Barouni, L. Bazzi, R. Salghi, M. Mihit, B. Hammouti, A. Albourine and S. El-Issami, Mater. Lett., 2008, 262, 3325–3327 CrossRef
.
- M. S. S. Morad, A. E. H. A. Hermas and M. S. A. Aal, J. Chem. Technol. Biotechnol., 2002, 77, 486–494 CrossRef CAS
.
- K. M. Ismail, Electrochim. Acta, 2007, 52, 7811–7819 CrossRef CAS
.
- M. S. El-Deab, Mater. Chem. Phys., 2011, 129, 223–227 CrossRef CAS
.
- H. Saifi, M. C. Bernard, S. Joiret, K. Rahmouni, H. Takenouti and B. Talhi, Mater. Chem. Phys., 2010, 120, 661–669 CrossRef CAS
.
- N. H. Helal and W. A. Badawy, Electrochim. Acta, 2011, 56, 6581–6587 CrossRef CAS
.
- M. Mobin, S. Zehra and M. Parveen, J. Mol. Liq., 2016, 216, 598–607 CrossRef CAS
.
- G. Markevicius, S. Chaudhuri, C. Bajracharya, R. Rastogi, J. Xiao, C. Burnett and T. Q. Chastek, Prog. Org. Coat., 2012, 75, 319–−327 CrossRef CAS
.
- S. Kumar, H. Vashisht, L. O. Olasunkanmi, I. Bahadur, H. Verma, M. Goyal, G. Singh and E. E. Ebenso, Ind. Eng. Chem. Res., 2017, 56, 441–−456 CrossRef CAS
.
- R. Baskar, M. Gopiraman, D. Kesavan, K. Subramanian and S. Gopalakrishnan, J. Mater. Eng. Perform., 2015, 24, 2847–−2856 CrossRef CAS
.
- Y. Jianguo, W. Lin, V. Otieno-Alego and D. P. Schweinsberg, Corros. Sci., 1995, 37, 975–985 CrossRef CAS
.
- S. Prakash, C. R. K. Rao and M. Vijayan, Electrochim. Acta, 2008, 53, 5704–−5710 CrossRef CAS
.
- G. B. Butler, Cyclopolymerization and cyclocopolymerization, Marcel Dekker, NY, USA, 1992 Search PubMed
.
- P. K. Singh, V. K. Singh and M. Singh, E Polymer, 2007, 30, 1–34 Search PubMed
.
- H. A. Al-Muallem, M. A. J. Mazumder, M. K. Estaitie and S. A. Ali, Iran. Polym. J., 2015, 24, 541–547 CrossRef CAS
.
- W. Jaeger, J. Bohrisch and A. Laschewsky, Prog. Polym. Sci., 2010, 35, 511–577 CrossRef CAS
.
- S. A. Ali, S. A. Haladu and A. M. Z. El-Sharif, J. Polym. Res., 2016, 23, 167–176 CrossRef
.
- S. A. Ali and O. C. S. Al-Hamouz, Polymer, 2012, 53, 3368–3377 CrossRef CAS
.
- A. V. Raghu, G. S. Gadaginamath, N. Mathew, S. B. Halligudi and T. M. Aminabhavi, J. Appl. Polym. Sci., 2007, 106, 299–308 CrossRef CAS
.
- A. V. Raghu, G. Anita, Y. M. Barigaddi, G. S. Gadaginamath and T. M. Aminabhavi, J. Appl. Polym. Sci., 2007, 104, 81–88 CrossRef CAS
.
- D. P. Suhas, H. M. Jeong, T. M. Aminabhavi and A. V. Raghu, Polym. Eng. Sci., 2014, 54, 24–32 CrossRef CAS
.
- S. Kudaibergenov, W. Jaeger and A. Laschewsky, Adv. Polym. Sci., 2006, 201, 157–224 CrossRef CAS
.
- S. Z. Duan and Y. L. Tao, Interface Chemistry, Higher Education Press, Beijing, 1990 Search PubMed
.
- H. Keleş, M. Keleş, I. Dehri and O. Serindağ, Colloids Surf., A, 2008, 320, 138–145 CrossRef
.
- G. N. Devi, J. Saranya, N. Manjubaashini, T. D. Thangadurai, S. M. Roopan and S. Chitra, Prog. Org. Coat., 2017, 109, 117–125 CrossRef CAS
.
- H. Zarrok, H. Oudda, A. Zarrouk, R. Salghi, B. Hammounti and M. Bouachrine, Der Pharma Chemica., 2011, 3, 576–590 CAS
.
- W. J. Lorenz and F. Mansfeld, Corros. Sci., 1981, 21, 647–672 CrossRef CAS
.
- J. Aljourani, K. Raeissi and M. A. Golozar, Corros. Sci., 2009, 51, 1836–1843 CrossRef CAS
.
- K. F. Khaled and N. Hackerman, Mater. Chem. Phys., 2003, 82, 949–960 CrossRef CAS
.
- M. A. J. Mazumder, M. K. Nazal, M. M. Faiz and S. A. Ali, RSC Adv., 2016, 6, 12348–12362 RSC
.
- R. M. El-Sherif and W. A. Badawy, Int. J. Electrochem. Sci., 2011, 6, 6469–6482 CAS
.
- C. Verma, P. Singh and M. A. Quraishi, J. Assoc. Arab Univ. Basic Appl. Sci., 2016, 21, 24–30 Search PubMed
.
- T. Arsian, F. Kandemirli, E. E. Ebenso, L. Love and H. Alemu, Corros. Sci., 2009, 5, 35–47 CrossRef
.
- L. Larabi, Y. Harek, M. Traisnel and A. Mansri, J. Appl. Electrochem., 2014, 34, 833–839 CrossRef
.
- I. L. Rozenfeld, Corrosion Inhibitors, MacGraw-Hill, New York, 1981 Search PubMed
.
- L. Afia, R. Salghi, L. Bammou, E. Bazzi, B. Hammouti, L. Bazzi and A. Bouyanzer, J. Saudi Chem. Soc., 2014, 18, 19–25 CrossRef CAS
.
- G. W. Nelson, M. Perry, S. M. He, D. L. Zechel and J. H. Horton, Colloids Surf., B, 2010, 78, 61–68 CrossRef CAS PubMed
.
- H. B. Yao, Y. Li and A. T. S. Wee, Appl. Surf. Sci., 2000, 158, 112–119 CrossRef CAS
.
- N. Wu, L. Fu, M. Su, M. Aslam, K. C. Wong and V. P. Dravid, Nano Lett., 2004, 4, 383–386 CrossRef CAS
.
- O. Olivares-Xometl, N. V. Likhanova, M. A. Domínguez-Aguilar, J. M. Hallen, L. S. Zamudio and E. Arce, Appl. Surf. Sci., 2006, 252, 2139–2152 CrossRef CAS
.
- M. Tourabi, K. Nohair, M. Traisnel, C. Jama and F. Bentiss, Corros. Sci., 2013, 75, 123–133 CrossRef CAS
.
Footnote |
| † Electronic supplementary information (ESI) available. See DOI: 10.1039/c8ra09833f |
| This journal is © The Royal Society of Chemistry 2019 |

