 Open Access Article
Enhanced gas selectivity induced by surface active oxygen in SnO/SnO2 heterojunction structures at different temperatures†
Guilin Yinab,
Jianwu Suna,
Fang Zhangb,
Weiwei Yuc,
Fang Pengc,
Yan Sunc,
Xin Chenc,
Lei Xua,
Jing Lu b,
Chao Luob,
Meiying Ge*b and
Dannong He*ab
aSchool of Material Science and Engineering, Shanghai Jiao Tong University, No. 800 Dongchuan Road, Shanghai 200240, PR China. E-mail: hdn_nercn@163.com
bNational Engineering Research Center for Nanotechnology, No. 28 East Jiang Chuan Road, Shanghai 200241, PR China. E-mail: meiyingge@163.com
cNational Laboratory for Infrared Physics, Shanghai Institute of Technical Physics, Chinese Academy of Sciences, No. 500 Yutian Road, Shanghai 200083, PR China
First published on 15th January 2019
Abstract
The development of heterojunction structures has been considered as an important step for sensing materials. In this report, 3D hierarchical SnO–SnO2 heterojunction structures were synthesized and developed via simple one-pot hydrothermal synthesis without any extra processes. The prepared 3D samples exhibit high sensitivity, benefiting from the synergistic effects of SnO and SnO2. Interestingly, SnO–SnO2 hybrid structures exhibited distinctly different sensitivities at 180 and 280 °C, and the sensitivity can achieve values of 47.69 and 41.56 toward ethanol and acetone, respectively, at concentrations of 100 ppm. A mechanistic analysis of the sensitivity and concentration-dependence revealed that the oxygen species on the surface were O− and O2− at different temperatures. Therefore, the temperature selectivity of the sample may be due to the different activities of the active oxygen species. Moreover, the composition also shows excellent stability at operating temperatures. The high sensing sensitivity and selectivity is promising for practical VOC gas detection; this also offers a new perspective for the design of multifunctional sensing materials.
Introduction
Reliable sensors capable of detecting volatile organic compound (VOC) vapors have attained considerable attention because they can be used in the detection of toxic gases and air pollution, and the diagnosis of diseases.1–4 In particular, acetone is a typical biomarker in human exhaled breath indicating diabetes. Thus, a detector can be developed to diagnose diabetes by detecting acetone.5 However, human exhaled breath sometimes contains ethanol, which reacts with sensing materials, resulting in difficulties in sensitively and selectively detecting acetone. The most commonly used techniques for detection include gas chromatography, mass spectrometry, and ion mobility spectrometry, but all of these methods are expensive and time-consuming.6Among the available techniques for analyzing VOCs, semiconductor metal oxide gas sensors provide high sensitivity sensing properties with low cost and no toxicity, however their poor selectivity has become a bottleneck.7 Selectivity has become a key factor for semiconductor gas sensors. However, there are still limitations involved in improving selectivity significantly. Traditionally, selectivity has been improved using various nanostructures and/or composites consisting of two metal oxides to form heterojunction structures.5,8–12 These heterojunction structures, such as NiO/ZnO,13 CuO/ZnO,14 NiO/SnO2 (ref. 15) and α-Fe2O3/NiO,16 can largely overcome the shortcomings of selectivity, because they provide synergistic effects between the two components. Despite many satisfying results regarding the sensing properties of heterojunction structures having been obtained, the selective detection of ethanol and acetone vapor still attracts wide-spread scientific and technological interest. If the best sensing temperatures of a material are different, a single sensor could be designed to detect two kinds of target gas at the same time through the use of a thermostatic cycle (as shown in Scheme 1).
SnO2, as a typical n-type semiconductor, has attracted considerable attention as a sensing material, because of its excellent sensing properties and good chemical stability.17–20 Recently, doping SnO2 with p-type materials like Cu2O,21 α-Fe2O3 (ref. 22), In2O3 (ref. 23) and CeO2 (ref. 24) has been extensively investigated for improving selectivity, as this will introduce defects and alter the charge density. However, very few studies have focused on the selective detection of ethanol and acetone by using differences in the activities of the active oxygen species of one material at different operating temperatures.
In this work, we demonstrate a facile and environmentally-friendly method for the synthesis of SnO/SnO2 heterojunction structures with high specific surface area and good thermal stability. Noticeably, during the synthesis process, the ligand not only acts in a shape controlling role, but it also can act as the functional capping reagent to achieve the SnO/SnO2 double-phase through controlling the formation and growth of SnO nucleation. The developed SnO/SnO2 nanocrystal sensors exhibit distinctly different sensitivities toward ethanol and acetone at 180 and 280 °C, respectively. A mechanistic analysis of the sensing properties shows that the temperature selectivity may be due to the different activities of surface adsorbed oxygen species. The present study shows that the designed SnO/SnO2 nanostructures are favorable for VOC detection with improved sensing performance.
Experimental
Chemicals
All chemicals (AR grade) used in experiments were purchased from Shanghai Chemical Co. and were used directly without further purification.Synthesis of SnO/SnO2 hybrid structures
The SnO/SnO2 hybrid structures were prepared using a facile hydrothermal method. In a typical procedure, hexamethylenetetramine (HMTA) and SnC2O4 were dissolved in distilled water under magnetic stirring for 2 h. The concentrations of SnC2O4 and HMTA were 0.005 M. Then the mixed solution was immediately transferred into a 200 mL beaker sealed with preservative film and this was heated at 95 °C for 3 h. Then, the solution was cooled down to room temperature naturally. The precipitate was centrifuged and washed with distilled water and ethanol several times, and finally dried at 60 °C; this sample was named S4 (or the “as-prepared sample”). For comparison, parallel experiments were carried out with molar ratios of HMTA![[thin space (1/6-em)]](https://www.rsc.org/images/entities/char_2009.gif) :
:![[thin space (1/6-em)]](https://www.rsc.org/images/entities/char_2009.gif) SnC2O4 of 0
SnC2O4 of 0![[thin space (1/6-em)]](https://www.rsc.org/images/entities/char_2009.gif) :
:![[thin space (1/6-em)]](https://www.rsc.org/images/entities/char_2009.gif) 1, 1
1, 1![[thin space (1/6-em)]](https://www.rsc.org/images/entities/char_2009.gif) :
:![[thin space (1/6-em)]](https://www.rsc.org/images/entities/char_2009.gif) 4, 1
4, 1![[thin space (1/6-em)]](https://www.rsc.org/images/entities/char_2009.gif) :
:![[thin space (1/6-em)]](https://www.rsc.org/images/entities/char_2009.gif) 2, 2
2, 2![[thin space (1/6-em)]](https://www.rsc.org/images/entities/char_2009.gif) :
:![[thin space (1/6-em)]](https://www.rsc.org/images/entities/char_2009.gif) 1 and 4
1 and 4![[thin space (1/6-em)]](https://www.rsc.org/images/entities/char_2009.gif) :
:![[thin space (1/6-em)]](https://www.rsc.org/images/entities/char_2009.gif) 1 through changing the content of HMTA; these samples were named S1, S2, S3, S5 and S6 respectively.
1 through changing the content of HMTA; these samples were named S1, S2, S3, S5 and S6 respectively.
Characterization
The morphologies and structures of the as-prepared samples were characterized using field-emission scanning electron microscopy (SEM, Hitachi S-4800) and transmission electron microscopy (TEM, JEM-2100F JEOL electron microscope). Powder X-ray diffraction (XRD) and in situ X-ray diffraction analyses were carried out using D/max-2600PC apparatus with Cu Kα radiation. The specific surface areas of the as-prepared samples were measured using a Quantachrome Autosorb AS-1 instrument.Characterization of gas-sensing measurements
Typically, a proper amount of synthesized product was mixed with several drops of ethanol in an agate mortar to form a homogeneous paste, which was coated onto the outer surface of a ceramic tube with a pair of Au electrodes and four Pt wires at both ends of the tube. Then a Ni–Cr alloy coil (10 Ω) was inserted into the tube as a heater to tune the operating temperature. Gas sensing tests were performed using a commercial HW-30A gas sensing measurement system (Hanwei Electronics Co. Ltd., Henan, PR China), which is a static system using atmospheric air as the interference gas. Before testing, sensors were aged at the working temperature for several days in order to improve their repeatability and stability. The sensor sensitivity (S) was defined as Ra/Rg, where Ra and Rg were the electrical resistance values of the sensor in air and in the target gas, respectively.Results and discussion
Structural and morphology characterization
Fig. 1a–c shows the morphological features of samples prepared via hydrothermal synthesis in aqueous solution at a HMTA![[thin space (1/6-em)]](https://www.rsc.org/images/entities/char_2009.gif) :
:![[thin space (1/6-em)]](https://www.rsc.org/images/entities/char_2009.gif) Sn2+ molar ratio of 1
Sn2+ molar ratio of 1![[thin space (1/6-em)]](https://www.rsc.org/images/entities/char_2009.gif) :
:![[thin space (1/6-em)]](https://www.rsc.org/images/entities/char_2009.gif) 1 at 95 °C for 3 h. Fig. 1a and b display typical SEM images at different magnifications, which show that the entire structure is composed of numerous thin, smooth and curved nanosheets that are 100 nm in diameter and ∼3 nm in thickness, and the nanosheets are connected to each other to form 3D hierarchical solid microspheres. This structure was also confirmed from the TEM image shown in Fig. 1c. A high resolution transmission electron microscopy (HRTEM) image of the sample (Fig. 1d) reveals the presence of nonporous polycrystalline grains with an average size about 2–5 nm within the nanosheets. Fig. 1e and f exhibit the detailed morphology of a single nanoparticle. The resolved fringes observed from the HRTEM images in Fig. 1d and e indicate that the lattice spacing of 0.312 nm corresponds to the (101) plane of SnO and those of 0.256 and 0.232 nm correspond to the (101) and (111) planes of SnO2, respectively17.
1 at 95 °C for 3 h. Fig. 1a and b display typical SEM images at different magnifications, which show that the entire structure is composed of numerous thin, smooth and curved nanosheets that are 100 nm in diameter and ∼3 nm in thickness, and the nanosheets are connected to each other to form 3D hierarchical solid microspheres. This structure was also confirmed from the TEM image shown in Fig. 1c. A high resolution transmission electron microscopy (HRTEM) image of the sample (Fig. 1d) reveals the presence of nonporous polycrystalline grains with an average size about 2–5 nm within the nanosheets. Fig. 1e and f exhibit the detailed morphology of a single nanoparticle. The resolved fringes observed from the HRTEM images in Fig. 1d and e indicate that the lattice spacing of 0.312 nm corresponds to the (101) plane of SnO and those of 0.256 and 0.232 nm correspond to the (101) and (111) planes of SnO2, respectively17.
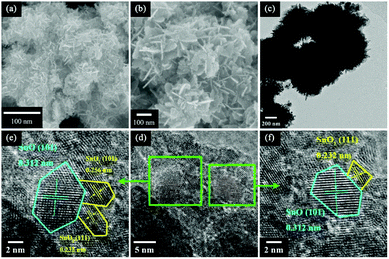 | ||
Fig. 1 (a) A low-magnification SEM image; (b) a high-magnification SEM image; (c) a TEM image; and (d-f) HRTEM images of a sample with a HMTA/SnC2O4 molar ratio of 1![[thin space (1/6-em)]](https://www.rsc.org/images/entities/char_2009.gif) : :![[thin space (1/6-em)]](https://www.rsc.org/images/entities/char_2009.gif) 1. 1. | ||
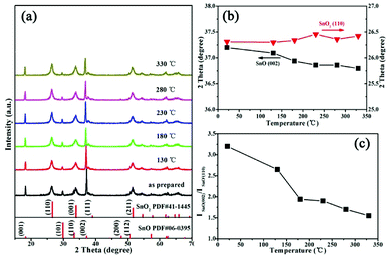
Furthermore, the phase structures were analyzed via XRD, as shown in Fig. 2, for the as-prepared sample. The peaks can be indexed to tetragonal SnO (JCPDS #06-0395) and SnO2 (JCPDS #41-1445) phases; this indicates that SnO and SnO2 are present simultaneously, and that intergrowth mechanisms may occur under HMTA conditions. In situ X-ray diffraction studies were carried out to further characterize the phase stability at high temperature. The results show that the sample retains the same XRD patterns as the as-prepared state at different temperatures, which indicates that the crystalline structure is unchanged after the heat treatment process. The positions of the peaks are shifted towards higher and lower 2θ values as the temperature increases, which shows that the interlayer spacing d_(002) of SnO increases and d_(110) of SnO2 decreases. Through analyzing the crystal structure and crystal quality, we found that SnO/SnO2 is thermo-stable. As shown in Fig. 2c, the intensity ratio of I(002) in SnO to I(110) in SnO2 decreases as the temperature increases, which reveals that the weight fraction of SnO decreases due to SnO being partially oxidized to SnO2.
XPS measurements were conducted to test the surface condition of SnO/SnO2, as shown in Fig. S1.† The high-resolution spectrum of Sn 3d shows two fitted peaks at 486.9 and 486.5 eV, which correspond to Sn2+ and Sn4+ states, respectively (Fig. S1a†).18 In the case of the O 1s XPS spectrum, as shown in Fig. S1b,† three peaks are observed at 530.7, 531.9 and 533.3 eV, indicating that there are three types of oxygen species in the sample. The two peaks at 530.7 and 531.9 eV correspond to O2− ions in the lattice of SnO2 and O2− ions in oxygen deficient regions.25 The highest energy peak at 533.3 eV corresponds to chemically adsorbed forms of oxygen on the surface of SnO/SnO2.5,25 These results provide insight into the surface properties of SnO/SnO2.
The N2 adsorption–desorption isotherms of SnO/SnO2 samples are shown in Fig. S2.† The results show that nitrogen adsorption isotherms of type IV are found, according to IUPAC classification, which confirms the porous structures of the SnO/SnO2 samples. It is found that the surface area is 49.65 m2 g−1.
In order to study the reaction process, we systematically investigated the effect of the molar ratio of HMTA to SnC2O4 on the structures and morphologies of the resultant products, and the corresponding morphology variations of the products with different molar ratios of HMTA to SnC2O4 are shown in Fig. S3a–e.† It can be seen from Fig. S3a† that nanoparticles are formed with an average diameter of about 50–100 nm without HMTA. At the same time, it can be seen from Fig. S3b and c† that the original particles grow larger and self-assembly nanosheets grow on the original particles upon increasing the ratio of HMTA. However, further increasing the HMTA content leads to 3D hierarchical nanostructures with interconnected multilayers of stacked nanosheets; this may be attributed to a process of heterogeneous nucleation and subsequent oriented crystal growth.
As shown in the XRD image (Fig. S4†), all diffraction peaks of the product without HMTA are assigned to the tetragonal SnO2 (JCPDS #41-1445) phase perfectly, and the diffraction profile can be indexed through the reflections of tetragonal SnO (JCPDS #06-0395) and SnO2 (JCPDS #41-1445) phases upon the addition of HMTA. The intensity ratio of I(002) from SnO to I(110) from SnO2 increases with higher HMTA content, which reveals that a high HMTA concentration in the precursor solution leads to significant phase separation and the weight fraction of SnO increasing in the sample. In addition to this, we know that the diffraction peaks of the sample were strong and sharp with a HMTA![[thin space (1/6-em)]](https://www.rsc.org/images/entities/char_2009.gif) :
:![[thin space (1/6-em)]](https://www.rsc.org/images/entities/char_2009.gif) Sn2+ ratio of 1
Sn2+ ratio of 1![[thin space (1/6-em)]](https://www.rsc.org/images/entities/char_2009.gif) :
:![[thin space (1/6-em)]](https://www.rsc.org/images/entities/char_2009.gif) 1 or 2
1 or 2![[thin space (1/6-em)]](https://www.rsc.org/images/entities/char_2009.gif) :
:![[thin space (1/6-em)]](https://www.rsc.org/images/entities/char_2009.gif) 1, which indicates that the products are highly crystalline. The (002) peak positions of SnO and (110) peak positions of SnO2 are shown in Fig. S4b,† and the (002) diffraction peaks of SnO slightly shift to higher angles and the (110) diffraction peaks of SnO2 move to lower angles. This is because ion doping with different ionic radii may cause the expansion or shrinkage of the lattice, which indicates that SnO/SnO2 can form a composite structure. From the above, we know that the amount of HMTA plays a key role in the shapes, phase changes and crystallinities of samples.
1, which indicates that the products are highly crystalline. The (002) peak positions of SnO and (110) peak positions of SnO2 are shown in Fig. S4b,† and the (002) diffraction peaks of SnO slightly shift to higher angles and the (110) diffraction peaks of SnO2 move to lower angles. This is because ion doping with different ionic radii may cause the expansion or shrinkage of the lattice, which indicates that SnO/SnO2 can form a composite structure. From the above, we know that the amount of HMTA plays a key role in the shapes, phase changes and crystallinities of samples.
On the basis of the above characterization results, a possible formation mechanism for the 3D hierarchically SnO/SnO2 composites is illustrated. In the given HMTA-free hydrolytic route, Sn2+ is converted into SnO2 through thermally reacting with dissolved oxygen. When HMTA is added into the solution, the HMTA molecules break up to release NH3 upon heating.26 The slow-releasing NH3 can be attacked by Sn2+ gradually through coordination interactions,27 which can prevent Sn2+ from being oxidized by dissolved oxygen to form Sn4+, whereas some of the uncovered Sn2+ can be oxidized.2 However, it is impossible to completely block oxidation to obtain SnO in the reaction system, because oxygen strongly binds to nucleation clusters.28 So SnO/SnO2 nucleation clusters were formed with complexes of oxidation by dissolved oxygen and were passivated by NH3. The external conditions may exert tremendous effects on the sizes and morphologies of crystals through participating in the nucleation and growth, with a chemisorbed NH3 layer preventing further oxidation of the SnO surfaces and SnO seeds, and many overall factors may be integrated to dominate the process.
Based on the above-described reaction, clusters grow or integrate together into larger primary nanoparticles, and then become the building blocks through a subsequent process. The morphology change of the samples from nanospheres to interconnected hierarchical nanoflowers should be attributed to a process of heterogeneous nucleation and subsequent oriented crystal growth with co-ligands associated with HMTA in the reaction system.
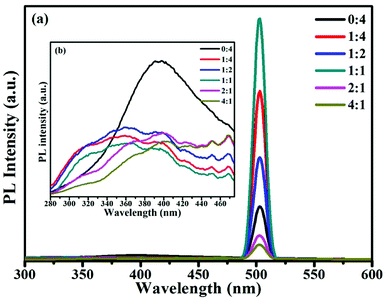
Photoluminescence spectra were used to examine the surface properties, impurity levels and energy bands.5 Fig. 3 shows room temperature PL spectra for samples at an excitation wavelength of 250 nm. The broad emission band found between 280 and 400 nm in the samples, as shown in Fig. 3b, was attributed to free exciton recombination from the conduction band edge to the valence band edge of SnO2.29 The broad band appearing between 280 and 360 nm in samples S2 to S6 may be attributed to the band gap of SnO. The increase in the band gap was due to the effects of the strain of nano-SnO and decreasing the dimensions of SnO has the effect of opening the band gap, which possibly originates from quantum confinement effects and the effects of strain30. The emission band at 502 nm originated from singly charged oxygen vacancies (VO+),31 and the intensity of this emission band increased upon increasing the ratio of SnO in samples; this was probably due to imported oxygen vacancy defects in the SnO/SnO2 composites. As reported, the presence of oxygen vacancy defects can promote adsorption sites for oxidizing gases, and the surface gas sensing reactivity of samples will be enhanced upon increasing the oxygen vacancy concentration.32
Sensing properties towards different VOC gases
The enhanced gas sensing properties of SnO/SnO2 composites are likely due to the following factors. First, SnO–SnO2 heterostructure-based sensors show remarkably improved performance relative to other samples. This is probably because SnO and SnO2 can form an in-built electric field at the SnO/SnO2 interface, which drives electron flow from SnO2 to SnO and leaves holes on the SnO2 surfaces (as shown in Fig. S5†). This process can apparently increase the thicknesses of electron depletion layers, and an enhanced response will be obtained eventually. Second, the sensitivity is largely dependent on the molar ratio of HMTA to SnC2O4 (as shown in Fig. S6†). Sensitivity towards both gases increases when this ratio increases, and the highest gas response is obtained when the molar ratio of HMTA to SnC2O4 is 1![[thin space (1/6-em)]](https://www.rsc.org/images/entities/char_2009.gif) :
:![[thin space (1/6-em)]](https://www.rsc.org/images/entities/char_2009.gif) 1. This is probably due to Sni being easier to form in Sn-rich samples, with an increased ratio of SnO in samples, than in O-rich films with a lower SnO content.33 Furthermore, Sni is expected to induce a huge density of states in the bandgap, leading to high sensitivity. If the SnO content is further increased, the performance will degrade because of a disproportionation reaction. In order to obtain a better response, the suitable molar ratio of HMTA to SnC2O4 is 1
1. This is probably due to Sni being easier to form in Sn-rich samples, with an increased ratio of SnO in samples, than in O-rich films with a lower SnO content.33 Furthermore, Sni is expected to induce a huge density of states in the bandgap, leading to high sensitivity. If the SnO content is further increased, the performance will degrade because of a disproportionation reaction. In order to obtain a better response, the suitable molar ratio of HMTA to SnC2O4 is 1![[thin space (1/6-em)]](https://www.rsc.org/images/entities/char_2009.gif) :
:![[thin space (1/6-em)]](https://www.rsc.org/images/entities/char_2009.gif) 1.
1.
Details of the sensor performance toward different gases at different temperatures are summarized in Fig. 4a. The sensitivity is related to the temperature and the optimum temperatures for SnO/SnO2 sample responses to ethanol and acetone gas are about 180 °C and 280 °C, respectively, at a gas concentration of 100 ppm. Therefore, follow-up tests were carried out at the optimum operating temperatures. As shown in Fig. 4b, the sensor has no significant response to other gases except the target gases at the optimum operating temperatures. Therefore, sensors based on SnO/SnO2 have good temperature selectivity for ethanol and acetone gas.
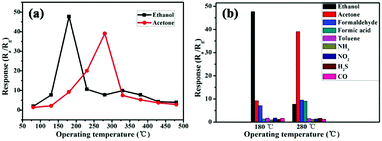 | ||
Fig. 4 (a) The gas response of SnO/SnO2 at a HMTA![[thin space (1/6-em)]](https://www.rsc.org/images/entities/char_2009.gif) : :![[thin space (1/6-em)]](https://www.rsc.org/images/entities/char_2009.gif) SnC2O4 ratio of 1 SnC2O4 ratio of 1![[thin space (1/6-em)]](https://www.rsc.org/images/entities/char_2009.gif) : :![[thin space (1/6-em)]](https://www.rsc.org/images/entities/char_2009.gif) 1 to 100 ppm concentrations of different gases as a function of the operating temperature; and (b) the temperature selectivity. 1 to 100 ppm concentrations of different gases as a function of the operating temperature; and (b) the temperature selectivity. | ||
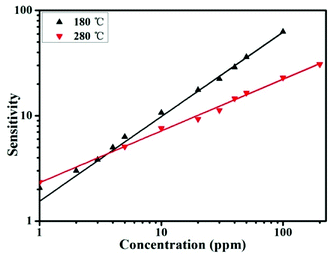
The above exciting results are probably due to the idea that O2 is primarily physically adsorbed on the surfaces of samples where it changes from a molecular to an ionized state, consisting of O2−, O− and O2−. Furthermore, the amount and chemical reactivity of active O ions change on the surfaces of samples at different temperatures. According the response equation:
| S = αCβ | (1) |
From eqn (1) and the definition of S, we can rewrite the relation as:
log![[thin space (1/6-em)]](https://www.rsc.org/images/entities/char_2009.gif) S = log S = log![[thin space (1/6-em)]](https://www.rsc.org/images/entities/char_2009.gif) α + β α + β![[thin space (1/6-em)]](https://www.rsc.org/images/entities/char_2009.gif) log log![[thin space (1/6-em)]](https://www.rsc.org/images/entities/char_2009.gif) C C
| (2) |
It can be seen that log![[thin space (1/6-em)]](https://www.rsc.org/images/entities/char_2009.gif) S and log
S and log![[thin space (1/6-em)]](https://www.rsc.org/images/entities/char_2009.gif) C are related through a linear response law. As shown in Fig. 5, the value of β is 0.8 and 0.49 for SnO/SnO2 at operating temperatures of 180 °C and 280 °C, respectively. The value of β is nearly 1 and 0.5 at different operating temperatures, suggesting that the oxygen ions at the surface are mainly in the form of O− and O2− at 180 °C and 280 °C, respectively. Therefore, the gas-sensing properties show distinct temperature-sensitive effects, which may due to the different reactive activities between the active oxygen species and gases.
C are related through a linear response law. As shown in Fig. 5, the value of β is 0.8 and 0.49 for SnO/SnO2 at operating temperatures of 180 °C and 280 °C, respectively. The value of β is nearly 1 and 0.5 at different operating temperatures, suggesting that the oxygen ions at the surface are mainly in the form of O− and O2− at 180 °C and 280 °C, respectively. Therefore, the gas-sensing properties show distinct temperature-sensitive effects, which may due to the different reactive activities between the active oxygen species and gases.
The real-time gas sensing properties of the as-prepared sample are shown in Fig. 6. It is evident that the response curves toward different gases increase sharply at the optimal working temperature upon increasing the gas concentration and then return to the base-line quickly when the gases are released into the air, indicating quick and reversible response/recovery times. For 100 ppm concentrations of ethanol and acetone gas, the response and recovery times are 10 s/3 s and 10 s/5 s, respectively. A single sensor device based on the SnO/SnO2 composite could be designed to detect ethanol and acetone gas simultaneously by using a thermostatic cycle. The SnO/SnO2 composite sensor demonstrates remarkable repeatability with good stability, as shown in Fig. S7.† The sensing performance exceeds those of SnO2-based hybrid metal oxide nanomaterials for the detection of different gases, as summarized in Table 1.
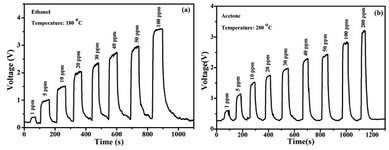 | ||
| Fig. 6 The real-time sensing responses at the optimum operating temperatures upon exposure to (a) ethanol and (b) acetone at different concentrations varying from 1 ppm to hundreds of ppm. | ||
| Composition | Analyte gas | Opera. temp. (°C) | Sensitivity | Concentration | Reference |
|---|---|---|---|---|---|
| p-NiO/n-ZnO | Acetone | 330 | ∼13 | 100 ppm | 13 |
| NiO–SnO2 | Ethanol | 320 | 576.5 | 1000 ppm | 15 |
| RGO–SnO2 | NO2 | 200 | 100 | 5 ppm | 19 |
| Cu2O/SnO2 | H2S | Room temperature | 65.1 | 50 ppm | 21 |
| α-Fe2O3/SnO2 | Ethanol | 225 | 18.4 | 100 ppm | 22 |
| In2O3–SnO2 | NOx | Room temperature | 8.98 | 100 ppm | 23 |
| CeO2–SnO2 | Ethanol | 225 | 37 | 100 ppm | 24 |
| ZnO/SnO2 | H2 | 350 | 18.4 | 100 ppm | 36 |
| SnO/SnO2 | Ethanol | 180 | 47.69 | 100 ppm | This work |
The enhanced gas sensing properties of the SnO/SnO2 composites are likely due to the following factors. First, compared with other samples, SnO/SnO2 sensors based on these heterostructures show remarkably improved performance. The possible reason for this is that SnO and SnO2 could form an in-built electric field at the SnO/SnO2 interface, which drives electron flow from SnO2 to SnO and leaves holes on the SnO2 surface. This process can significantly increase the thicknesses of electron depletion layers, and the response will eventually be enhanced.23 Second, the surface of the sample is O-poor with the appearance of SnO and this leads to Sni defects, which could serve the function of acting as electron donors. Also, absorbed oxygen atoms can form weak O–Sn bonds with Sn atoms at high temperature and become active oxygen species consisting of O2−, O− and O2−. Furthermore, active O ions on the surface may react with gases and release electrons. The activity and the amount of active oxygen are enhanced rapidly with an increase in the reaction temperature. Although a high temperature can accelerate the reaction rate, it also leads to the activation and breaking of bonds, so the optimal temperature of the chemical adsorption–desorption equilibrium position will change with different chemical groups.12,33–37
Conclusions
In summary, SnO/SnO2 composites have been synthesized via a simple and facile solvothermal synthesis method. In order to adjust the ratio of SnO to SnO2, surface modification is combined with oxidation by dissolved oxygen, innovatively. The sensitivity and selectivity of this heterojunction binary composite material improved significantly as a result of synergistic effects between SnO and SnO2. Compared with SnO2, SnO/SnO2 is found to offer better selectivity toward different gases due to the different activities of surface adsorbed oxygen species, and it can be used to detect different gases via a thermostatic cycle. Our work offers a new perspective for improving the performances of chemical resistance sensors.Conflicts of interest
There are no conflicts to declare.Acknowledgements
This work was funded by the National Key R&D Program of China (2016YFA0202200), the Shanghai Rising-Star Program (No. 16QB1402400), and the NSFC (No. 21677095, 51202163 and 11574335).References
- A. Gurlo, Nanoscale, 2011, 3, 154–165 RSC.
- C. D. Gu, H. Zheng, X. L. Wang and J. P. Tu, RSC Adv., 2015, 5, 9143 RSC.
- J. T. Zai, J. Zhu, R. R. Qi and X. F. Qian, J. Mater. Chem. A, 2013, 1, 735 RSC.
- Y. H. Zhu, Y. Zhao, J. H. Ma, X. W. Cheng, J. Xie, P. C. Xu, H. Q. Liu, H. P. Liu, H. J. Zhang, M. H. Wu, A. A. Elzatahry, A. Alghamdi, Y. H. Deng and D. Y. Zhao, J. Am. Chem. Soc., 2017, 139, 10365 CrossRef CAS PubMed.
- Y. J. Jeong, W. T. Koo, J. S. Jang, D. H. Kim, M. H. Kim and Il-D. Kim, ACS Appl. Mater. Interfaces, 2018, 10, 2016 CrossRef CAS PubMed.
- J. C. Shi, G. J. Hu, Y. Sun, M. Geng, J. Wu, Y. F. Liu, M. Y. Ge, J. C. Tao, M. Cao and N. Dai, Sens. Actuators, B, 2011, 156, 820 CrossRef CAS.
- Y. Yue, A. J. Binder, R. Song, Y. Cui, J. Chen, D. K. Hensleyd and S. Dai, Dalton Trans., 2014, 43, 17893 RSC.
- J. Hu, X. Wang, M. Zhang, Y. J. Sun, P. W. Li, W. D. Zhang, K. Lian, L. Chen and Y. Chen, RSC Adv., 2017, 7, 23478 RSC.
- G. H. Li, X. W. Wang, L. Liu, R. Liu, F. P. Shen, Z. Cui, W. Chen and T. Zhang, Small, 2015, 11, 731 CrossRef CAS PubMed.
- R. K. Mishra, G. Murali, T. H. Kim, J. H. Kim, Y. J. Lim, B. S. Kim, P. P. Sahay and S. H. Lee, RSC Adv., 2017, 7, 38714 RSC.
- H. M. Jeong, J. H. Kim, S. Y. Jeong, C. H. Kwak and J. H. Lee, ACS Appl. Mater. Interfaces, 2016, 8, 7877 CrossRef CAS PubMed.
- D. Acharyya, K. Y. Huang, P. P. Chattopadhyay, M. S. Ho, H. J. Fecht and P. Bhattacharyya, Analyst, 2016, 141, 2977 RSC.
- Y. L. Liu, G. Z. Li, R. Mi, C. K. Deng and P. Z. Gao, Sens. Actuators, B, 2014, 191, 537 CrossRef CAS.
- C. Wang, J. W. Zhu, S. M. Liang, H. P. Bi, Q. F. Han, X. H. Liu and X. Wang, J. Mater. Chem. A, 2014, 2, 18635 RSC.
- G. Sun, H. L. Chen, Y. W. Li, Z. H. Chen, S. S. Zhang, G. Z. Ma, T. K. Jia, J. L. Cao, H. Bala, X. D. Wang and Z. Y. Zhang, Sens. Actuators, B, 2016, 233, 180 CrossRef CAS.
- C. Wang, X. Y. Cheng, X. Zhou, P. Sun, X. L. Hu, K. Shimanoe, G. Y. Lu and N. Yamazoe, ACS Appl. Mater. Interfaces, 2014, 6, 12031 CrossRef CAS PubMed.
- W. Ma, F. Zhang, L. P. Li, S. Chen, L. M. Qi, H. W. Liu and Y. Bai, ACS Appl. Mater. Interfaces, 2016, 8, 35099 CrossRef CAS PubMed.
- L. Li, C. W. Zhang and W. Chen, Nanoscale, 2015, 7, 12133 RSC.
- J.-H. Lee, A. Katoch, S. W. Choi, J. H. Kim, H. W. Kim and S. S. Kim, ACS Appl. Mater. Interfaces, 2015, 7, 3101 CrossRef CAS PubMed.
- D. Hu, B. Q. Han, S. J. Deng, Z. P. Feng, Y. Wang, J. Popovic, M. Nuskol, Y. D. Wang and I. Djerdj, J. Phys. Chem. C, 2014, 118, 9832 CrossRef CAS.
- G. L. Cui, M. Z. Zhang and G. T. Zou, Sci. Rep., 2013, 3, 1250 CrossRef PubMed.
- P. Sun, C. Wang, J. Y. Liu, X. Zhou, X. W. Li, X. L. Hu and G. Y. Lu, ACS Appl. Mater. Interfaces, 2015, 7, 19119 CrossRef CAS PubMed.
- S. Xu, J. Gao, L. L. Wang, K. Kan, Y. Xie, P. K. Shen, L. Li and K. Y. Shi, Nanoscale, 2015, 7, 14643 RSC.
- J. Y. Liu, M. J. Dai, T. S. Wang, P. Sun, X. S. Liang, G. Y. Lu, K. Shimanoe and N. Yamazoe, ACS Appl. Mater. Interfaces, 2016, 8, 6669 CrossRef CAS PubMed.
- C. P. Gu, W. M. Guan, X. S. Liu, L. L. Gao, L. Y. Wang, J. J. Shim and J. R. Huang, J. Alloys Compd., 2017, 692, 855 CrossRef CAS.
- L. H. Zu, Y. Qin and J. H. Yang, J. Mater. Chem. A, 2015, 3, 10209 RSC.
- J. Zhang, L. D. Sun, J. L. Yin, H. L. Su, C. S. Liao and C. H. Yan, Chem. Mater., 2002, 14, 4172 CrossRef CAS.
- H. B. Wu, J. S. Chen, X. W. Lou and H. H. Hng, J. Phys. Chem. C, 2011, 115, 24605 CrossRef CAS.
- A. Ahmed, T. Ali, M. N. Siddique, A. Ahmad and P. Tripathi, J. Appl. Phys., 2017, 122, 083906 CrossRef.
- W. Zhou and N. Umezawa, Phys. Chem. Chem. Phys., 2015, 17, 17816 RSC.
- F. K. Shan, G. X. Liu, W. J. Lee, G. H. Lee, I. S. Kim and B. C. Shin, Appl. Phys. Lett., 2005, 86, 221910 CrossRef.
- Y. R. Ge, Z. Wei, Y. S. Li, J. Qu, B. Y. Zu and X. C. Dou, Sens. Actuators, B, 2017, 244, 983 CrossRef CAS.
- Y. P. Li, Q. Xin, L. L. Du, Y. X. Qu, H. Li, X. Kong, Q. P. Wang and A. M. Song, Sci. Rep., 2016, 6, 36183 CrossRef CAS PubMed.
- Q. Wan, Q. H. Li, Y. J. Chen, T. H. Wang, X. L. He, J. P. Li and C. L. Lin, Appl. Phys. Lett., 2004, 84, 3654 CrossRef CAS.
- S. C. Naisbitt, K. F. E. Pratt, D. E. Williams and I. P. A. Parkin, Sens. Actuators, B, 2006, 114, 969 CrossRef CAS.
- H. Huang, H. Gong, C. L. Chow, J. Guo, T. J. White, M. S. Tse and O. K. Tan, Adv. Funct. Mater., 2011, 21, 2680 CrossRef CAS.
- H. S. Mu, K. K. Wang, Z. Q. Zhang and H. F. Xie, J. Phys. Chem. C, 2015, 119, 10102 CrossRef CAS.
Footnote |
| † Electronic supplementary information (ESI) available. See DOI: 10.1039/c8ra09965k |
| This journal is © The Royal Society of Chemistry 2019 |


