 Open Access Article
An online surface water COD measurement method based on multi-source spectral feature-level fusion†
Li Guan,
Yifei Tong,
Jingwei Li,
Shaofeng Wu and
Dongbo Li *
*
School of Mechanical Engineering, Nanjing University of Science and Technology, Nanjing, 210094, P. R. China. E-mail: L.Guan@njust.edu.cn
First published on 11th April 2019
Abstract
To overcome the shortcomings of single or multi-wavelength ultraviolet-visible (UV-Vis) absorbance spectroscopic methods, fluorescence spectroscopic or wet chemistry methods for chemical oxygen demand (COD) measurement, an online detection method based on multi-source spectral feature-level fusion was developed and evaluated. In this method, UV-Vis absorbance spectra (deuterium-halogen lamp as light source) and fluorescence emission spectra (405 nm wavelength laser as excitation source) were measured online by a spectrophotometer (PG2000-Pro-Ex, Ocean Optics). Discrete wavelet transform (DWT) and a successive projections algorithm (SPA) were utilized to realize signal de-noising and feature extraction on the two types of spectra, respectively. Feature-level fusion and least-square support vector regression (LS-SVR) were used to establish the COD measurement model. Through comparison of experiments and results, it is shown that the proposed method has a good performance on both noise tolerance and measurement accuracy.
1. Introduction
Nowadays, water contamination is an important issue, especially in urban areas. Therefore, an online detection system for water quality detection is of great need to protect public health from potentially harmful substances.1As an index to assess the effect of discharged wastewater on the receiving environment, chemical oxygen demand (COD) is an important indicator of organic matter concentration when assessing water quality.2 Thus many scientists have carried out multiple researches on COD measurements. Although there exist national standard COD measurement methods based on wet chemistry, the standard method has the disadvantage of adding toxic chemicals (e.g. mercurate, dichromate, etc.) and is time consuming (requiring 2–4 h).3 Therefore, it is urgent to seek a rapid, high-precision and pollution-free technology for COD measurement to realize online surface water quality detection.
The development of water contaminant detection can be divided into three stages. The first stage was based on wet chemistry with extremely high precision. Due to this, wet chemistry as the international standard method is widely used in laboratories all around the world. Moreover, Oliker et al.4 applied heuristic rules to describe a decision support system, which improved the performance of contamination detection. However, the measurement of these parameters (such as total organic carbon (TOC) and COD) is still time-consuming and reagent-consuming. So overall, although the wet chemistry method has high precision, it can hardly meet the requirement of online detection in actual applications.
The second stage was applying spectrophotometry or electrochemical sensors to realize online contaminant detection. The theoretical basis for those technologies is establishing significant correlations between COD and spectral changes or sensor response under ideal conditions.5 So the main logic for these methods is to obtain the corresponding relationship through a large amount of water sample COD values (measured by wet chemistry) and the corresponding spectral change or sensor response.3,6,7 With regards to the technology based on spectrophotometry, many scientists use the UV-Vis absorbance at 254 nm wavelength as an input, due to the strong linear correlation with organic content and the absorbance at 254 nm under ideal conditions.8 However, the UV-Vis absorbance at 254 nm can easily be influenced by scattering, which can cause a significant deviation and raise the degree of uncertainty in the obtained result. Thus, some scientists have considered UV-Vis absorbance at other wavelengths, such as 350 and 465 nm, as a second input to establish an improved measurement model in order to compensate the influence from scattering. Huang et al.7 proposed a method based on UV-Vis absorbance spectra to detect water quality contamination by spectral approximate entropy (ApEn). The proposed method can realize an online COD measurement and is not sensitive to white Gaussian noise (AWGN), but failed to offer enough precision compared with the standard method. Concerning the technology based on electrochemical sensors, Gutierrez et al.9 successfully applied electrochemical sensors to realize rapid COD measurement in urban waste water. Although showing easy measurability and continual detection, the method does not have good performance for surface water detection with low COD. Generally, the advantage of those methods is quick detection but with the disadvantage of low precision due to the disruption caused by suspended solids in the water.
The third stage is an information fusion model based on multi-source spectra to improve both measurement accuracy and detection speed. Although this type of model could provide a new approach to online water detection, there are less related researches and application-oriented studies. For online water quality detection, Zou et al.10 explored a multi-source spectral feature-level fusion model. This model theoretically solves the low precision problem based on single wavelength measurement techniques. However, the proposed fusion method is too simple and is sensitive to signal disturbance. In some other fields, the fusion information model is widely used11 and shows good application. Pei et al.12 established a decision-level fusion method based on support vector machine (SVM) and Dempster–Shafer evidence theory to improve production quality. Although the effectiveness of the proposed method is demonstrated by a case, this method is established based on a large number of training data and has high computing complexity. Zhu et al.13 successfully proposed a framework of fusion based on least-square support vector regression (LS-SVM) to estimate illumination chromaticity. Through comparison experiment, the proposed method has good performance in terms of both computing speed and accuracy. Therefore, in this paper, we attempt to explore an online COD measurement model with technology of information fusion and LS-SVM, in order to meet the requirement of strong anti-interference, high precision and high detection speed.
Currently, UV-Vis absorbance spectra and fluorescence emission spectra have been widely researched in the area of COD online measurement.14,15 UV-Vis absorbance spectra are susceptible to organic content, which has a close relationship with COD. However, it is also sensitive to inorganic suspended solids. Therefore this method is mainly applied to surface water with simple components. Fluorescence emission spectra are insensitive to suspended inorganic solids and are applicable for water with complex components. However, such spectra are readily disturbed by Raman scattering and Rayleigh scattering.16,17 Meanwhile this detection method is associated with unstable factors such as quenching, self-absorbance and inner-filter effects.18 Therefore, neither of these two methods can totally meet the increasing requirement of measurement precision in environmental monitoring.
Although those two detection methods could theoretically complement each other, there exists a large difference between these two types of spectra in terms of data size and magnitude order. With regards to fluorescence spectra, the data size depends on wavelength resolution, excitation and emission spectral range. Concerning UV-Vis absorbance spectra, the data size depends on wavelength resolution and wavelength range. Generally in the field of water quality monitoring, for certain water samples the data size is unbalanced between the two types of spectra (fluorescence emission spectra are six times higher than UV-Vis absorbance spectra). On the other hand, UV-Vis absorbance spectra are dimensionless but fluorescence emission intensity depends on the concentration and excitation intensity. In this research, in order to simplify our model, we selected a 405 nm wavelength laser with 50 mW power and 5 V rating as the excitation source to provide a constant excitation intensity. Meanwhile the integration time was set as 1000 ms in the spectrometer. Those operations made the fluorescence emission intensity only depend on the organic concentration theoretically. By these foundations, for surface water, we found that the fluorescence emission intensity is much higher than the UV-Vis absorbance value (about four times higher in magnitude).
Selection of the appropriate information fusion model is the first step in this research. The information fusion model can be classified into data-level fusion, feature-level fusion and decision-level fusion. With regards to data-level fusion, based on previous studies, equivalency is needed in both data size and magnitude order. Otherwise, the variable with absolute advantage in data size will mask the contributions from the other variables and will invalidate the data-level fusion model. Concerning decision-level fusion, we require a large number of training data to establish several sub-models with increased computational complexity and sampling cost.
Therefore the focus of this paper is to explore a feature-level fusion measure model, mainly involving spectral data preprocessing (to solve the difference in data size), data normalization (to solve the difference in magnitude order), and LS-SVM model establishment (to improve measure precision and reduce computational complexity).
2. Materials and methods
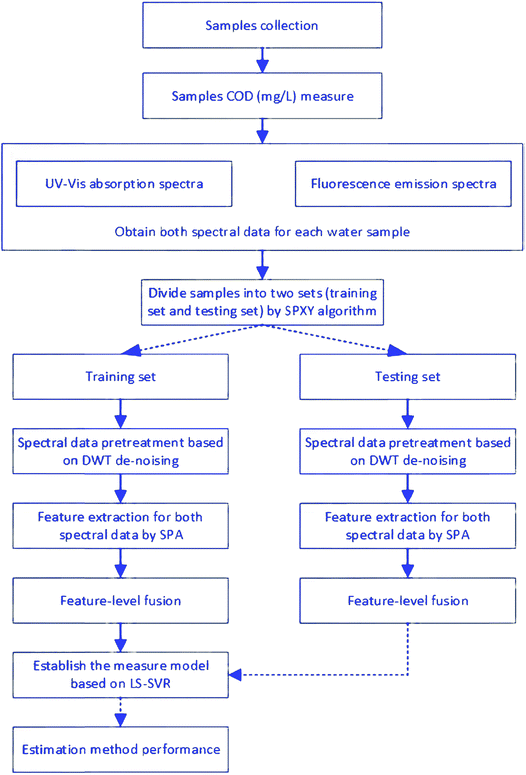
The proposed method for online COD measurement can be divided into six main parts: water sample collection, sample COD measurement (using the standard method), obtaining sample spectral data (UV-Vis absorbance spectra and fluorescence emission spectra), data preprocessing, feature-level fusion, and establishing the measurement model based on LS-SVR.The flow chart of research and online COD measurement method is shown in Fig. 1.
2.1. Samples collection and preparation
In this study, water samples were collected from the top underwater 50 cm level of six water quality monitoring sections in Nanjing, China. A total of 323 samples were obtained between April 13, 2018 and July 27, 2018.Those samples covered temporal and spatial variations. The sampling time was 07:00–18:00. Water samples were subjected to UV-Vis absorbance spectroscopic measurements, fluorescence emission spectroscopic measurements and COD measurements immediately. The collected water samples are shown in Table 1, and detailed information is provided in ESI.†
| Location | Range of COD (mg L−1) |
|---|---|
| Severn Bridge Wen | 0–6 |
| Jiezhizha | 0–5 |
| Nanjing Changjiang Bridge | 0–5 |
| Xuanwu Lake | 0–8 |
| Yangqiao | 0–8 |
| Jiuxiang Estuary | 0–5 |
2.2. Measurement of UV-Vis absorbance spectra and fluorescence emission spectra
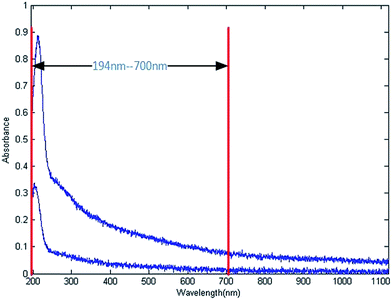
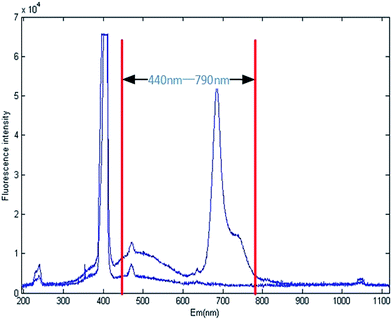
Fig. 2 and 3 show two representative raw UV-Vis absorbance spectra and fluorescence emission spectra of the 323 water samples, respectively. With regards to the UV-Vis absorbance spectra, in order to obtain a stable UV-Vis spectrum, a deuterium-halogen lamp was selected as the light source. Concerning fluorescence emission spectra, the laser quality and low excitation band are considered, thus a 405 nm wavelength laser was selected as the excitation source.For each sample, a spectrophotometer (PG2000-Pro-Ex, Ocean Optics, USA) was used to measure the two spectra. Moreover, the spectra are presented from 196 to 1100 nm by Morpho V3.0 (Ocean Optics, USA) at a room temperature of 20–22 °C. The spectra acquisition was performed with a wavelength resolution of 0.43 nm.
With regards to UV-Vis absorbance spectra, because of the higher signal-to-noise ratio (SNR) between 200 and 700 nm wavelength, only bands within this range were used as input for subsequent processing.
Concerning fluorescence emission spectra, in order to avoid the effect of the excitation source (405 nm) and its enhanced spectral characteristics, we only took bands between 440 and 790 nm as input.
2.3. Standard COD measurement method
Standard COD measurement was carried out using the EPA approved methods. The sample was homogenized for 30 s in a blender. The acid digestion was performed in a dry thermostat reactor (DRB200, Hach, USA) for 2 h at 150 °C. Hach TNTplus HR 25–20, 1500 mg L−1 COD agent with potassium dichromate was used as the oxidizing agent. After the sample was cooled to room temperature, a portable spectrophotometer (DR 2800, Hach, USA) was used to perform the measurement of COD value.62.4. Division of water samples
The total of 323 water samples were divided into two sets by data normalization and a joint x–y distance (SPXY) algorithm. 260 samples were classified in the training set and the other 63 samples were placed into the testing set.Through data normalization, one can avoid the subsequent SPXY algorithm being affected by magnitude order differences between the two types of spectra.10 In this research, we used min–max normalization on the two types of spectral data, respectively. The expression of normalization is shown in eqn (1).
 | (1) |
In order to avoid over-fitting or under-fitting of the subsequent COD measurement model, the SPXY algorithm was taken as the next step to classify samples into two groups: the training set and the testing set.
In the SPXY algorithm, each loop computation can acquire two samples with largest comprehensive distance, and these were grouped into the training set. Through circular computation for 130 times, a training set with 260 samples can be obtained. Meanwhile, the remaining samples were used as the testing set.
2.5. Spectral data preprocessing
For online COD measurement, both UV-Vis absorbance spectra and fluorescence emission spectra could be disturbed by various factors, including power frequency interference from the light sources, variability in hydraulics, suspended matter, and contaminants.19 Thus, it is essential to separate the noise. On the other hand, the spectra of each water sample can be regarded as a high-dimensional vector in subsequent modeling. However, such high-dimensional vectors can lead to many difficulties and challenges during data processing. Therefore, feature extraction technology should also be utilized in preprocessing.
 | (2) |
In this study, a noisy spectrum of a water sample can be expressed as eqn (3).
| x(t) = f(t) + e(t) | (3) |
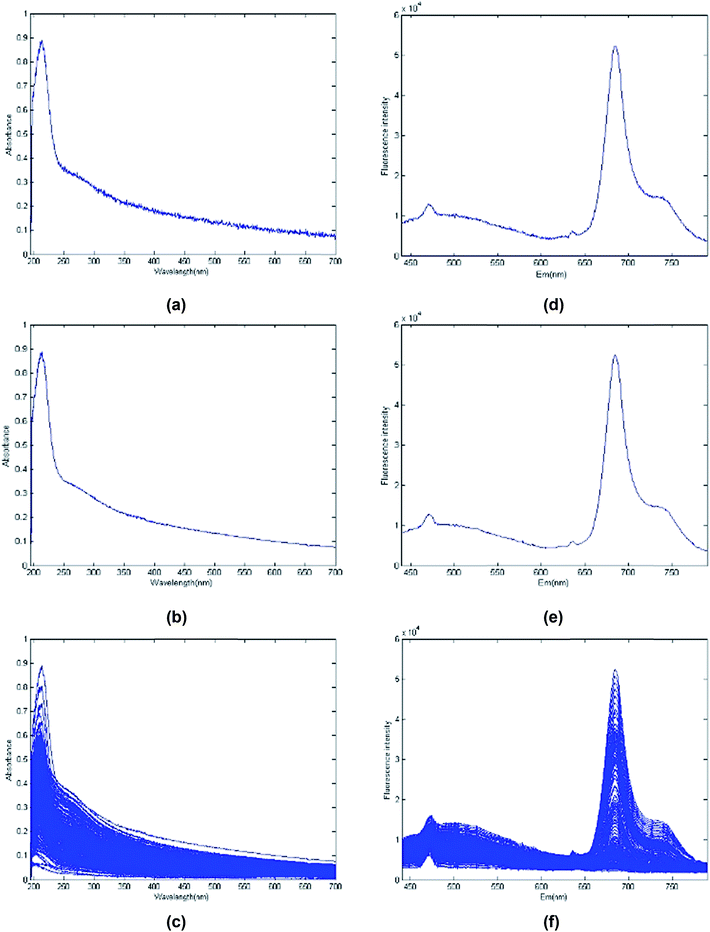
As shown in Fig. 4a, b, d and e, using sym5 at five level decomposition with the hard threshold method can effectively lead to de-noising of sample UV absorbance spectra and fluorescence emission spectra. The 323 de-noised spectral data are shown in Fig. 4c and f.
It starts with one initial feature, then a new one is selected at each iteration (on the principle of minimal redundancy), and end when a specified number of N features is reached.21
In this part, we applied SPA on the two types of spectra, respectively, to achieve precise features. Based on previous studies, under ideal conditions, a significant correlation exists between COD and spectral data at 254 nm (UV-Vis absorbance spectra), and 763 nm (fluorescence emission spectra). Thus, those two wavelengths were regarded as ‘the first feature’ (initial parameter) for the two types of spectra, respectively. The results of SPA are shown in Table 2.
| Spectra type | First feature (nm) | Feature number | Wavelengths (nm) |
|---|---|---|---|
| UV-Vis absorbance | 254 | 6 | 254, 204, 238, 432, 370, 198 |
| Fluorescence emission | 763 | 10 | 763, 654, 500, 717, 781, 459, 631, 774, 474, 685 |
As shown in Table 2, six wavelengths and ten wavelengths were selected as features for UV-Vis absorbance spectra and fluorescence emission spectra, respectively. Theoretically, those features show the lowest collinearity and redundancy. Moreover, the more backward the features shown in Table 2 are, the more relatively stronger the collinearity and redundancy are.
2.6. LS-SVR model
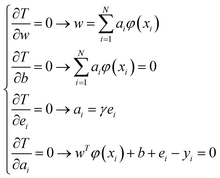
Suykens put forward LS-SVR on the basis of SVR.13 He used 2-norm of fitting error in the objective function and took advantage of equality constraints instead of inequality constraints in SVR, and as a result, the computational complexity was reduced. The unknown function is estimated by LS-SVR by adopting eqn (4).22| f(x,w) = w·φ(x) + b | (4) |
The nonlinear function ‘φ(x)’ is used to map the input space into the high dimensional feature space, and ‘w’ is an undetermined parameter vector.13 Its initial optimization problem is defined as eqn (5).
 | (5) |
 | (6) |
 | (7) |
In this paper, we merged training sample UV-Vis absorbance values and fluorescence intensity values on their own features into one matrix and standardized this matrix. Then regarding this standardized matrix as input, the samples corresponding COD values were as output. These were then taken as training data to establish the LS-SVR model.
2.7. Performance estimation
For evaluating the established model, a convenient standard is the mean squared error (MSE).4
 | (8) |
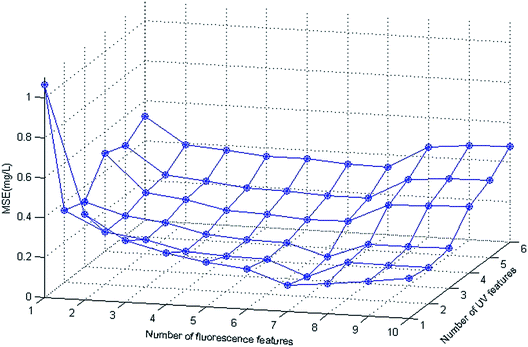
In this research, we took 260 samples classified from SPXY to train the measurement model and took the rest to evaluate the measurement performance of the model. Fig. 5 shows the performance of extracting different features based on the proposed feature-level fusion method.
As shown in Fig. 5, the number of extracted features from the two types of spectra have a big effect on measurement accuracy. The lowest MSE is 0.097, which can be attained using seven fluorescence features (763, 654, 500, 717, 781, 459, 631 nm) and 2 UV-Vis features (254, 204 nm). Compared with the highest MSE (1.065) for one fluorescence feature (763 nm) and one UV-Vis feature (254 nm) the MSE has been reduced by over 90%. This shows that after optimizing feature extractions from the two spectra, that the useful information carried by the two types of spectral features can be fully utilized to improve model accuracy. However, when too many features are selected, the established model will be under-fitted, resulting in a significant accuracy decrease.
Another classical parameter for assessing the established model is the correlation coefficient. The correlation coefficient is defined as the degree of correlation between sample true value (obtained by standard COD measurement) and model output.7 The formula of the correlation coefficient is shown as eqn (9).
 | (9) |
![[z with combining macron]](https://www.rsc.org/images/entities/i_char_007a_0304.gif) denote their average, respectively, and N represents the number of observations.
denote their average, respectively, and N represents the number of observations.
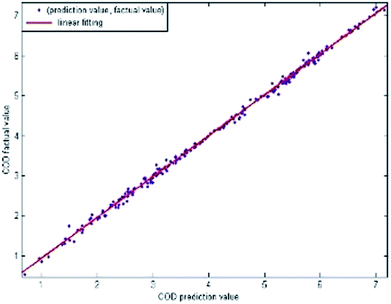
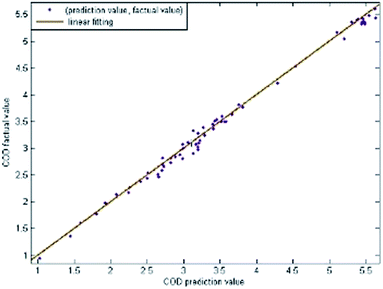
In the following research, we selected seven fluorescence emission features (763, 654, 500, 717, 781, 459, 631 nm) and two UV-Vis features (254, 204 nm) to establish the measurement model. Fig. 6 and Fig. 7 show the performance of the established model on the training and testing set, respectively.
As shown in Fig. 6 and 7, the measurement model proposed in this paper has good performance in both the training and testing sets. Besides, the correlation coefficient can be calculated as 0.990 in the training set and 0.997 in the testing set, thus showing a good fit in the training set and good measurement accuracy in the testing set.
3. Results and discussion
Table 3 shows the comparison between the UV-Vis spectroscopic method (single band: 220 nm), fluorescence spectroscopic method (three bands: 459, 685 and 763 nm), UV-Vis features extraction method (extracted from bands in the region 194–700 nm), fluorescence emission features extraction method (extracted from bands in the region 440–790 nm) and our proposed multi-source spectral feature-based fusion method. Table 3 also provides detailed data processing associated with these methods, such as data preprocessing, modeling, initial parameter settings and final measurement accuracy.| Measurement method | Spectral data preprocessing | Modeling method | Initial parameter settingsa | Measurement accuracy | ||
|---|---|---|---|---|---|---|
| De-noising method | Feature extraction | MSE (mg L−1) | R | |||
| a Initial parameters for the different modeling methods are as follows: ‘n’ represents the highest power of the polynomial, ‘c’ represents the punishment coefficient, ‘σ’ represents the kernel function parameter. | ||||||
| UV-Vis spectroscopic method | Smoothness de-noising | None | Polynomial curves fitting | n = 3 | 0.532 | 0.927 |
| Wavelet de-noising | None | Polynomial curves fitting | n = 3 | 0.395 | 0.943 | |
| Fluorescence spectroscopic method | Smoothness de-noising | None | Polynomial curves fitting | n = 3 | 0.679 | 0.905 |
| Wavelet de-noising | None | Polynomial curves fitting | n = 3 | 0.481 | 0.911 | |
| UV-Vis features extraction method | Smoothness de-noising | PCA | SVR | c = 1.4, σ = 0.37 | 0.329 | 0.952 |
| Wavelet de-noising | SPA | LS-SVR | σ = 0.68, γ = 13 | 0.174 | 0.958 | |
| Fluorescence emission features extraction method | Smoothness de-noising | PCA | SVR | c = 1.2, σ = 0.42 | 0.368 | 0.947 |
| Wavelet de-noising | SPA | LS-SVR | σ = 0.53, γ = 17 | 0.289 | 0.932 | |
| Multi-source spectral feature-based fusion method | Smoothness de-noising | PCA | SVR | c = 1, σ = 0.3 | 0.241 | 0.961 |
| Wavelet de-noising | SPA | LS-SVR | σ = 0.55, γ = 10 | 0.097 | 0.997 | |
As shown in Table 3, the proposed method has better performance compared with other measurement methods. Meanwhile, the technology of ‘wavelet de-noising + SPA + LS-SVR’ has the lowest MSE and highest R, which indicates a high precision in COD measurement.
4. Conclusions
In this paper, an online COD measurement method based on multi-spectral feature-level fusion was developed and evaluated. In this method, discrete wavelet transform (DWT) and successive projections algorithm (SPA) were utilized for de-noising and to extract the features from two types of spectral data, respectively. Feature-level fusion and least-square support vector regression (LS-SVR) were used to establish a COD measurement model. Meanwhile, through experiment, we found the proposed model could attain best measure performance (MSE = 0.097, R = 0.997) with seven fluorescence emission features (763, 654, 500, 717, 781, 459, 631 nm) and two UV-Vis features (254, 204 nm) as inputs to the training model. Moreover, the proposed method has been compared with other methods. According to the evaluation standards, the proposed method is proved to have good performance on both noise tolerance and measurement accuracy.Conflicts of interest
There are no conflicts to declare.Acknowledgements
This work was financially supported by National Key technology support program (2015BAF18B01) and the Jiangsu Provincial Six Talent Peaks Project (No. 2015-ZBZZ-006). These supports are gratefully acknowledged.References
- Y. Sun, Z. Chen, G. Wu, Q. Wu, F. Zhang, Z. Niu and H. Y. Hu, J. Clean. Prod., 2016, 131, 1–9 CrossRef.
- P. Kolosov and V. Yargeau, Sci. Total Environ., 2019, 651, 2139–2147 CrossRef CAS PubMed.
- W. Mai, J. Zhang, X. Zhao, Z. Li and Z. Xu, RSC Adv., 2016, 6, 110460–110465 RSC.
- N. Oliker and A. Ostfeld, Water Res., 2014, 51, 234–245 CrossRef CAS PubMed.
- N. Zhang and D. Shetty, Neurocomputing, 2016, 198, 35–39 CrossRef.
- H. Cao, W. Qu and X. Yang, Anal. Methods, 2014, 6, 3799–3803 RSC.
- P. Huang, K. Wang, D. Hou, J. Zhang, J. Yu and G. Zhang, Appl. Opt., 2017, 56, 6317–6323 CrossRef CAS PubMed.
- X. Deng, D. Yang and J. Xie, J. Geophys. Eng., 2009, 6, 177 CrossRef.
- M. Gutierrez-Capitan, A. Baldi, R. Gomez, V. Garcia, C. Jimenez-Jorquera and C. Fernandez-Sanchez, Anal. Chem., 2015, 87, 2152–2160 CrossRef CAS PubMed.
- X. Zou, J. Zhao, M. J. W. Povey, M. Holmes and H. Mao, Anal. Chim. Acta, 2010, 667, 14–32 CrossRef CAS PubMed.
- Y. Ye, J. Lu, Z. Qian and Y. Wang, Chin. J. Sci. Instrum., 2016, 37, 57–66 Search PubMed.
- F. Q. Pei, D. B. Li, Y. F. Tong and F. He, PLoS One, 2017, 12, e0189189 CrossRef PubMed.
- Z. Zhu, Q. Liu, R. Song and S. Chen, Color Res. Appl., 2015, 12, 237–243 Search PubMed.
- G. M. Haji, A. M. Melesse and L. Reddi, Sci. Total Environ., 2016, 566–567, 1552–1567 CrossRef PubMed.
- A. M. Sánchez, C. Manuel, Z. Amaya, J. M. Carot, J. M. Jabaloyes and G. L. Alonso, J. Agric. Food Chem., 2008, 56, 3167–3175 CrossRef PubMed.
- A. A. M. Ahmed, J. King Saud Univ., Sci., 2017, 29, 151–158 CrossRef.
- A. A. M. Ahmed and S. M. A. Shah, J. King Saud Univ., Eng. Sci., 2015, 12, 20–41 Search PubMed.
- H. Effendi, Procedia Environ. Sci., 2016, 33, 562–567 CrossRef CAS.
- L. Guan, Y. Tong, J. Li, D. Li and S. Wu, Optik, 2018, 164, 277–288 CrossRef CAS.
- S. Kaur and A. C. Horne, Environ. Manage., 2017, 61, 1–11 Search PubMed.
- M. C. U. Araújo, T. C. B. Saldanha, R. K. H. Galvão, T. Yoneyama, H. C. Chame and V. Visani, Chemom. Intell. Lab. Syst., 2001, 57, 65–73 CrossRef.
- F. Chauchard, R. Cogdill, S. Roussel, J. M. Roger and V. Bellon-Maurel, Chemom. Intell. Lab. Syst., 2004, 71, 141–150 CrossRef CAS.
- Y. Qiao and S. Zhang, IFIP Adv. Inf. Commun. Technol., 2016, 368, 325–335 Search PubMed.
Footnote |
| † Electronic supplementary information (ESI) available. See DOI: 10.1039/c8ra10089f |
| This journal is © The Royal Society of Chemistry 2019 |

